DOTBTC 3 scenariosIf we close Daily 24/1 below the triangle we are very likely to visit VAL and bounce
If VAL doesn't hold then very likely we go to the last liquidity area the POC to see a bounce
If we close daily 24/1 within the triangle we remain range bound within the triangle
Polkadot

DOT - POLKADOT 🤠POLKADOT a good project, but at the moment I see it below for a good buy area in the support area $ 10-13

DOT Exchange Trading Idea 22-01-23DOT is at the 83.5% level. If the rest of the market continues to go down, then DOT may see $15. Still not ready to jump in. I would wait for a breakout and retest of the top of this 78.6% zone before it's interesting.

the 1st wave is startingcrab harmonic pattern:
X=$79.6
A=$0.608
AB=0.38 XA
BC=0.88 AB
0.78 BC=$0.561
0.88 BC=$0.716
1.6 BC=$4.24
2 BC=$10.73
0.78 XA=$17.14
2.24 BC=$19.23
0.88 XA=$35
2.6 BC=$48.2
1.13 XA=$202
3.6 BC=$547
1.27 XA=$560
1.41 XA=$1508
1.6 XA=$6709

10 years of LitecoinIf the last 10 years were bearish, we are literally days from the most bullish Litecoin price action seen up to date. This is possibly THE most bullish crypto project out there at the moment.
As always: remember of your risk/reward, have a stop-loss in place, don't forget to take profits.

Kusama - long term tradeI am optimistic on the market in this area, not because this coin gave me profits in the past, but the daily graph is an solid uptrend, despite overall dark atmosphere at the moment... I Love the project, I like what I see on socials and definitely it's my top3 pair in next bull run. Very low Volume, watch out it's going to a bumpy ride!
My strategy: I'm going big on every trade consequently putting very tight stop loss so I can execute that setup again with better numbers instead of being stuck with red bags. Sometimes I might catch stoplosses 2, 4, 6 times before reaching TP.

When will there be DOT price $200 on the Polkadot network?Interesting question ?) Let's look for an answer together.
In the comments below the idea, write your thoughts: what is the fundamental news and development plans of Polkadot network that can lead to such a powerful growth of DOT token value?
Our TA tells us that if buyers manage to keep the DOTUSDT price above $14-18 by the end of 2021, that would be a cool buying zone for a semi-annual investment.
The upside target would be around $200 . So if such a plan is successful, an investment in DOT could bring in x10-x15 depending on the buying point.
Let's find the truth about the future of the DOTUSD trading pair together, in discussion, and then we'll take it to the chart and flesh out this global idea.
_____________________
Since 2016 , we have been analyzing and trading the cryptocurrency market.
We transform our knowledge, trading moods and experience into ideas. Each "like under the idea" boosts the level of our happiness by 0.05%. If we help you to be calmer and richer - help us to be happier :)

Still a long way downBe wary of anyone suggesting there will be any type of significant reversal in the short term. DOT has a lot of way down, before a significant shift back up.
The daily RSI still shows plenty of room to sell and if we mark the weekly averages (pre crypto boom) it would suggest a price between $7 to $8 per coin on DOT.
Without any significant changes, this project will need to continue its downward trend until it humbles itself with where it organically should have grown.
It's time to understand the market is beginning to become wise to having been overvalued.

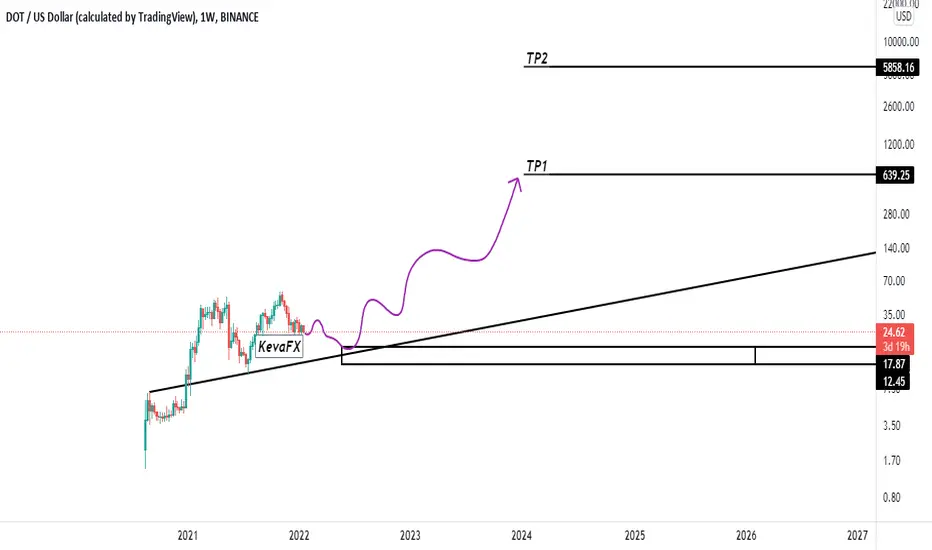
#DOTUSD #Polkadot Target 65$I estimate 2 different path for Polkadot.
I think before new ATH we will test long term support line. But according to BTC moves, it might be now or after H&S formation.
One way or another it doesn't matter at final I believe we will see 65$ within 6 months.


DOT short squeeze coming?The idea is simple. When you look at the lows of summer 2021, shorts were around the same level they are today.
January 21, 2022 we see a spike in shorts and prices reach macro support levels. If this bid to crash DOT doesn't work then the short squeeze that coming will be akin to the one over the summer and we can expect a 200% plus pump between Feb and March.
My guess is that this spike in shorts are retail shorts that are about to get wrecked.

This is is it folks! $17 or $33It is important to state that this is on a log scale chart. If you plot this on a non-log the bottom line of support is closer to $17.
With that in mind we are at our strong macro line of support. We break this we're going down to at least $17 in my opinion.
Bullish case: it looks like were in a descending broadening wedge which tends to break out bullish. I expect to at least get a bounce to test the top of the trend at $25 where we will hopefully break and head to $33.
Bear case: I still think we hit the top of the trend line at $25 and we dump hard. Breaking that macro trend line will require some volume.
Either way keep an eye for $25. Look for volume pickup at the break out.
Ultimately we need to break $33. We're in no man's land until then.

DOT soooo cheapdo not lose polkadot on this heavy support for a 50% profit to first resistance of 38.77 and if it breaks out we test the ATH again


Dot DCA Strategy$dot #polkadot Weekly chart has been hugging super trend support for 2 weeks straight. M
May start a spot position here. DCA at these levels and exit if weekly close below
A lot of upside potential if $BTC keeps pushing up.
——————————————————————————————
Top 10 trading tips:
1. DO NOT FOMO into a trade. Let it come to you. Don’t force it.
2. Find a strategy that works for you and be consistent. Operate like a machine and less like the wind.
3. Let your winners run and cut your losers short.
4. You will not win every trade, but if you are disciplined with great RM you don't need to be right all the time to win!
5. Before you enter a trade, know your target AND your exit strategy.
6. When you are up, you can use a trailing stop or trim off some profit at a logical resistance point with a stop loss at breakeven.
7. Set your trade parameters up front so you keep your self accountable and remove emotions from the equation. (stop loss, take profit levels, etc)
8. Don't fight the trend. The trend is your friend.
9. Don’t enter a trade based on one indicator.
10. Horizontals > Diagonals
Please note:
- This is not financial advice.
- I do not take every trade I post.
- Never trade off of someone else's chart until you DYOR!

POLKADOT and an IMPORTANT DECISION before END OF JANUARY 2022!ALL traders and hodlers of Polkadot wait to see what will happen before commencing February 2022 reaching the price to the new resistance of 28 and attacking to the other levels by taking more volumes during February.
let's see and stay tuned with me during the next month to see the power of paracchains' mother, the majesty of Polkadot and web3!
:)

Polkadot (DOT) need to hold the support by around $23!Polkadot (DOT) need to hold the support by around $23 which is also in line with previous support.

DOT on correction railAfter a long bull run, Dot needs to get some rest and refuel. 12-15 will be a good area for the end of correction.
POLKADOT - DOT FALLING WEDGE - POTENTIAL BOUNCE DOT - Polkadot is between a falling wedge with lower highs and lower lows after the ATH we had, but soon we arrive at a really nice LONG spot and huge support at the trend line . My buy will be between 18$-19$ for a potential long term trade. Wait patiently and buy the dip !
CRYPTODROU
Happy Trading

Further correctionWe expect to see further correction in DOT.
We are in a large correction structure of the abc wave.

DOT --- LONG --- 19.01.22DOT lost 60% since ATH, is it worth buying?
As you can see on the chart, DOT is still inside the ascending channel, and now the coin is trading at its lower border, which is a support or demand zone. In other words, we have a precondition for growth.
Since the moment of the historical maximum (marked with a black tick on the chart), we have seen a decline, and quite aggressively. In fact, the price fell by 60% in just a couple of months. Now the fall has stopped and trading is in the range of 20 to 30 dollars. After such a fall, it would be logical to see an upward movement from this "flat" and the chances are very good for this scenario, while we should not forget that there are still auctions for parachains and DOT coins continue to "drop out of the game" for a long time (about two years), which positively affects the value of the DOT coin
But what would you like to pay attention to...
The technical picture with support at the lower border of the channel is very obvious for market participants, the 60% decline itself after updating the historical maximum indicates that market participants who bought coins with at least x2 leverage are being "knocked out". It won't be surprising now that we will see the price break out of the channel in a downward direction, but if it does, it will be a great buying opportunity.
In this case, as a confirmation of entering the trade, we will have to see a significant increase in volumes - this will confirm the "culmination of sales", after which we are more likely to expect a significant increase.
Of course, it is not a fact that the market will give us such a beautiful pattern, then it might be worth dividing the entry into several parts for the current area and in the case of the "culmination of sales".
Total
If you are positive about DOT in case of high volumes when the support of the upward channel indicated on the chart is broken, it is worth buying.
If you are negative about DOT, then you can try to trade short in case of a false breakout from the current consolidation up.

POLKADOT - Buy Before Sell 💰 We have a great opportunity for short term trades for Polkadot with very minimal risk. We have both a buy setup and sell setup.
Buy Setup:
- Watch for a break of the red descending trendline
- Enter with stops below the recent rejection
- Target the -0.618 fibonacci
Sell Setup:
- When we get to the -0.618 level, watch for rejection
- Enter on rejection with stops above the highs
- Targets: 23, 16, 10
Let us know what you think. Goodluck!

$MOVR/USDT 1D (#KuCoin) Falling wedge on supportMoonriver is looking bottomed here and about to start the reversal if manages to break-out!
moonbeam.network
Risk/Reward= 1:1.5 | 1:3.78 | 1:6.73
Expected Profit= +38.06% | +96.31% | +171.35%
Possible Loss= -25.46%
Fib. Retracement= 0.382 | 0.702 | 1
Margin Leverage= 1x
Estimated Gain-time= 2 months
⚡️⚡️ #MOVR/USDT ⚡️⚡️
Exchanges: Binance, KuCoin
Signal Type: Regular (Long)
Current Price:
169.84
Entry Zone:
166.09 - 150.39
Take-Profit Targets:
1) 218.46
2) 310.64
3) 429.38
Stop Targets:
1) 117.96
