DOT - in these cases may be a good opportunity to buy!!!In a previous idea, we recommended buying DOT after a breakdown of the trend line. But the breakdown did not happen, the price corrected even more. In doing so, the price corrected 55% from its local high and there were huge liquidations.
It's worth noting that there was a huge volume at the bottom on each fall. This is a good signal.
In case of a false breakout of the 22$ level or a breakout of the trendline, there could be a good buying opportunity
Write in the comments all your questions and instruments analysis of which you want to see.
Friends, push the like button, write a comment, and share with your mates - that would be the best THANK YOU.
P.S. I personally will open entry if the price will show it according to my strategy.
Always make your analysis before a trade.
Polkadotusd

Polkadot back to the starting pointPolkadot is currently in a downtrend (weakening) but still in a downtrend, the next move of BTC will be decisive

Polkadot: Shake It! 🤑🤑🤑Now, Polkadot has successfully left its past low behind and is set for a moderate rise in the area between $43.80 - $52.76. However, the price should then start another correction and move to the bottom end of the green zone. Finishing this movement, there is plenty of room on the upside, where the price should push through the resistance at $55.3767.
Let's Go!


Polkadot in the triangleQuick Update.
it's really important to understand this moves and to see where are the zones of potential breakout.
------------------------------------------------------------------------------------------------------------------------------------------------
- The next TP for DOT should be around 35$ (61.8 Fibo + Older Demand Zone) before attempting to come back to ATH.
- in a bad case if DOT not break this triangle the rebuy Zones are composed in 3 parts :
- 21.5$ ( Supported by 3X EMAs Golden Cross )
- 18.5$ ( Supported by EMA300 )
- 10$ ( Bottom again )
------------------------------------------------------------------------------------------------------------------------------------------------
- i won't tell you where to buy but some Zones are not worthy to give a try ( When too close from the Triangle Exit).
- Wait for a strong breakout or wait for a dip.
- Manage your invest and buy wisely, don't go all in on the first buy.
- Follow TheKing and his Dominance because only this influence strongly Polkadot trend.
Happy Tr4Ding

DOT REVERSAL FROM A STRONG SUPPORT ZONEDOT has to flip $41.67 and go to $44, $46 and $48 (shorterm). DOT after a massive sell-off found the support at a strong uptrend trendline.
We have a bullish harmonics on daily timeframe with the strong trendline support.
As long as we hold this low we're moving up!
For longterm I see no reason for Polkadot to not hit $100 - $170 mark!
Let the final mega cycle begin and the real show will get started Handshake
Accumulate the dips while you can and when you can!
If you liked the idea, give it a thumbsup!

Polkadot Schemei never been a moon boy but i like to predict hope.
Everything is always depending on theKing but if we get a new bullish impulse before next year, DOT could follow his master this way.
Remember to manage your invests, Don't go all in, follow BTC movements, keep money to rebuy in case of fail.
The Key is yourself.
This chart is still conservative in the numbers to reach.
--------------------------------------------------------------
Trading Parts
--------------------------------------------------------------
TP1 = 75$ ish
TP2 = 100$ ish
--------------------------------------------------------------
Happy Trading

POLKADOT(DOT) 1H NEAR FUTURE PREDICTIONTechnical Analysis Summary (POLKADOT)
DOT/USDT
TREND ANALYSIS
We have 3 downtrend which is currently active in red
The wider the stronger the downtrend
FUTURE PREDICTIONS
We have many resistanse and support levels that I have mentioned above.
I use thickness as an indicator of stregth of levels (ONLY FOR VISUALS).
Yellow support level are levels from the past (more for explanation purposes rather than entry points)
Good luck everyone, stay safe!
If you need help don't hesitate to send me a message or comment
Trading Involves High Risk
Not Financial Advice
Exercise Proper Risk Management

Polkadot - DOTUSDT Will Hit 55$The price is sitting on the trendline currently and has a very have probability of bouncing OFF to 55 in a couple of days.
Do you have a different opinion about DPTUSDT? please comment below
LIKE idea and follow me please

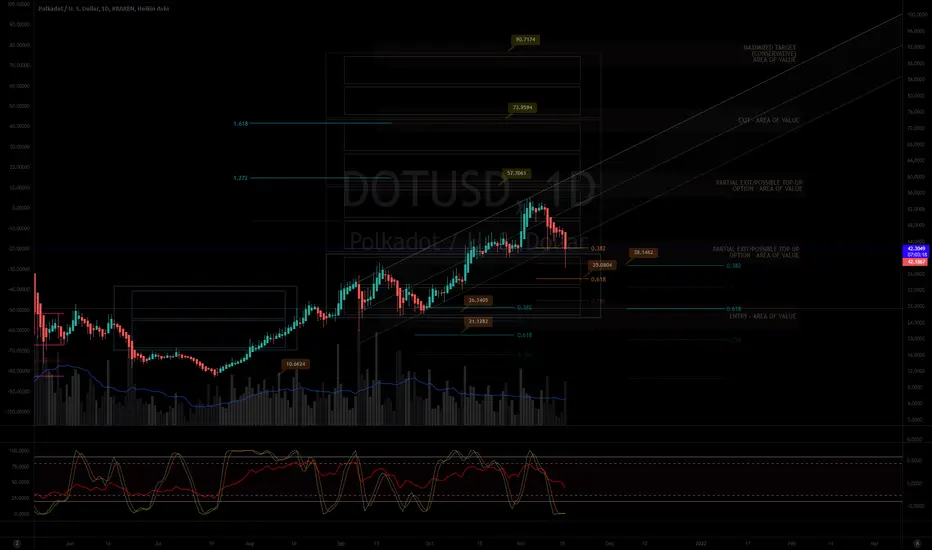
MY MINIMALIST CHART ANALYSIS FOR POLKADOT$DOT
11.16.21
2353H +8 PACIFIC
ALERT: ENTRY POINTS
The Market has amazingly moved along the TOPS and BOTTOMS of our BOXES, signifying TURNING POINTS of PRICE ACTION.
JUST DYOR ENTRIES. Watch for Price action/ RSI and STOCH, VOLUME, and FIBS. Set your tight stop loss as any geopolitical, natural/man-made calamities will change the course for our TARGET AREAS OF VALUES.
REMINDER:
INDICATED ARE ENTRIES, PARTIAL EXITS/TOP-UPS, EXITS, and MAXIMIZED AREAS OF VALUE
"FOLLOW THE WHITE RABBIT!"
Just Follow the TOPS and BOTTOMS of the BOXES as a GUIDE where the MARKET will take you.
HOW TO USE THIS MINIMALIST CHART
Created on a MONTHLY, WEEKLY & DAILY Analysis (The Dynamics of the Market.)
It is designed for SWING TRADES at the BOTTOM. I do not SHORT, though, you can still use it.
You can CLICK AND hold THE CHART and PAN or DRAG IT.
TARGET ZONE IDENTIFICATION
The LARGE BOXES (Tops and Bottoms) are MAJOR pivot points that will occur sometime in the future. While the SMALL BOXES (Tops and Bottoms) are MINOR pivot points.
These can be entries to a BUY/ SELL POSITION, EXIT/PARTIAL EXIT/TOP-UP AREAS,
and, if you wish to hold longer for a MAXIMUM TARGET EXIT AREA OF VALUE - CONSERVATIVE (If price action conditions are right at that given moment.)
At times I include WAY BEYOND PARABOLIC Price TARGETS depending on The Character of the Market (CRYPTOS ONLY).
Watch out for your Volume, Chart Patterns, Candlestick Math, FIB COILS ( ABC ), Price Action, FIB LEVELS, Market Dynamics, especially institutional and retailer trading psychology.
Wishing you all The Best Trades and Thank you all for your Appreciation and Support of My Work.
Much thanks to My 3 Mentors. They are so much of a Blessing that I also wish to Share.
Vive Le Autist!
Vive Le Egalitarianism!
DOTUSD Ascending Scallop Pending BreakoutDOT can be seen to continually reject the price along this chart pattern line
It is called an ascending scallop
and they love to break out to the upside even further when the formation is completed (green oval)
Big upsides coming

PolkadotPolkadot is beginning to weaken, not only in itself, but particularly in comparison to that of Bitcoin.
As we've discussed at length here on TW, Bitcoin continues to show some bullish sentiment due to its recent technical breakout in MARA/BTC. As long as this pertains, we'll stick with the majority of our position in Marathon Digital Holdings.
60 percent of my portfolio is currently in Marathon. The remaining 40 percent is spread out in alts. With that said, I might consider reallocating a good chunk of those alts into Marathon as a few of them show emerging weakness, both individually, but even more so when directly compared to Bitcoin.
On the Poladot versus Bitcoin chart, the price was once again rejected by the horizontal resistance zone - and this after a minor fakeout. On top of that, the price has recently dropped below the diagonal support as well and is presently trading in a weak spot.
And to add fire to the flames, we also have a 3-point RSI divergence on the daily chart.
If this bearish internal trend were to continue, it naturally doesn't mean the price of Polkadot may go down. All it means is that Polkadot will then be expected to under perform versus that of Bitcoin.
Let's then dig a bit deeper to find more clues of the overall market health condition.
If we proceed to look at Polkadot itself (as in compared to the USD), we can firstly detect that it's trading right at the horizontal support zone. On top of that, the RSI looks strong too and for two reasons.
Firstly, it has retraced quite much - by almost 20 points to be precise - from a mere and seeming price correction.
Secondly, it is still trading within a strong bullish red RSI channel.
So far it shows every sign of health. This in combination with the strong horizontal support zone and the thus far strong bull trend gives me no reason whatsoever to be bearish on Polkadot. Quite the opposite!
This means that if we put the just-turned-bearish DOT/BTC next to the nicely and bullish-looking DOT/USD we can technically conclude that Polkadot's trend is up, but that it is yet statistically bound to under perform versus that of Bitcoin. This in turn leaves us with the conclusion that Bitcoin is even more bullish.
To further add weight to our technical case - as in to further increase the probability of being correct - we will soon proceed to compare more individual alts and their respective strength-relationship to that of Bitcoin.
But for now, it's Bitcoin season 1 - altcoin season 0, yet with both looking technically bullish regardless.

POLKADOTPolkadot price has been trading in a tight range since November 11. However, one indicator suggests that a bullish breakout is likely. This potential move could set a new all-time high for DOT.

Polkadot pricePolkadot price has moved below the daily Kijun-Sen for the first time since September 30th. This could trigger some increased selling pressure that extends through the weekend.

$DOTUSD - Major support retestedHello everyone!
DOTUSD just retested a major support during the flash crash of November 10.
If DOTUSD remains within this parallel channel, Polkadot will double.

DOT price rebound and new directionDOT is under strong influence of BTC and it will depend on BTC for further direction, we will see how BTC behaves in the coming days

Polkadot Needs a correction for the next breakoutDotusd Now in 50.40 usd. polkadot parachain is going now. Voting will close after 11 november . Reward will publish 21/12/2021 . polkadot should correction to 32.84 usd .because binance will unlock the dot

POLKADOT+FIBO=GAIN✨💥📈hi guys
just look support and fibo line and make chill
-break strong resistance and retest it and make power to gain
-thank for support
make me happy by like
thanks to TRADINGVIEW support team

Polkadot (DOT) next move. Very Similar to SOL of course. In this case, I am expecting a fill of the inefficiency on price. If it goes below the red line I am expecting it to drop a bit further down.Polkadot might explode very high.
I might be wrong. This is not financial advice.

#DOTUSDT will reach to $100 #DOT broke out the resistance in the area of 46 bucks and did an amazing pullback
#Polkadot midterm targets can be 63 - 77 - 91 - 100 - 150 - 250

Hodl Polkadot! With positive news and technical analysis on $polkadot bullish is the only way.
Breaking down trendline and pattern breakout.

Dot heating up the engines for Upvember?DOT makes a new ATH and currently in price exploration. Daily RSI is not even in overbought territory and momentum is upwards. On the 4h DOT has a nice close above $50 resistance, turning support. With the parachain auctions coming up Polkadot is just heating up for November imo.

DOT could take a Breather Above $46 Hitting New ATH
The Polkadot price has risen 14% over the last 24 hours as DOT hit a new all-time high at $50.87.
The Polkadot network moves toward increased functionality as parachains loom.
The Polkadot price rallied approximately 24% on Monday to register a new record high at $50.87, rising above the $49.35 May record high.
Increasing functionality of the Polkadot blockchain network provides the hind wind propelling the DOT bullish run.
Parity technologies, the company behind Polkadot announced that “parachains” were coming to the network on October 13. Parachains (parallel blockchains) refer to full blockchains that will be incorporated into the Polkadot blockchain network to aid in validating and securing transactions. Polkadot's aim is to increase the interoperability of blockchain networks hence becoming the blockchain for blockchains. This will make the Polkadot network a layer-zero protocol.
After the announcement, the demand for Polkadot increased as both the DOT price and trading volumes skyrocketed. However, prior to yesterday, the price was held in a tight price range between $40 and $45.
Polkadot Price Rallies 14% To Set New Record High s
DOT price bounced off the demand zone (green band) at $40.56 at the end of the weekend as illustrated by the long lower wick on Sunday’s candlestick. This is an indication that investors were getting in on the dips.
This bolstered the DOT bulls on Monday who have pushed the Polkadot price 14% upwards over the last 24 hours. A rally that saw the asset hit a new record high at $50.87.
The bears, however, are determined to pull the DOT price down. If Polkadot turns down from the current price around $48.56 it will find support at the $46.30 level.
Therefore, expect DOT to take a breather at the end of the supply zone at $46.30 after which a resumption of the upward movement to new record highs above $50 will be the next logical move.
On the downside, a slip below the $46.30 level could see the Polkadot price drop to tag the 50-day SMA at $36.76.
