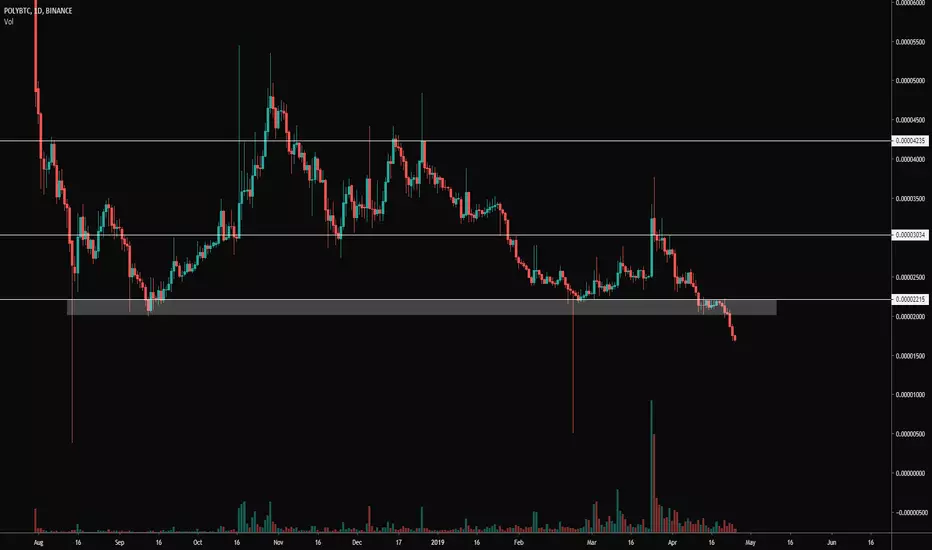
POLY-BTC good entryPOLYBTC is situating in descending channel and price touched this support line.
RSI is bellow 30 (~25)
This is a good entry 1500-1700 sat
Target is ~2000-2300-2600-2800-3150,
POLY

$POLY Broke ATL support to the downside....$POLY "The Future of Wall Street" Broke ATL support to the downside.... entering into price discovery...
I wont be looking at this asset till 500sats is met OR strong reversal signals are displayed.
#POLY

There is a trading opportunity to buy in POLYBTCTechnical analysis:
. POLYMATH/BITCOIN is in a range bound and the beginning of uptrend is expected.
. The price is below the 21-Day WEMA which acts as a dynamic resistance.
. The RSI is at 42.
. While the RSI downtrend and the price downtrend in the daily chart are not broken, bearish wave in price would continue.
Trading suggestion:
. There is a possibility of temporary retracement to suggested support zone (0.00002460 to 0.00002067). if so, traders can set orders based on Price Action and expect to reach short-term targets.
Beginning of entry zone (0.00002460)
Ending of entry zone (0.00002067)
Entry signal:
Signal to enter the market occurs when the price comes to " Buy zone " then forms one of the reversal patterns, whether " Bullish Engulfing ", " Hammer " or " Valley " in other words,
NO entry signal when the price comes to the zone BUT after any of the reversal patterns is formed in the zone.
To learn more about " Entry signal " and the special version of our " Price Action " strategy FOLLOW our lessons:
Take Profits:
TP1= @ 0.00002916
TP2= @ 0.00003470
TP3= @ 0.00004290
TP4= @ 0.00004730
TP5= @ 0.00005220
TP6= @ 0.00006420
TP7= @ 0.00009160
TP8= @ 0.00013570
TP9= Free

Daily Bullish Signal $POLY #POLY #POLYBTC #BTC $BTC (01-04)RED ARROW indicates the EXPECTED Time and Targets
Level Stoploss point up to maximize profit and reduce risk
I'm working all the time, even in Bearish Market


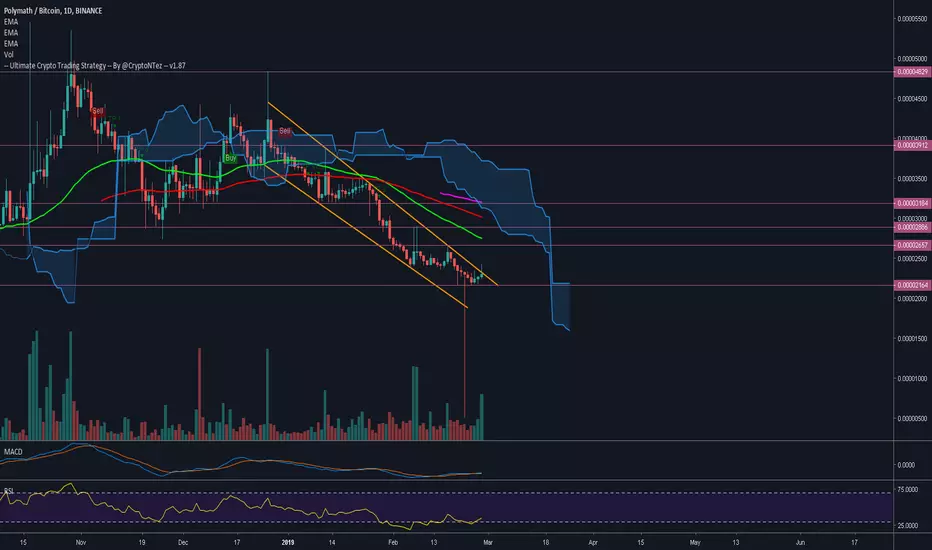
About to break this descending channel.About to break this descending channel.
Sitting at ATL support, UCTS showing a buying signal already in the 6h chart.
MACD starting to rise. RSI bouncing from oversold levels.
Volume showing some slowly rise. Potential targets on the chart...
POLY Double Bottom Wyckoff Accumulation EventDouble Bottom — "Absorption at higher level" Trading Range found on POLYBTC chart, and now price in a good zone to take a trade.
This is last pattern in series of Wyckoff Accumulation Events
Previous patterns you can see here:
Head and Shoulders / Saucer:
Cup and Handle:
Ascending Channel:
Descending Wedge:


Poly/BTC- expected upward movementBased on the chart I expect Poly is ready to reach the target, IF THE MARCET STAYS STABLE FOR AT LEAST A WEEK!

There is a trading opportunity to buy in POLYBTCTechnical analysis:
. POLYMATH/BITCOIN is in a range bound and the beginning of uptrend is expected.
. The price is above the 21-Day WEMA which acts as a dynamic support.
. The RSI is at 60.
. While the price downtrend in the daily chart is not broken, bearish wave in price would continue.
. The RSI downtrend is broken, so the probability of the resumption of an uptrend is increased.
Trading suggestion:
. There is a possibility of temporary retracement to suggested support zone (0.00002411 to 0.00002009). if so, traders can set orders based on Price Action and expect to reach short-term targets.
Beginning of entry zone (0.00002411)
Ending of entry zone (0.00002009)
Entry signal:
Signal to enter the market occurs when the price comes to " Buy zone " then forms one of the reversal patterns, whether " Bullish Engulfing ", " Hammer " or " Valley " in other words,
NO entry signal when the price comes to the zone BUT after any of the reversal patterns is formed in the zone.
To learn more about " Entry signal " and the special version of our " Price Action " strategy FOLLOW our lessons:
Take Profits:
TP1= @ 0.00002970
TP2= @ 0.00003470
TP3= @ 0.00004290
TP4= @ 0.00004730
TP5= @ 0.00005220
TP6= @ 0.00006420
TP7= @ 0.00009160
TP8= @ 0.00013570
TP9= Free

Polymath Getting Ready -Full Trade [POLYBTC](102% PP)Polymath (POLY) Overview
The Polymath network connects token investors, KYC providers, smart contract developers and legal experts who help form the basis of your securities token.
Polymath (POLYBTC) Chart Analysis
Here is a new trade for Polymath, this one generated really good profits for us in the past:
High volume starting now.
Bullish MACD and RSI.
Low risk, high reward.
Over 100% profits potential.
Trade instructions Polymath by Alan Masters
Buy in: 0.0000231 – 0.0000264
Targets for POLYBTC by Alan Masters:
(1) 0.0000291
(2) 0.0000331
(3) 0.0000371
(4) 0.0000411
(5) 0.0000451
(6) 0.0000481
(7) 0.0000535
Notes:
Not all targets are meant to be reached. You are supposed to sell as soon as we hit our first target and start collecting profits.
Stop loss should be raised after we start to hit our targets.
You can also buy and forget, hold long term, and aim for the higher targets.
Stop loss: Close below 0.0000197 on the weekly candle.
Capital allocation: <5%.
NOT YET… TIME PREPARE
Wait a minute. Sometimes it is good to wait.
We might get excited and all, but the system not being ready, means we have more time to reflect.
More time to prepare, to train, to relax.
Wait… Not yet…
At its own pace… on its own time…
All of your true desires will come to pass.
Namaste.


Look What i found_everything is ready for a great ProfitLook What i found_everything is ready for a great Profit

POLY , can we see another attempt please?Not much to say, bias bullish, currently in uptrend, hoping we see a nice 10% move soon.


Divergence formed in Polymath (POLYBTC)Buy Polymath above 2430 Stoploss below 2150 take profit 2940 ....Divergence formed in one day chart.. maximum trade value is 10-20% of your portfolio.
You can buy if price crosses 2430 level..


Daily Bullish Signal $POLY #POLY (11 Feb 2019)RED ARROW indicates the EXPECTED Time and Targets
Level Stoploss point up to maximize profit and reduce risk
I'm working all the time, even in Bearish Market

POLY-BTC Long Trade PlanCommodity : POLYMATH
Trade Type : LONG
Trading Against : BITCOIN
Entries : Double-UP Entries throughout the Buy Zone
Profit Taking : 25% at each TP point
Profit Locking : Move SL to break even once TP1 is hit, to TP1 once TP2 hits, to TP2 once TP3 hits and so on
Duration - 1-2 weeks
Investment in trade : 10% of the total Trading Balance.
Prospective Profit : 8% to 28%
Prospective Loss : 4.5%
RRR : SL to TP1 is 2.14, SL to TP2 is 3.35 , SL to TP3 is 6.62
Buy Zone/TPs/SL price points are marked in the chart as follows
Greens - Profit Targets (TPs)
Blue - Buy Zone (Entries)
Red - Stop Loss (SL)

Polymath Polymath
The Polymath platform has the overall aim of providing legal and technical expertise to facilitate tokenization of various financial assets and instruments. The platform has managed to pull token issuers, legal experts and technical professionals together in order to build an ecosystem which harbors the ability to assist in the production of tokens which are fully regulatory-compliant on the Ethereum blockchain.
The platform uses the POLY token as a medium of exchange for all key operations which include payments relating to the development of new securities tokens and the buying of new tokens created on the platform.
In technical we touched support line of the trend line and this is good opportunity to buy at this level. Swing trading
