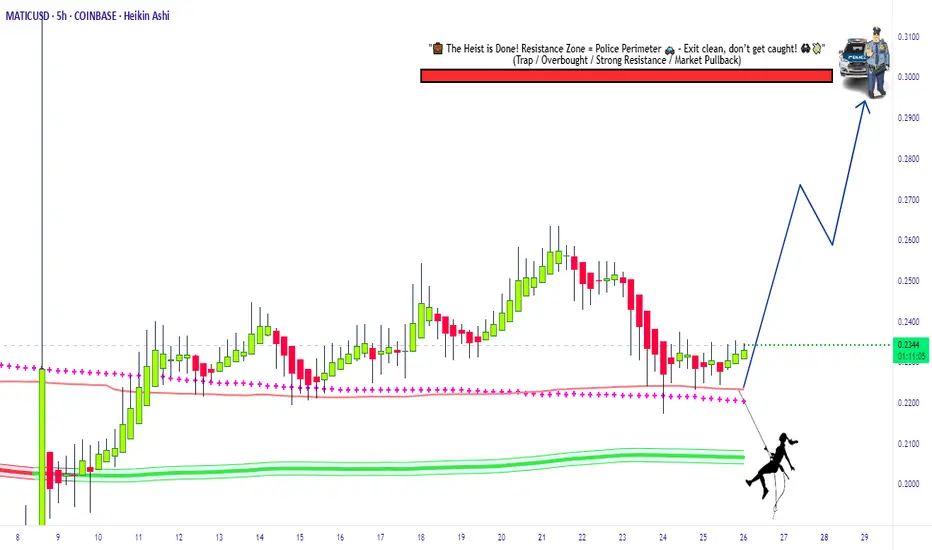
Swipe the Polygon Vault MATIC/USDT Bullish Heist Strategy🔥 MATIC/USDT Heist Plan: Swipe the Loot Before the Cops Clock In! 🏴☠️💸
🌍 Oi! Hola! Bonjour! Hallo! Marhaba!
💼 Welcome back, Money Makers & Market Bandits!
The Polygon (MATIC) vs Tether vault is wide open! Based on our 🔍 Thief Trading Style Analysis, it's time to plan the ultimate crypto chart robbery with a long-side assault on this bullish breakout. 📈💥
💣 Robbery Blueprint – The MATIC/USDT Master Plan
🚪 ENTRY STRATEGY: Get In, Get Rich, Get Out!
⚡ Vault Breach: Enter LONG at market price if you're bold & fast.
🎯 Smart Entry: Wait for price pullbacks on 15m/30m swing lows/highs.
💎 Use layered DCA-style orders for clean risk-controlled entries.
Thieves don’t rush—they snipe the perfect price levels.
🛑 ESCAPE PLAN: Stop Loss Strategy
📍 SL placed at: 0.2000 (based on 4H candle wick zone).
💡 Adjust SL to your loot capacity (risk, lot size, number of orders).
⚠️ If price dips near SL, that’s the cops knocking—bail fast or go down swingin’.
🎯 TARGETS: Stack Your Bags Before the Alarm Rings
🚀 Primary Target: 0.3000
🧲 Scalpers: Grab & Go! Stick to long bias only. Use trailing SL to protect the gains.
🎩 Swing Robbers: Hold strong. Watch for resistance traps & trailing stops near key zones.
📊 Market Intel: Why This Heist Has High Odds 🎯
🔋 Bullish pressure building with growing momentum.
📡 Supporting Data:
🔍 On-chain metrics signaling accumulation
💼 Macro sentiment favoring risk assets
🧠 COT reports + intermarket analysis leaning bullish
Just don’t get comfy—this is a heist, not a honeymoon!
🚨 Trade Warning – Don’t Get Caught!
📢 Major News Releases = High Volatility.
🚫 Avoid fresh trades during key announcements.
🔒 Use trailing SL to lock in profits & escape clean.
💥 Like, Follow & Power Up the Robbery Squad 💥
💬 Support the crew. Hit BOOST to keep these trade ideas flying.
Your thumbs-up fuels the next chart breach. 💪
📡 Stay locked in—more heist setups coming soon!
🎯 Trade Sharp. Swipe Smart. Escape Fast. 🏴☠️
Thief Trader Out. 🐱👤💰
Polygon
POLUSDT 1D AnalysisPOL ~ 1D Analysis
#POL This coin is currently at its lowest support. Buy if you still have confidence in this coin with a short term target of at least 15%+ from this support.

#POL/USDT#POL
The price is moving within a descending channel on the 1-hour frame and is expected to break and continue upward.
We have a trend to stabilize above the 100 moving average once again.
We have a downtrend on the RSI indicator, which supports the upward move by breaking it upward.
We have a support area at the lower limit of the channel at 0.2000, acting as strong support from which the price can rebound.
Entry price: 0.2023
First target: 0.2053
Second target: 0.2091
Third target: 0.2134

Polygon, Higher Low? Easy 1,000% Profits PotentialFour weeks red! Do you really believe the market will continue moving lower? If the answer is yes; think twice, stop! Think again.
Four weeks red is all that you will get you bearish bastard.
Your time is over. We are taking over, the bulls are entering the game.
You had your fun, you had it for a few days.
You can't have it anymore, I am calling my friends.
Friends, look at Polygon (POLUSDT), the chart looks great.
Whenever there is a retrace within a bull market, this is an opportunity to enter again.
Great timing, great prices; the start of a new bullish wave.
Prices are about to grow... Everything is about to grow... Crypto is going up. Are you in or are you out? Did you miss the initial bullish breakout? That's ok. The next bullish wave will 4-6 times bigger than the previous one for this pair. Sometimes even more. Here we have 1,000% profits potential as an easy target.
Get ready and be sure to be prepared.
Start buying like the world is about to end. Why?
Because there will be so much growth in the coming days, that you want to profit all the way. To profit you need to be in, you have to buy when prices are low.
You cannot wait for the green candle, the best time is now.
Thanks a lot for your continued support.
Namaste.

POL: Ideal Bullish SetupDuring early April to mid-May, #POL had one of the strongest bullish rises among top-tier projects.
The ongoing correction appears to be a healthy pullback before the next major leg up.
Holding above $0.15 keeps the setup valid. Passing $0.257 confirms a new rally.
#Polygon

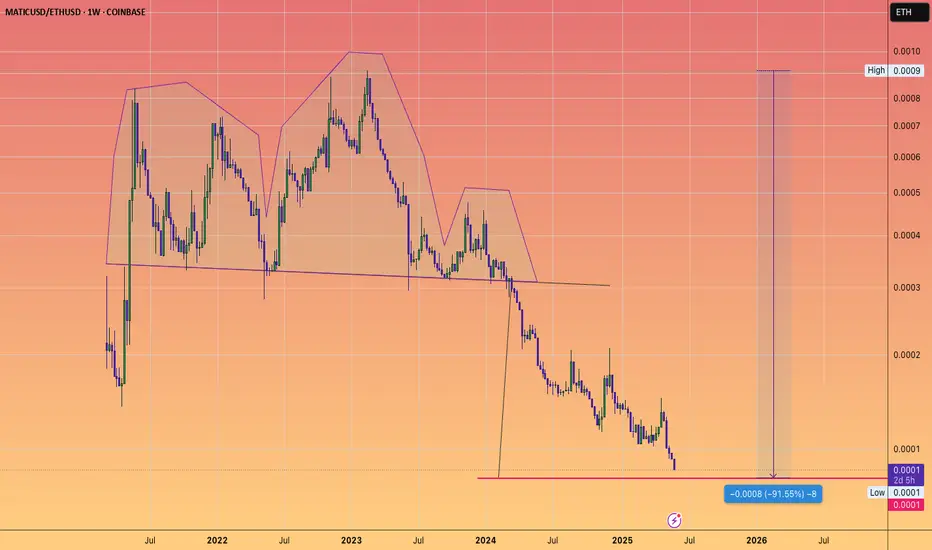
MATIC approaching Head and shoulders target...versus ETH
which would be a -91% loss of value versus the second most important crypto
PoL - Long Set-UPBINANCE:POLUSDT
Current Price: ~$0.2207
Support Zone: $0.18 – $0.20 (highlighted in orange)
SL Below: 0.16
Target - 0.22 , 0.25++
Structure: Price recently broke below a trendline and retested a previous support-turned-resistance (green zone).
Volume: Decreasing, suggesting weakening bearish momentum

Polygon: More (short-term) Upward PotentialFor Polygon’s POL, we primarily expect further corrective rises during the blue wave (iv), but below the $0.51 mark, renewed sell-offs should take over. These declines should then drive the price down below the support at $0.15, allowing the large wave to reach its conclusion there. Our alternative scenario – where the low of wave alt. in green would be already behind us (probability: 33%) – is still relevant. This scenario would be reinforced with a jump above the resistance at $0.51 but only finally confirmed with increases above the next higher level at $0.76.
📈 Over 190 precise analyses, clear entry points, and defined Target Zones - that's what we do.

Possible bump-and-run bottom reversal over BTC. Polygon/Matic Massive bump-and-run against BTC, it may turn into an interesting entry point for this altseason. Be patient

POL/USDT Potential UpsidesHey Traders, in today's trading session we are monitoring POL/USDT for a buying opportunity around 0.2200 zone, POL/USDT is trading in an uptrend and currently is in a correction phase in which it is approaching the trend at 0.2200 support and resistance area.
Trade safe, Joe.

POLUSDT 1D Analysis POL ~ 1D Analysis
#POL Buy gradually from here if you still have confidence in this coin with a short term target of at least 15%++ from here.

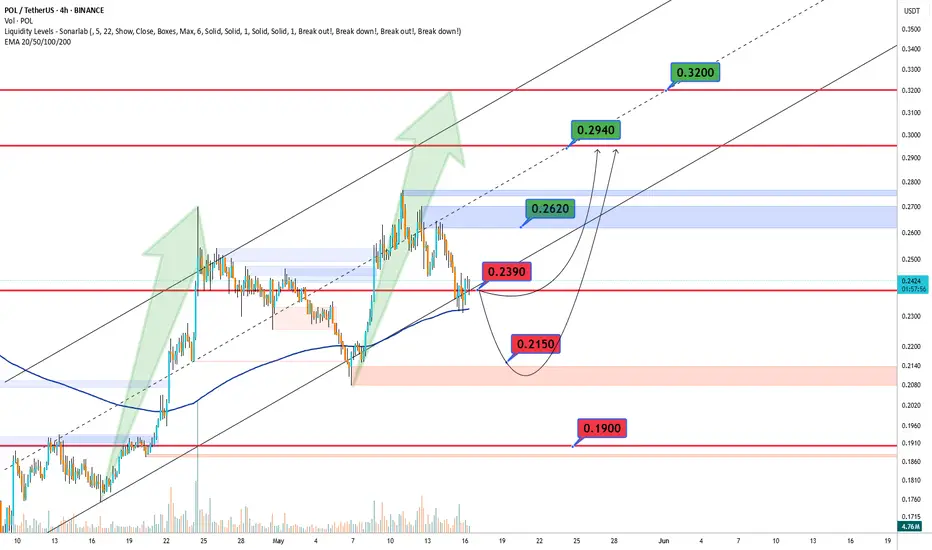
POLUSDT Bullish🔍 BINANCE:POLUSDT Technical Outlook – May 16 🔍
Bulls are watching the key $0.2390 level! 🔼
If broken, we could see a rally towards $0.2620, then $0.2940, and even $0.3200 if momentum stays strong 🚀
But if price gets rejected... 👀
Watch support at $0.2150 – and if that fails, $0.1900 could be next 🛑
📊 Current zones to watch:
🔴 Resistance: $0.2620 | $0.2940 | $0.3200
🟢 Support: $0.2390 | $0.2150 | $0.1900
Polygon's Comeback!#Polygon, a leader of the Ethereum ecosystem since 2019, shows signs of a major comeback after its recent bounce.
Maintaining $0.15 keeps the bullish case valid. Passing $0.28 is the first confirmation, while clearing $0.77 paves the way to target the ATH.
#Matic

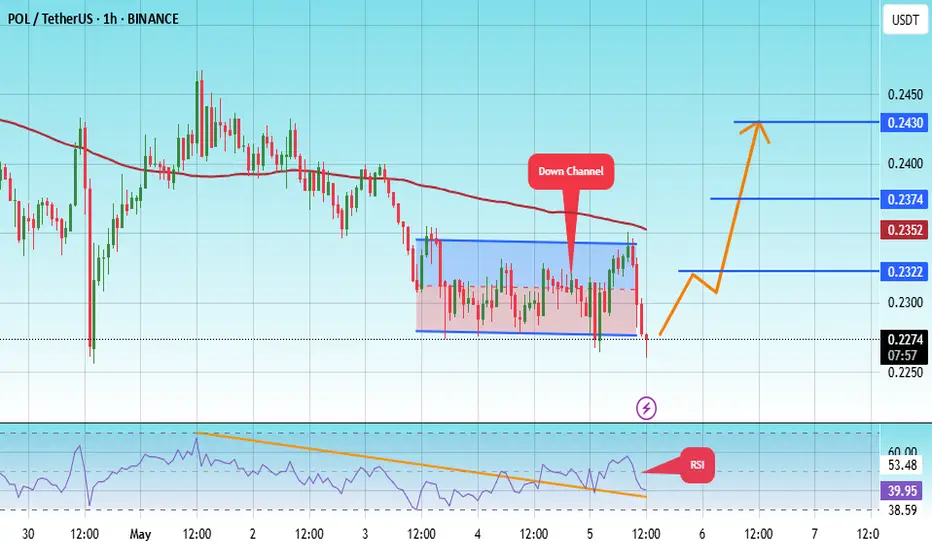
#POL/USDT#POL
The price is moving within a descending channel on the 1-hour frame, adhering well to it, and is on its way to breaking it strongly upwards and retesting it.
We are seeing a rebound from the lower boundary of the descending channel, which is support at 2270.
We have a downtrend on the RSI indicator that is about to break and retest, supporting the upward trend.
We are looking for stability above the 100 moving average.
Entry price: 0.2270
First target: 0.2322
Second target: 0.2374
Third target: 0.2430
Polygon Ecosystem Token Last Chance, It Is Not Too LateLet's close the day with a classic —RSI bullish divergence.
Polygon Ecosystem Token (POL) has been moving lower and hit bottom on the 7th of April. It's RSI on the other hand isn't doing the same, it bottomed in early July 2024. While POLUSDT went on to produce lower lows, its 3D RSI has been doing higher lows. This is a very strong bullish divergence and also a classic reversal signal.
This signal coupled with volume and marketwide action confirms that the bottom is in.
This pair is going through a pause now, a small one, before additional-huge growth.
The market is giving us one last chance to buy all we want before massive growth.
When the next move starts, there will never be a chance to buy at prices like we have now today. This is good. Cryptocurrency will evolve and the entire world will benefit.
This is a friendly reminder.
Time to work. Wake up!
It is not too late.
Namaste.

#POL/USDT#POL
The price is moving within a descending channel on the 1-hour frame, adhering well to it, and is heading for a strong breakout and retest.
We are experiencing a rebound from the lower boundary of the descending channel, which is support at 0.2400.
We are experiencing a downtrend on the RSI indicator, which is about to break and retest, supporting the upward trend.
We are looking for stability above the 100 moving average.
Entry price: 0.2480
First target: 2565
Second target: 0.2645
Third target: 0.2734

POLUSDT 1D AnalysisPOL ~ 1D Analysis
#POL Buy gradually from here if you still have a Conviction on this coin with a short -term target of at least 15%+ from here.
Polygon POL ex-MATIC price analysisIs the price of #POL ex-#Matic starting to wake up?
For those who are new to the crypto market, we will remind you that the last time the price of OKX:POLUSDT grew significantly was back in 2020, and since 2021 it has been in a downward trend.
The main task for #POLUSD buyers is to try to fix the price above $0.30.
📈 Only after this condition is met can a difficult and thorny path of growth to $0.66 open up.
There will surely be many people willing to sell #Polygon along the way, after 4+ years of sitting in a drawdown.
_____________________
Did you like our analysis? Leave a comment, like, and follow to get more

POL is breakout out of the descending wedge upper trend line.POLYGON is now trading outside the upper trendline of the descending wedge pattern and may be preparing for a substantial move in the month of May.
Good luck, and always use a stop-loss!

POL: The Return of The Matic#POL recently bounced in what could be a bullish reversal, possibly marking the end of a 3-year corrective major wave (4).
If the $0.151 low holds (stop-loss), a massive bull run shall start for #MATIC.
Passing $0.768 confirms the bullish idea of targeting the ATH.
#Polygon

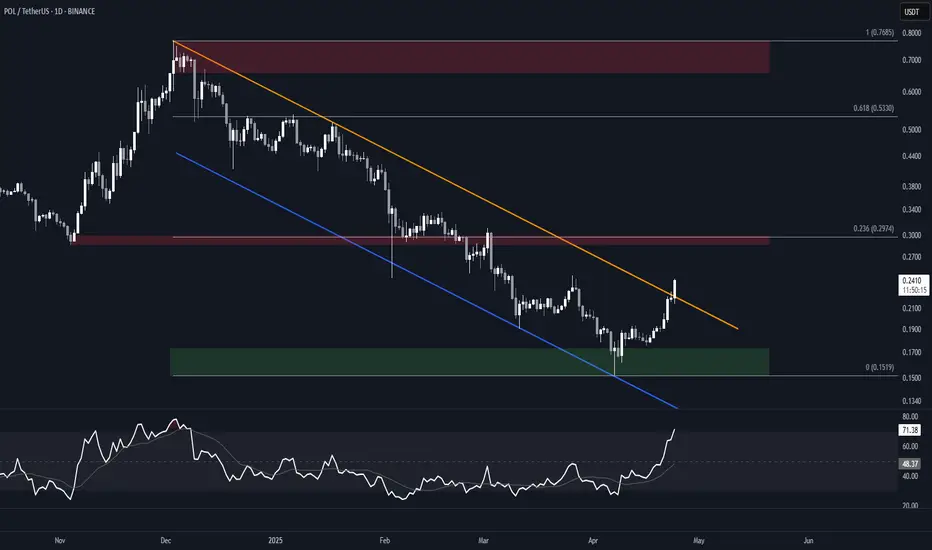
POL (MATIC) Falling Channel BreakoutBINANCE:POLUSDT is attempting a breakout from a nearly 6-months long falling channel. A daily close above the resistance would offer confirmation.
Watch for a potential retest of the resistance as support, as the overbought Daily RSI could signal an imminent pullback.
Key Levels
Aside from the support, these are all good candidates for partial TPs.
• $0.15-$0.17: Bull order block and current support
• $0.30: Previous S/R, 0.236 fib of the move down, and HVN. Will likely offer resistance.
• $0.53: Previous S/R, and 0.618 fib of the move down.
• $0.66-$0.77: Main supply zone, and December 2024 high.
Polygon: Your Altcoin ChoicePolygon has been bearish since early December 2024, same with most of the Altcoins market. This bearish period is coming to an end and I can say this based on two simple signals. A bullish divergence with the RSI and a falling wedge pattern.
The falling wedge pattern on its own can be doubtful because it can always extend. In fact, any signal in isolation can produce more harm than good. That is why I always look at a combination of signals to support my bias.
There is also a small volume breakout yesterday. This is a weak signal but when combined with the RSI bullish divergence and marketwide action, what the rest of the market is doing, it becomes a strong early signal.
➖ MATICUSD Daily RSI Bullish Divergence
Polygon's daily RSI hit bottom in early November 2024. Ever since, it has been producing higher lows. This makes it a very strong bullish divergence. MATICUSD has been moving lower and producing strong lower lows. This is the reversal signal. Polygon will soon grow.
Thanks a lot for your Altcoin Choice.
Namaste.

POL Breaks Out of Monthly Downtrend, Ending Consolidation Phase.POL has recently emerged from a significant downtrend following an extended period of consolidation. It has successfully surpassed the 0.2200 resistance level that defined this consolidation range and is now working to maintain its position above this threshold. This presents a potential opportunity to enter a long position, with price targets set between the 0.2400 and 0.2500 levels.
