Polygon

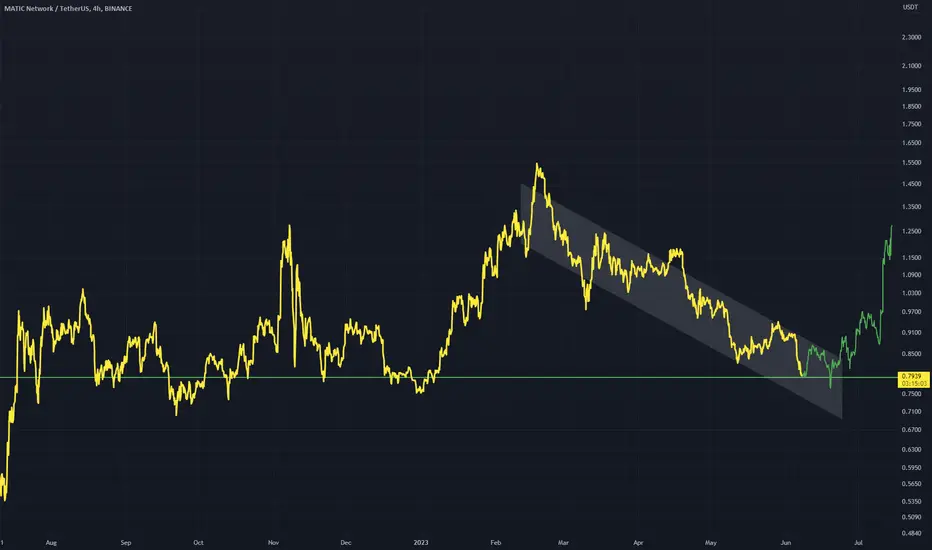
long MATICCRYPTOCAP:MATIC broke through the descending hendline. Bullish movement to resistance level at $0.71 is expected to happen.

Is MATIC Ready for 60% Downside Move As per ChartTechnical Chart Analysis of MATIC/BTC - Bear and Bull Market Insights
Market Overview:
MATIC is currently trading at 0.00002163 BTC, representing a significant decline of 65% from its all-time high. While the technical analysis suggests a bullish scenario due to the formation of a bull flag on the MATIC/BTC weekly chart, market sentiment does not support an upward move for MATIC at present.
Key Analysis Points:
Bull Flag Formation: The MATIC/BTC weekly chart indicates the formation of a bull flag pattern, which traditionally signals a potential bullish trend.
Market Sentiment: Despite the bullish chart pattern, current market sentiment does not align with an upward movement for MATIC.
Support Levels: The immediate support level for the bull flag pattern is at 0.00002100 BTC. A price drop below this level would confirm strong bearishness.
Target After Breakout: If hold Current Support then, the target for MATIC/BTC is projected to be 0.00000600 BTC, which represents a substantial decline of 60-70% from the current level.
Worst-Case Scenario: In the event that MATIC/BTC holds the current support level at 0.00002100 BTC, there could be a bounce towards 0.000036 BTC or even 0.000057 BTC before the anticipated downward movement.
Key Levels:
Support Levels: Significant support levels to monitor are at 0.000021 BTC and 0.000006 BTC.
Resistance Levels: Key resistance levels to watch are at 0.000036 BTC and 0.000060 BTC.
Disclaimer:
This analysis is not financial advice. It represents the personal opinion and analysis of the author. Individuals considering investments in any coins, including MATIC, should perform their own research and consult with financial professionals.
Follow us for More Chart Analysis.

MATICUSD is rebounding on a 2.5 year old Support!Polygon / MATICUSD almost hit the Rising Support that goes back all the way to January 2021 and is now rebounding.
This is perfectly viewed on the 1week time frame where the price hit the 1week MA200.
As the 1day RSI is also rebounding, a crossing over the MA line, will confirm the bullish trend, like it did on July 4th 2022.
Buy and target the 1day MA100 on the medium term at 1.1500.
Follow us, like the idea and leave a comment below!!

MATIC long; expecting +50% in 3 weeksMATIC produced a local double top on the 4H back in March, using fib retrace from the double top you see the golden ratio has a clear support/resistance in that 0.95-0.97 (nearing the dollar) area, and for each fib retracement line you see that S/R, each one to be tested in the coming weeks as BTC and crypto assets look primed to rally.
Outside of TA; the securities definition for MATIC, along with other accused tokens, has seemingly cooled off. Not to mention the floodgates of filings and re-filings of ETFs from big dogs have opened!

Polygon (MATIC) Bull ScenarioDo you think Altcoins will stall when Bitcoin starts running? If you think the alts will walk too, I can talk to you about MATIC.
In my opinion, I think we are in the days when we have the last opportunity to buy MATIC, which will be the star of the next bull season.
As you can see on the black lines, MATIC, which made the symmetrical triangle it made in the past, entered short-term downtrends 2 times within this symmetrical triangle (Orange line) and after the second break, the bull run started. We are on the eve of this process.
In the two symmetrical triangle patterns, we can see that MATIC is spending a lot of time inside the 0.382 and 0.618 levels of Fibonacci retracement. (Purple Boxes)
In addition, the bottoms and tops that form the symmetrical triangle in both patterns are made at the same Fibonacci levels. This is another indication that the two patterns are very similar. (Red arrow and circles)
Therefore, when we look at the Fibonacci levels again, we can see that when the bull season is entered, the targets will be $10 and $87, respectively. This means 1672% when the first target arrives; In the second target, a profit of 14000% will be obtained.
Since the risk/reward ratio in this scenario fits my trading style and strategy, I made my first purchase at this level. I will add when the orange resistance is broken and retested, and I will add my position at the retest after the triangle break (black) and wait for the $87 level.

MATIC STRONG BEARISH Falling KnifeTrend stron bearish
RSI Momentum below 50 strong bearish
Nearish Volume rising
Support will break soon
Matic will fall deeper
ADA, MATIC, SOL face the music as Robinhood delists tokens
Hours after Robinhood delisted ADA, MATIC, and SOL, the price action of the tokens was not what participants would have hoped for.
The decision to end support for the tokens caused a $387 million wipeout from the crypto market.
Several indicators revealed that ADA, SOL, and MATIC’s momentum were bearish.
The prices of Cardano , Polygon , and Solana tumbled in double-digit figures after Robinhood confirmed that it was delisting the tokens from its platform.
While the U.S. trading platform did not give cogent reasons for its decision, speculation went around that it was linked to the recent SEC “unregistered securities” tag.
Unlike recently targeted exchanges like Binance and Coinbase, Robinhood is duly regulated by the SEC. Hence, it could have been necessary to take such action.
Regulatory fear leads traders to liquidation
In its statement, Robinhood noted that no other coins were affected. But holders of the ADA, SOL, and MATIC had until 27 June to stop transacting the tokens.
As the sudden move sent shockwaves through the crypto market, the implication of the decision revealed itself.
According to CoinMarketCap, SOL’s value decreased by 22.47% in the last 24 hours. ADA could not escape the heat, registering a 23.06% decrease. As for MATIC, it was down by 26.12% within the same period.
Because of the significant decline in the prices of these tokens, liquidations in the past 24 hours surged to $387 million, with longs suffering the most.
Based on the liquidation heatmap from Coinglass above, SOL accounted for $15.15 million out of the total wipeout. MATIC’S liquidation went up to $8.54 million, while ADA was $15.87 million.
Red season for the cohort
Meanwhile, an evaluation of the ADA/USD daily chart showed that the token’s momentum had breached the oversold region, as indicated by the Relative Strength Index (RSI).
At 17.21, the RSI showed that selling pressure was tremendous. Thus, the momentum was bearish, and slight buying power might do almost nothing to save the price action from the press time state.
The daily timeframe of MATIC was not any better. This was because the Awesome Oscillator (AO) was down to -0.1139. Thus, AO crossing into the negative territory indicated a bearish signal.

🔥 MATIC Found Support At An Ancient TrendlineMATC has been one of the weaker major tokens of the last couple of weeks. During this week's sell-off, MATIC moved all the way towards an ancient support line which has been established at the start of the previous bull-market.
This, combined with the 3D RSI being severely oversold, makes me believe it's more likely than not that we're going to see some kind of bounce in the near future.
For an optimal risk-reward, I'm looking at the current ATH value as the profit target. A less risky bet would be to target 1.00 or 1.50, with a stop below the most recent local low.

Polygon Long TermThese are long term expectations in relation to Polygon prices and the most important levels that will be affected by them in the future

long MATICCRYPTOCAP:MATIC bounced off the support level and broke though the descending trendline. Bullish movement to resistance level at 0.65$ is expected to happen.


💥MATICUSDT 4H-TIMEFRAME ANALYSIS💥MATICUSDT 4H-TIMEFRAME ANALYSIS
💗Hello ladies and gentlemen
This is my new idea for 💥MATIC Polygon
I hope my idea is clear
Support me by like and share thank you
Stay Safe💯💲💲💲
Good luck💰😍

MATIC is about to finish BEAR market!Hello, my friends!
We had two options in analysis for today: MATIC and ETH. MATIC won this battle. This asset has the very interestin price formation. Therefore I can assume that bear market will be finished soon. Last dump affected BINANCE:MATICUSDT also, but price was not able to break even the lowest point of the current bear market.
Let's take a look at the price chart. Let's consider the following Elliott waves marking. Using our favorite Awesome Oscillator I defined the wave 3 bottom. It's located at $0.34. After that we saw the huge in terms of time wave 4. This reactive wave has been represented as the ABC zigzag correction. Of course it has reach a little bit higher price that it is usual for such waves. Waves 4 usually reach the zone between 0.38 and 0.5 Fibonacci retracement, applied to wave 3. In our case we saw the 0.61 level, but it's ok.
Wave 4 in my opinion is 99% finished and I am not waiting for the price above $1.5 before it will break down $0.34 low. The main reasons for that is zero line crossover on Awesome oscillator and the increasing donward momentum. Now I consider the wave 5. The final wave in this bear market. I cannot define the target for the wave 5 but price should set the new lower low. The best confirmation for the bull market start is gonna be our five magic bullets:
1.Bullish divergence with Awesome Oscillator
2.Fractal at the bottom on 4D - 1W time frames
3.Squat bar at the bottom (or even bullish reversal bar)
4.Momentum change to the upward
5.Target zone reach (below $0.34)
Be patient, market will give us the insane opportunity very soon.
Best regards, Ivan
_____________________________________________________________
🔥Please, follow me and smash the rocket🚀 button to support me🔥

Robinhood will delist Polygon MATICIf you haven`t sold MATIC here:
Then you should know that Robinhood, the well-known trading platform, will discontinue its support for three cryptocurrencies implicated in SEC lawsuits against Binance and Coinbase.
Effective from June 27, 2023, Robinhood will no longer provide support for Cardano (ADA), Polygon (MATIC), and Solana (SOL).
In My opinion MATIC will test the support of $0.50.
Looking forward to read your opinion about it.

MATICUSDT short position (50 % profit)The upsloping support has held so far.
If we get the bounce, we expect the price to create the lower high which would be an entry for short position.
If the upsloping support fails, and the price confirms it as a resistance, it may be an entry for short as well.
Entry, Take profit, Stop loss and final target are shown on the chart.
Good luck

#MATIC High Probability is 2.11 $ Before Go Below 0.30 $ #MATIC is holding support and bulls wants to take this upside for closing their Long positions. When they will take this 2-2.20 USD, then we can see Sharp Drop or Sell Off for 0.30 USD..

Polygon Falling Wedge FormationIn MATIC, a very clear falling wedge formation can be seen in the daily timeframe.
At the same time, MATIC, which is based on 0.75 support, can break the falling wedge if it is rejected from this support.
Once the wedge is broken up, the first target will be $1.19 and the main target will be $1.60.

MATICUSD - Top Cap IndicatorUsing the Top Cap indicator to plot future bull runs
I expect Matic to drop to a low along the horizontal support level that is shown in this analysis
From this low bulls can gain momentum and push price up to the top cap peak at around $10.
This would be an enormous move, but MATIC is still very young and has a lot of promise.

DUMP IT Mr Matichello guys
so as you see I expect matic to be dumped to 0.5 fib level log
bag holders who didnt take the 150x profit they will regret it for the next 5 years
Thanks

Matic | Polygon Looks Bearish HereTargets from the initial move down line up with targets from the next move down and support levels.

MATICUSD - Strong Horizontal ReachedMATIC has reached a strong horizontal support.
I expect a price reversal at this level due to the large support that is here.
Bars pattern shows this reversal out of the down channel.
Polygon MATIC and the US Debt CeilingNegotiators from Democratic and Republican parties finalized an agreement on Sunday night.
Instead of raising the limit to a specific level, they have opted to suspend it entirely until 2025. This strategic move ensures that their bills can be paid until that date, while also guaranteeing that the next battle to raise the ceiling will not coincide with the upcoming presidential election.
The resolution of the debt ceiling issue brings optimism and stability to the financial landscape, which has a positive ripple effect on the cryptocurrency market.
Bitcoin and the broader crypto market stand to benefit from increased investor confidence, reinforced safe-haven status, enhanced institutional adoption, regulatory clarity, and the overall positive impact on global markets.
MATIC/USDT short
Entry Range: $0.85 - 9.91
Take Profit 1: $0.97
Take Profit 2: $1.10
Take Profit 3: $1.24
Stop Loss: $0.78

Will MATIC falter at this level?MATIC’s price action rebounded from the mid-range.
The range low is a confluence of a bullish OB in H12 formed on 16 May and another bullish OB formed in H2 on 14 May.
A price rejection at the short-term range high could drag MATIC lower.
Entry: $0.89
Target: $0.84
Stop-Loss: $0.91
RR - 2.8
