🔥 MATIC Battle For The Uptrend: Danger ZoneMATIC is rapidly approaching the main support line which has been directing the trend for almost 9 months at this point.
Bulls are most definitely coming out in force once we reach this support. Naturally, Bitcoin needs to help here. If BTC sees bearish price action, MATIC will simply fall through the support and confirm the bearish mid-term bias. In case the support doesn't hold, I'm looking at 0.75 as the bearish target. In case we see a bullish reversal, 1.00 is the target.
Polygon

✴️ Looking Into Polygon's Correction To A New Higher HighPolygon's correction, MATICUSDT, has been going now for more than three months.
The total drop amounts to 48% from Febs peak price to May's low.
The current price is trading below the 0.786 Fib. retracement level support...
A very strong correction by all standards but MATICUSDT continues trading within a higher low (compared to its late Dec. 2022 low).
Hidden bullish divergence on the RSI.
Very low bear volume on the last low with the session,12-May, closing green.
Looking at Litecoin and Lido, for comparison, we can start to speculate that the correction low is more likely than not to be in.
The low volume is quite telling.
The entire correction phase, 90 days, produced very little volume compared to the bullish wave, 49 days...
These are bullish signals.
A higher low can lead to a higher high... Patience is key, but what comes next will be twice what we saw in late January... It is about to get good.
Namaste.

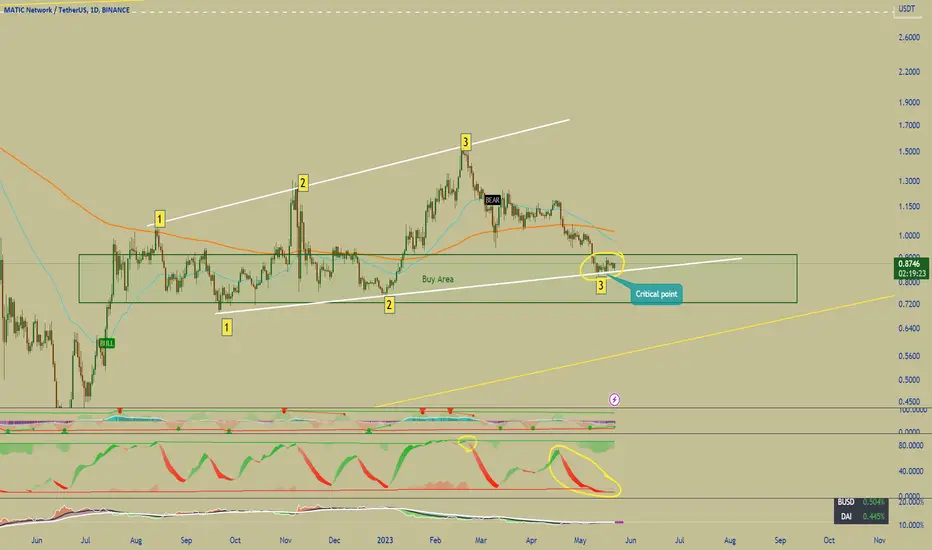
MATIC Critical support directionHey guys, here what a new update in MATIC.
Using the Daily chart;
>Price ended up falling all the way to the local support at 0.85. Support has been holding well so far so a critical movement is about to occur either UP or DOWN.
>IF price breaks below the white support line ,we will be likely heading close to or into the next support located at 0.61.
>IF price breaks above long term target is $1.7 and $2.8 bullish scenario.
>this is a CRITICAL support area and 0.85 is a very important support so i am expecting a big movement either up or down.
>Both support and resistance of the wedge seem to hold and be important as they have served their purpose 3 times each.
For the trader who wants to trade this chart, draw the wedge and place alarms below the support in case we break to the downside.
MATIC LONG OPPORTUNITYMatic has been 38 Days exactly in sideways action. I believe a big movement is going to occur on MATIC either UP or DOWN. It looks like a good trade with a goodrisk : reward so its definitely worth taking the shot. BNB was broken out of the symmetrical triangle so I will assume MATIC is going to follow the same steps as they both go together and Binance owns MATIC. I may still be wrong but its worth the risk taking.

matici got matic about bottomed and finished with the HTF B wave. Now loading C wave back to $5 plus
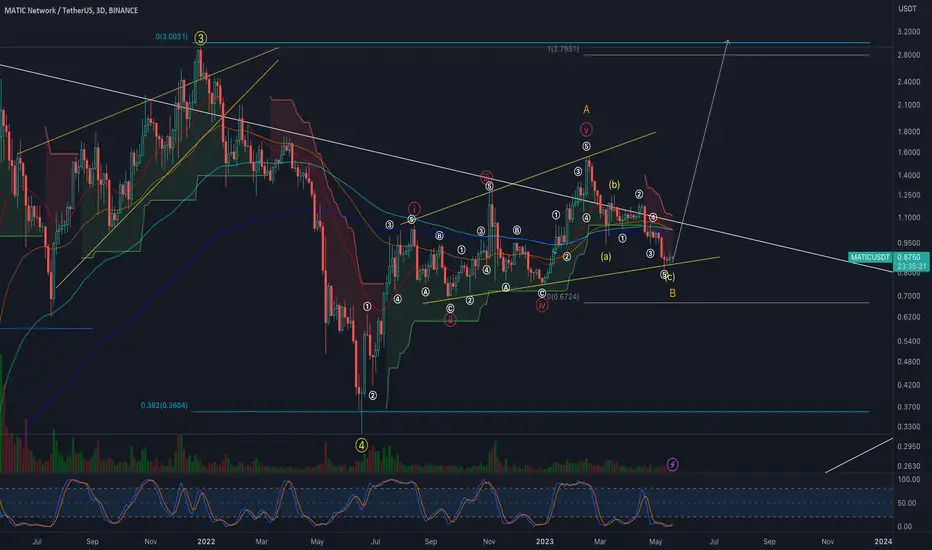
Polygon: Exemplary 🤓Quite commendably, Polygon has advanced into our magenta-colored target zone between $0.78 and $1.02 and has touched at the lower edge of the pink trend channel to finish wave (iv) in blue. Now, we expect the altcoin to gain strong upwards momentum to haul itself up, leaving the magenta-colored zone on the northern side and developing wave (v) in blue, which should end in the top of wave (i) in magenta. Wave (ii) in magenta should then make for a distinct counter movement before wave (iii) in magenta should take Polygon further upwards.

MATIC - Outlook 17 05 2023MATIC Overview
There is a potential short entry into wave II cycle, in the current minor wave, it is potentially heading towards the 38.2% area, which is the wave 4 retracement area before continuing the decline to wave 5. then matic will rebound strongly

🔥MATIC's Next Big Move: Navigating the $0.77-0.84 Value Area🔥Hi, friends! Matic is going to test the $0.77-0.84 value area. It's a huge value area that possibly can be a great support for the price.
📊 TRADING PLAN FOR MATIC:
1. false breakout of the previous low
2. volume growth
3. squeeze to the trendline
4. bullish BTC is a must-have for altcoins to grow
✅ THE MAIN TARGETS FOR MATIC:
🔥 $1.04 - the local high and even number
🔥 $1.25 - the local high and ket level
💻Friends, press the "boost"🚀 button, write comments and share with your friends - it will be the best THANK YOU.
P.S. Personally, I open an entry if the price shows it according to my strategy.
Always do your analysis before making a trade.

Polygon Analyze (Road Map, 03/14/2023)!!!🗺️Today let's take a look at Polygon project 🗺️roadmap🗺️ in daily time frame.
First, let's take a look at the fundamental.
Fundamental :
Polygon is a layer-2 scaling solution for Ethereum which aims to address the scalability issues on the Ethereum network by providing faster and cheaper transactions. Polygon utilizes a network of sidechains to enable fast and secure transactions, allowing users to transfer assets between Ethereum and other networks.
Polygon has a strong development team that is dedicated to improving the network and expanding its capabilities. This is evidenced by the frequent updates and upgrades to the network that are aimed at improving its scalability, security, and functionality.
It also has strong partnerships with notable players in the blockchain industry, such as Aave, Curve, and Chainlink, which increases its credibility and reputation.
Overall, the combination of strong partnerships, a dedicated development team, and impressive growth make Polygon a promising project in the blockchain industry.
----------------------------------------------------------------------------------------------------------------------------------------------------------------------------------------------------
Technical :
It seems that Polygon has started to form a zigzag correction(ABC/5-3-5) after completing its 5 impulse waves in the 🔴resistance zone($1.488-$1.249)🔴, so that wave A has ended on the important uptrend line.
💢Currently, the Polygon is moving in the Time Reversal Zone (TRZ) and near the resistance zone.
💢Polygon can also form the fan principle at top pattern.
💢In addition, the sell signal is created by the 50-SMA and 50_EMA.
💢The RSI indicator is also rejected from the 50% line and above the descending channel.👇
🔜I expect the Polygon to decrease to the 🟢support zone($0.77-$0.69)🟢after the important uptrend line breaks.
Polygon Analyze ( MATICUSDT ) Daily Time frame⏰.
Do not forget to put Stop loss for your positions (For every position that you want to open).
Please follow your strategy, this is just my Idea, and I will be glad to see your ideas in this post.
Please do not forget the ✅' like '✅ button 🙏😊 & Share it with your friends; thanks, and Trade safe.

Polygon | MATIC | Looking bleak for Bulls next target $0.7567Polygon | MATIC | Looking bleak for Bulls next target $0.7567
MATIC has lost a very key support and doesn't look promising for bulls to be honest - a potential divergence is forming also if this recent rejection continues
| Death Cross
| Nice rejection wick
| Broken the 200 EMA and rejected
| If this is a peak then it will be a hidden divergence....big IF
| Lost Key Support
| Potential point to take profit in case of bounce
| Broken key CVD trendline

Polygon: a bright future or forgotten technology? Polygon is the first Layer 2 blockchain. The initial placement of the project took place on April 24 2019, on the Binance Launchpad platform and two years later, on December 27, 2021, an ATN of 2.92 USDT was reached.
Project development dynamics
For several years, the project was for the most part, if not in oblivion, then in the shadow of other similar and all sorts of "killers of Ethereum". The project reached a wave of success in 2021, having caught the eye of large public investors and built partnerships with popular brands. In May and June 2021, Polygon received support from billionaire investor Mark Cuban, who revealed plans to integrate his NFT Lazy.com platform with Polygon. To date, Polygon has various partnerships with:
Adobe Behance
DraftKings
Alan Howard's hedge fund, to develop Web3 projects
Stripe launched global cryptocurrency payments through Polygon.
Fashion brands: Adidas Originals, Nike, and Prada have launched NFT collections on Polygon.
Instagram is also partnering with the project at NFT.
Polygon is partnering with Niger to develop a blockchain ecosystem for the country's future.
Aave, Curve.Fi, Decentraland, Sandbox, OpenSea and Uniswap have chosen Polygon as their scaling solution.
Polygon has partnered with Salesforce, which delivers customer relationship management (CRM) software.
Citigroup published a report in April 2022 describing Polygon as AWS
Web3. It is claimed that the Metaverse economy, by 2030, will reach $13 trillion, with much of it developed on the Polygon network. Citigroup also believes Polygon will become widespread because of its low transaction fees and developer-friendly ecosystem.
A report from blockchain analytics company Messari, showed that in the third quarter of 2022, the number of active MATIC addresses increased by 180% in the second quarter, and the total number of transactions for the quarter was 2 billion.
In 2023, despite the market correction, the project has made significant strides, both in development and partnerships. In the last couple of weeks, partnerships have been reached with Google Cloud and Franklin Templeton to tokenize large-scale financial products for its DeFi, etc.
Sotheby's, which accounts for 24% of the world's art auction sales, announced that its trading floor has launched on Ethereum and Polygon.
Polygon's GitHub has recorded a significant increase in the number of code commits and the number of kernel developers since early May.
Recent technical news for the project has been the launch of Polygon zkEVM, a zero-disclosure scaling solution equivalent to the Ethereum virtual machine. This means that most existing smart contracts, developer tools, and wallets will be able to work seamlessly. Polygon zkEVM leverages ZK proofs to reduce transaction costs and increase throughput while keeping Ethereum secure.
Polygon launched three updates on May 3 to make it easier for developers to integrate decentralized identity into dApps: new features in Polygon ID infrastructure tools that include improved integration, UX, and a host of new tools to help developers who build dApps.
A new issuer node interface that will make it easier to set up, manage and work with the issuer node. In addition, push notification support is provided in the mobile SDK and in the app reference implementation.
Developer tools and updates such as JWZ Validator, Polygon ID smart contract deployment on the core network and the recently announced PolygonID DID resolver.
Outlook for Matic
Today, the L2 solutions niche is actively filling and expanding, with projects and their ecosystems competing with each other for developers and users to form a better L2 ecosystem.
Matic's direct competitors, Optimism and Arbitrum, launched in mid-2022 and March 2023. These projects, as well as Matic, aim to make transactions cheaper and increase throughput. After the release of these projects, Matic actively began to lose the volume of transactions within the blockchain and the number of unique active addresses.
Zero Knowledge-based projects zkSync and StarkNet are currently being prepared for release and will also be in the L2 solution race.
Matic lost its unique advantage of being the only project with the best user experience and now the project team is looking to create partnerships with established web2 businesses and prepare projects for mass adoption. Only with these products, Matic will be able to regain its dominance amongst the other L2 solutions.
At the moment, the price of Matic is approaching the key support zone of 0.78-0.68. Potential zones for growth are shown on the chart in terms of historical analysis.

Polygon MATIC price beckons to buy, but where?)Exactly 3 months have passed since the publication of the idea with our global vision of possible movements of the MATICUSDT price.
The first part of the idea has clearly worked out the $1.50 target, and the second part of the idea with a correction to $0.5 now looks unlikely.
It is more realistic to assume that the "buyer" who did not allow the MATICUSD price to fall below $0.70-0.80 during the second half of 2022 will not allow this to happen in the near future.
Therefore, we consider the $0.70-0.80 zone to be ideal for buying MATIC into the medium- and long-term portfolios with the first take profit not earlier than $2.50
_____________________
Did you like our analysis? Leave a comment, like, and follow to get more

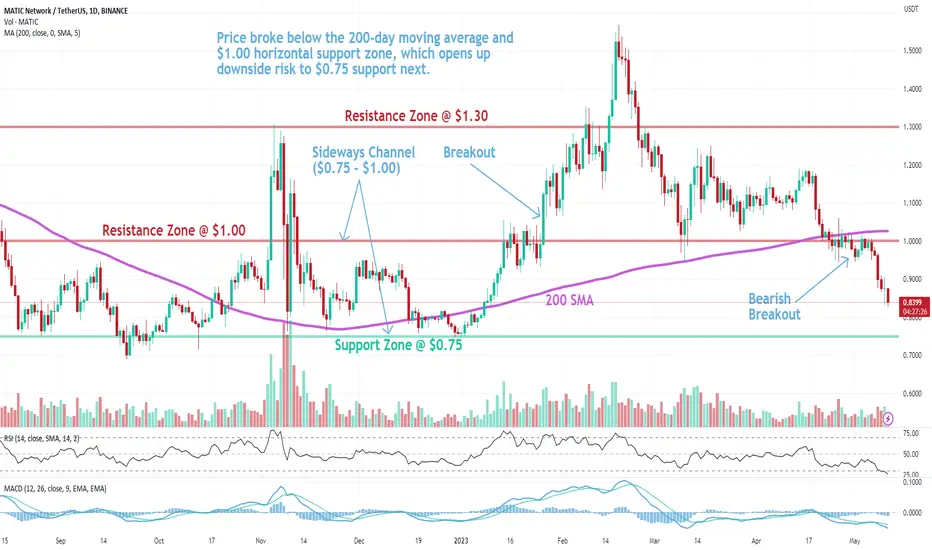
MATIC: Support BreakoutPolygon (MATIC) technical analysis:
Trade setup : Price broke below the 200-day moving average and $1.00 horizontal support zone, which opens up downside risk to $0.75 support next.
Trend : Downtrend across all time horizons (Short- Medium- and Long-Term).
Momentum is Bearish (MACD Line is below MACD Signal Line, and RSI is below 45).
Support and Resistance : Nearest Support Zone is $0.75. The nearest Resistance Zone is $1.00 (previous support), then $1.30.
Polygon (MATIC) formed bullish Gartley for upto 91% rallyHi dear friends hope you are well and welcome to the new trade setup of Polygon (MATIC) with US Dollar pair.
Previously I shared a long-term trade setup for MATIC which produced more than 246% rally as below:
Now on a weekly time frame, MATIC has formed a bullish Gartley pattern for the next price reversal.
Note: Above idea is for educational purpose only. It is advised to diversify and strictly follow the stop loss, and don't get stuck with trade

IMX is the most underrated L2A LITTLE BIT ABOUT IMX
IMX is Ethereum's layer 2 blockchain targeting GameFi. It is a protocol for creating IMX NFTs on the Ethereum blockchain, which allows transactions to be executed quickly and without additional fees. Immutable X uses an optimized Proof of Stake (PoS) algorithm to provide high transaction speed and low cost, while keeping Ethereum secure and decentralized. With zk-rollup technology, Immutable X speeds up transaction validation, providing scalability and reducing commission costs. Immutable X also allows you to create free transactions, making it ideal for games and other applications where multiple transactions are a necessity.
HOW IT WORKS AND DISTRIBUTES PROFITS
IMX's main revenue, like any L2, consists of commissions for generating transaction batches at the second level, as well as capturing the results of these transactions at the Ethereum level. IMX also takes 2% of all secondary sales on marketplaces that use IMX's order book.
IMX has implemented a steaking mechanism, which would more accurately be called pseudo-staking. 20% of the net income of IMX is converted into the native $IMX through the open markets and distributed between all the stakers. Because of that, the IMX project itself maintains demand for its token, in addition to sharing its profits with active users who support the project. In some ways, you could say that IMX is a kind of real yield product, which trend is growing more and more
ABOUT THE PROSPECTS
IMX is in a narrow GameFi niche, providing unique opportunities for developers and users. Right now, blockchain-based GameFi sector itself is one of the most promising along with zk, RWA and NFTfi. On top of that, IMX has a transparent mechanism to directly influence the price of its native token to holders support.
Special mention should be made of the partnership between IMX and Polygon, so developers will be able to implement their products using all existing technologies, relying on Polygon's security. And users will get a better experience with their products.
As the entire GameFi sector evolves and the market as a whole continues to grow positively, IMX will take the lead in infrastructure for GameFi, with solutions that are time-tested and proven. Thanks for reading! Share your thoughts about IMX in a comment section

MATIC Analysis, A Precarious PositionLet's take a closer look at MATIC and see what its current status is in the market. MATIC, with its current price of 0.9830, is definitely worth some attention. Looking at the RSI of 39, we can see that it's not quite in oversold territory yet, but it's certainly on its way there. The daily timeframe 0 Fibonacci of 0.9435 and daily timeframe 1 Fibonacci of 1.2500 give us a good idea of the potential range of prices MATIC could be trading within.
Meanwhile, the daily timeframe upper Bollinger band of 1.1958 and the lower Bollinger band of 0.8943 suggest a level of volatility for the coin, with the middle Bollinger band at 1.0450 indicating the average level of volatility. The volume oscillator of -19% also suggests that MATIC is not seeing a lot of trading activity at the moment.
On the other hand, the MACD of -0.0377 indicates that there is some bearish momentum in the market, which could cause the price of MATIC to drop further. However, we should also take into account the hourly EMA 50 of 1.0752, which suggests that there could be some support for the price at this level.
Overall, it seems that MATIC is in a bit of a precarious position at the moment, with some indicators pointing towards a potential price drop, while others suggest that there could be some support for the price. It will be interesting to see how these indicators evolve over time and whether MATIC will be able to regain its footing in the market.

short MATICCRYPTOCAP:MATIC bounced off the resistance level and the descending trendline. Decline to support level at $0.94 is likely to happen.

MATIC Polygon Price Targets after the FOMC meeting this weekThe upcoming FED meeting on May 3rd could cause a further decline in the crypto market due to the potential rate hike and ongoing unease around banking system developments.
The outlook for the crypto market after the upcoming FED meeting on May 3rd is bleak.
Fears of a deep credit crunch caused by Silicon Valley Bank's collapse have not yet materialized, and the financial situation is much steadier.
Additionally, inflation remains elevated, and with evidence of stubbornness in underlying inflation, it could be in the 4% to 5% range, far above the 2% inflation target. The markets are pricing in a 25bp Fed Funds rate hike to 5.25% at the May FOMC meeting, and given the steadiness in financial markets, persistence in price pressures, and continued decent activity, this could contribute to a further downturn in the crypto market.
MATIC/USDT short
Entry Range: $0.95 - 1.10
Take Profit 1: $0.90
Take Profit 2: $0.79
Take Profit 3: $0.63
Stop Loss: $1.26

$POLY primed to flyPolygon has been trading in this channel since June of last year. It's near the bottom of the trend line, which happens to coincide with the 200MA on the daily chart. With all the bullish sentiment around Polygon, and large projects moving their ecosystems onto the chain, I'd expect to see a nice bounce towards the middle of the trading channel; followed by an opportunity to exit with a ~40% gain from current prices in the highlighted box.
Out at or above $1.50 sometime in April, ez gg - NFA.

MATIC (Y23.P2.Video). Macro outlookHi Traders,
#Matic #polygon #crypto
as per my thoughts on ALTS, we have much to go for ALT season and using Matic as a sample, I try to demonstrate why.
All the best,
S.SAri

Quick is about to give a BUY#quick exchange is one of #polygon network' s most powerful DEXes. Technically looking tasty 👀 Not financial advice. #Matic #quickusdt

Quick Update on MATIC: Here's a quick look at MATIC 2-day chart.
Upon analysis, it appears that the current price of MATIC is undergoing a retest of the lower trendline. Should the price break below this level, a more substantial downward movement is expected to occur. Consequently, it is recommended to closely monitor this rising channel, particularly in the event of a downside breach.
Furthermore, the ongoing downward trajectory of Bitcoin suggests a high likelihood of a corresponding decrease in the value of MATIC. In the event that Bitcoin retraces to the $20k range, it is anticipated that MATIC's price level will decline to at least $0.5. However, it should be noted that the price of Bitcoin is expected to continue decreasing from its current level, which further suggests the possibility of a downside break in the rising channel for MATIC as well.
-------------------------------------------
About our trades:
Our success rate is notably high, with 10 out of 11 posted trade setups achieving at least their first target upon a breakout price breach (The most on TW!) . Our TradingView page serves as a testament to this claim, and we invite you to verify it!
-------------------------------------------
Recent Altcoin trades:
ARB / USDT: 30% profit!
ROSE / USDT: 5% profit!
-------------------------------------------
If you like the content, then make sure to comment and like the post :D
Follow me for daily profitable trading setups.
BTC dictates the market. If BTC falls, then Alts will drop as well. Trade safe!

Matic 🛤️ Break + Retest 1.0069?Looks Like we can continue the Bearish momentum here back down to yesterday's low at .9792 and beyond to our next daily level at .9755.
Matic Polygon did a faekout yesterday above 1.0227. It returned back into the range, then to the bottom of the range then did a break and retest of the daily level on the 30m TF. Left a very large wick rejection and off we go onto the next zone at .9755. We have bounced but I can observe a retest of the low with momntum left over from earlier.
