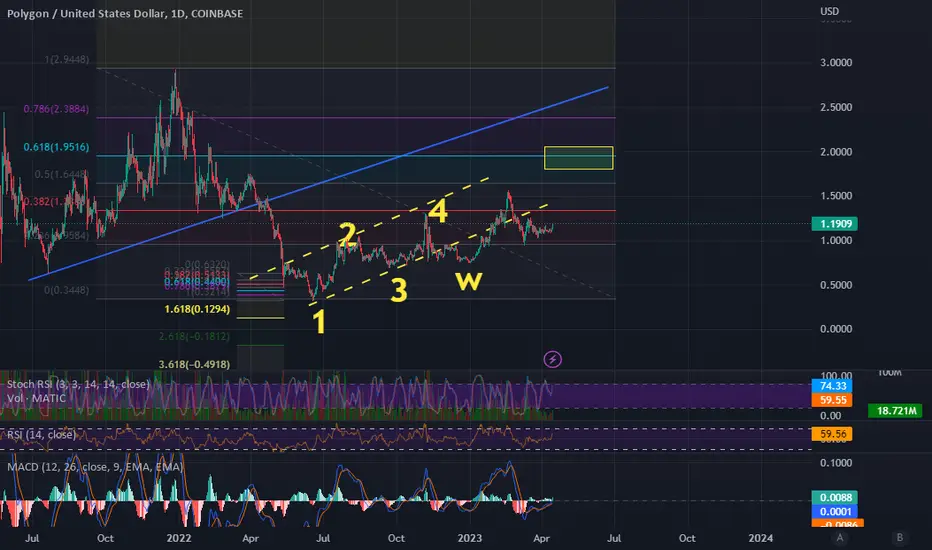
[polygon] by elo.The odyssey of Matic (Polygon) commenced at a mere 0.0025, back in 2019.
It ascended in what appears to be an impeccable 5-wave sequence, reaching an impressive 2.9255 at the peak.
Remarkably, it is one of the few tokens in this pervasive bear market that has not experienced any significant deterioration.
Such a characteristic could be construed as exceedingly bullish—
or,
merely an elongated phase of distribution preceding the eventual re-accumulation phase.
---
I admonish any prospective investor in this coin,
as it may undergo a substantial depreciation once Wave B has concluded later this year.
---
A conservative estimate for Wave C's termination resides within the 0.08-0.1 vicinity—
however,
it is more plausible that it descends into the 0.03-0.05 region,
signaling the ultimate capitulation phase of the bear market.
👇
Subsequent to this event,
I envision Matic soaring to a minimum of $15.
---
Wave B target = 2.22
Wave C target = 0.03
✌
Polygon

🔥MATIC TRADING PLAN: EXPECT 30-45% PUMP WITH BULLISH BTC AS KEY🔥Hi, friends! I don't think that MATIC will update the local high at $ 1.57, but it has the power to make a local pump by 30-45%.
This is in line with my vision global vision on BTC that there will be one more pump before this local bull market will end.
📊 TRADING PLAN FOR MATIC:
1. false breakout of the trendline
2. the volume growth which in 70-80% confirms that the bottom is reached
3. bullish BTC is a must-have for altcoin growth
✅ THE MAIN TARGETS FOR MATIC:
🔥$ 1.25 - the ley level and local high
🔥$ 1.50 - the key level and even number which is usually the strong resistance/support
💻Friends, press the "boost"🚀 button, write comments, and share with your friends - it will be the best THANK YOU.
P.S. Personally, I open an entry if the price shows it according to my strategy.
Always do your analysis before making a trade.

Trade Alert - Long MaticTraders,
You guys know I have been dreaming of a touch on our MATIC May 2021 ascending trendline for months now. Today we got that. And though I missed the .98 cents touch for a buy in, I did get in at a dollar. My target will be at least that $1.53 cents level. Stop out is hard. But I wouldn't want to see anything much lower than that .87 cent level I have marked.
Best to you all,
Stew

Polygon 🛠️ Holding 1.0159 ? Will We continue our uptrend on HTF's? IDK we will have to see if price ( 1.0159 ) Daily level
will hold or we may fall into the depths below, the abyss. I can our next short targets being ( .9760 ) 4hr Level
and ( .9382 ) Weekly level. I can see a short term range being created here to build up more liquidity to go to the upside. The prices for the range may be between 4hr zones ( 1.0069 and 1.0539 ) before seeing more upside as bulls gather liquidity.

MATIC: Approaching SupportPolygon (MATIC) technical analysis:
Trade setup : Price was rejected at $1.60 resistance and pulled back near $1.00 support (also 200-day MA), which could be an attractive swing entry opportunity. However, trends are mixed, hence, buying it here would be counter-trend and therefore risky.
Trend : Uptrend on Medium-Term basis and Neutral on Short- and Long-Term basis.
Momentum is Bearish (MACD Line is below MACD Signal Line, and RSI is below 45).
Support and Resistance : Nearest Support Zone is $1.00, then $0.75. The nearest Resistance Zone is $1.30, then $1.55.

Polygon MATIC Price Targets after the Ethereum Shanghai upgradeEthereum’s Shanghai upgrade is scheduled to launch on April 12.
The upgrade will make more than 18 million ether, worth approximately $34Billion, withdrawable, possibly causing a sudden crypto market supply dump.
This is my scenario for Polygon:
MATIC/USDT short
Entry Range: $1.05 - 1.20
Take Profit 1: $0.95
Take Profit 2: $0.79
Take Profit 3: $0.63
Stop Loss: $1.41

Matic Accumulation before the push Hello everyone,
I've observed that Matic has been accumulating above a robust Fibonacci level of 0.786 over the past day. This indicates that there may be a good entry point with a tight stop loss just below the recent lows. In this case, the risk-reward ratio looks particularly favorable since if the 1.25 level is broken, the next substantial resistance level is at 1.55.
I wish you all the best of luck and remind you to trade safely.

MATIC/USDT Technical Analysis For Long SetupMATIC/USDT Technical Analysis for Long Scalp: Targeting $1.30
Polygon (MATIC) has been a popular cryptocurrency lately, with its price showing a bullish trend. In this technical analysis, we will examine MATIC/USDT's current price, identify potential entry points for a long setup, and provide price targets for traders to aim for.
Technical Analysis:
At the time of writing, MATIC is trading at $1.1682. If BTC becomes volatile, we could see an excellent entry point around $1.14-$1.16 for a long setup. The first target for this trade would be $1.20, followed by $1.24 and $1.30. If any 4H candle closes below $1.114, traders should exit the trade to prevent further losses.
Takeaways:
MATIC/USDT is currently trading at $1.1682
The potential entry point for a long setup is around $1.14-$1.16 if BTC becomes volatile
The price targets for this trade are $1.20, $1.24, and $1.30
The stop loss for this trade is $1.114
Conclusion:
This technical analysis suggests that MATIC/USDT is currently bullish, and traders could benefit from a long setup with an entry point of $1.14-$1.16. By following the suggested targets and stop loss, traders can manage their risk and potentially earn profits. However, it is important to remember that this is not financial advice, and traders must do their own research before investing in any cryptocurrency. Happy trading!

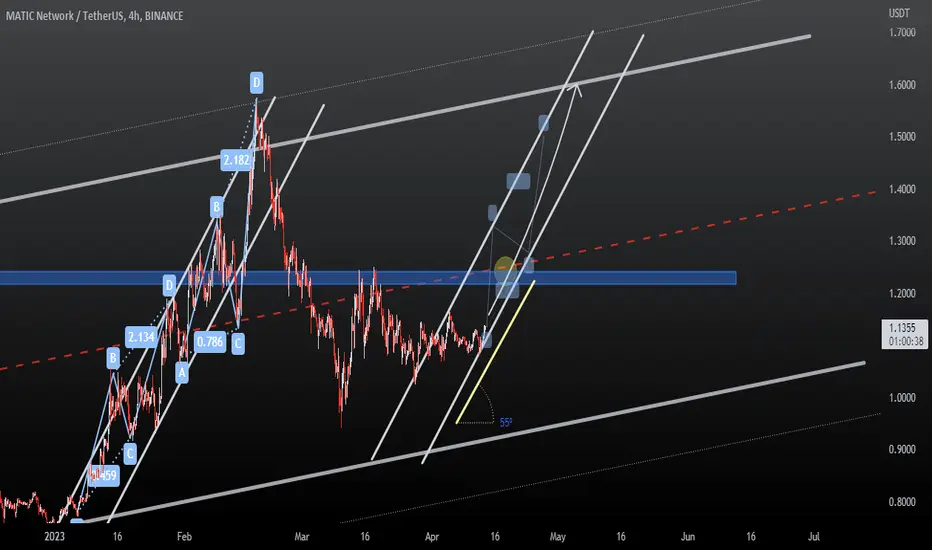
MATICUSDT Idea | a Bullish TrendA mental plan, and analysis based on a Macro ascending channel and upwards mini channels with slopes of 55 degrees.
The duration of this upward movement is 7 days at most and it is a long-term trade with 40% profit..
BINANCE:MATICUSDT MATIC NETWORK vs USDT and USD
⚠️🚨 Risk warning, disclaimer: the above is a personal market judgment and analysis based on published information and historical chart data on The trading view,
And only some of these analyzes are my actual real trades.
I hope Traders consider I am Not responsible for your trades and investment decision.
✅ Please write any advice or suggestions.
maticusdt h4Hi Guys hope you well.
One of the best fundamental project.
SecondChanceCrypto
⏰13/April/23
⛔️(DYOR)

MATIC (Polygon) last resistance before 2$!#MATIC / USD Update:
CRYPTOCAP:MATIC is currently trading at $1.089
According to Coinlion Trend Trader Indicator, MATIC is currently bearish. Short alert at $1.17 (3th of March)
Reminder last bull run from $0.85 (01/11/2023) till the $1.26 (02/25) with plenty of Profit alerts (60-80%)
Now we are shorted MATIC
There is a buying pressure between $1.02 and $1.04
We might touch the bottom of the ascending channel around 1$ and take some profit (which is also the 200SMA) before pulling back (we hope) to 2$.
But we need to follow the rules and the Coinlion Trend Trader Indicator
What do you think ?
Please click LIKE button and Appreciate my work.
Coinlion Trend Trader indicator tells me
- When to enter short or long
- When to exit and take profit :-)
If you want it or my SL indicator or My Liquidity Support and Resistance Indicator, let me know or check our website.
Thank you.

MATICUSD one last pull-back before the $1.80 targetPolygon (MATICUSD) has been trading and closing below its 1D MA50 (blue trend-line) since March 02. It is within a Channel Up, repeating an easily recognizable pattern every time it drops and prices the Channel's Low for the ultimate buy. Currently, there is one last pull-back leg left on or slightly below the 1D MA200 (orange trend-line) in order for the 1D RSI to turn oversold around 30.00, before the new Low is priced. We will buy this pull-back and target $1.80 on the long-term.
-------------------------------------------------------------------------------
** Please LIKE 👍, FOLLOW ✅, SHARE 🙌 and COMMENT ✍ if you enjoy this idea! Also share your ideas and charts in the comments section below! **
-------------------------------------------------------------------------------
💸💸💸💸💸💸
👇 👇 👇 👇 👇 👇

Polygon (MATIC) ATH !Polygon price today is $1 with a 24 hour trading volume of 2.6 Billion dollar. MATIC price is up 17% in the worst days of crypto market
bear market is the best time to build and Matic team used this opportunity splendidly, they partnered with Nubank, Meta, Reddit and other good banks and companies
now on btc pair we back to ATH again and usd pair hold its up trend . if you managed to buy it at 0.00002 its time to take some profit and have some fun and If you waiting for scalp then we still need to break 0.000066. right now Matic do a healthy correction and if BTC recover we ready for new ATH
what do think about Matic chart?

MATIC - Trend-Following Setup 🏹Hello TradingView Family / Fellow Traders. This is Richard, also known as theSignalyst.
MATIC has been overall bullish trading inside the rising broadening wedge in blue and is now retesting the lower bound.
Moreover, the zone 0.95 - 1.0 is a strong weekly support zone .
🏹 So the highlighted purple circle is a strong area to look for buy setups as it is the intersection of the blue support zone and lower red trendline. (acting as a non-horizontal support)
As per my trading style:
As MATIC approaches the lower purple circle zone, I will be looking for bullish reversal setups (like a double bottom pattern, trendline break , and so on...)
📚 Always follow your trading plan regarding entry, risk management, and trade management.
Good luck!
All Strategies Are Good; If Managed Properly!
~Rich

Trade Alert - Long MaticTraders,
I'm OoO and operating completely from my mobile phone rn. But couldn't help but spot this beautiful bull Flag on matic which has exited to the top side of a descending tl and after touching our 100 day ma. I'm hoping to hold this trade to the 50 day (currently $1.19) and to a level above that at $1.32
Stew

MATIC on the MoveMATIC is currently trading at $1.1091, with a slight drop of -0.78% in the last 24 hours. On the 4-hour timeframe, the asset is hovering above the $1.1003 support level, but below the $1.1280 resistance level. The asset is experiencing moderate volatility, as it trades within the upper and lower Bollinger bands, with $1.1032 being the middle ground.
The volume oscillator suggests that traders may not be as interested in MATIC at the moment. The MACD is showing little to no momentum, while the Stochastic oscillator is indicating that the asset may be overbought.
The 4-Hour EMA 50 is at $1.1031, which further suggests that this level could act as a support level for the asset.
In summary, MATIC is currently facing resistance to moving up but has support to remain stable. The asset is experiencing moderate volatility, and the current trading volume indicates less interest from traders. The MACD suggests little momentum, while the Stochastic oscillator suggests potentially overbought conditions. The 4-Hour EMA 50 further supports the idea that $1.1031 could act as a support level.

Polygon aka Matic nice uptrend hey everyone,
Polygon is in nice constructive uptrend direction... it may or may not pull back to strong support trendline because its currently consolidating at the point where it is... Previous high was 1.55 approx... next high is 1.72... this year the polygon may break its previous high of $3 if crypto market remain bullish till end of this year... the lowest it can go is 0.98-1.00 since price is above 200ma.. the price may retest the 200ma if market crashes
good luck ...

MATIC Pattern in Weekly TimeframeMatic seems to be remaking the pattern it did before 2021 on the weekly timeframe. The final fix will be the last buying opportunity for me. It is clear that the correction will come up to the 40-week moving average.

MATIC: Plan for Swing Trading at Ranging MarketHello Guys!
Today I would like to present to you my trade idea for POLYGON/MATIC.
As you can see, in 4H time frame here, MATIC has broken the trendline with a solid candle and is now testing the 50 EMA.
If you look at 1 day time frame, MATIC is currently at the range between 1-1.2 USD (approximately).
The 4H breakout confluences with the rejection from support/range low of 1 USD.
Now, as long as MATIC does not break the 1 USD support, or if there is a correction from here, the correction does not exceed the box I draw, we can expect MATIC to go to 1.2-1.25 USD range, which gives us a good trade opportunity.
Once MATIC reach the resistance/range high, we can see if there is any bearish signal there, to set up a short trade there back to 1 USD.
Good luck with the trading and remember that this is not a financial advice!
Trade at your own risk!
Hope you find my idea helpful

MATIC (Polygon) after 80% profit we enter short !#MATIC / USD Update:
$MATIC is currently trading at $1.059
According to Coinlion Trend Trader Indicator, MATIC is currently bearish. Short alert at $1.12 (4th of March)
Reminder last bull run from $0.85 (01/11/2023) till the $1.26 (02/25) with plenty of Profit alerts (60-80%)
Now we are shorted MATIC
There is a buying pressure between $0.94 and $1.01
And we are on a support (200EMA) at $1.04
We can reach the bottom of the ascending channel at $0.95 and take some profit
What do you think ?
Please click LIKE button and Appreciate my work.
Coinlion Trend Trader indicator tells me when to enter short or long, when to exit and when to take profit :-)
Thank you.

MATIC (Polygon) Faces Resistance as Bears Take ControlMATIC (Polygon) is a cryptocurrency that has seen a -3.44% decrease in price over the past 24 hours. As of the time of this analysis, the current price of MATIC is $1.0945.
Looking at the daily timeframe, we can see that the price of MATIC is currently below the 0.5 Fibonacci level, which indicates a potential trend reversal. The 0 Fibonacci level sits at 1.2500, while the 1 Fibonacci level is at 0.9426, and the 1.618 Fibonacci level is at 0.7527. This suggests that if the current downward trend continues, the price could potentially fall to these levels of support.
The upper Bollinger band on the daily timeframe is at 1.2301, while the lower Bollinger band is at 1.0209, and the middle Bollinger band is at 1.1255. These bands can help us identify potential overbought or oversold levels in the market. Currently, the price is below the middle Bollinger band, indicating that the market is potentially oversold.
The RSI is currently at 44, which is close to the oversold region. This indicates that the price of MATIC could potentially rebound in the near future. However, the Stochastic oscillator is currently at 27, which is also in the oversold region, indicating that the downward trend could continue.
The MACD is currently at -0.0230, which suggests that the trend is bearish. Additionally, the Volume oscillator is currently at -20%, indicating a decrease in trading volume.
Looking at the hourly timeframe, the EMA 100 is at 1.1002, which could potentially act as a level of resistance if the price of MATIC starts to rise. The On-Balance Volume (OBV) is currently at 47.544B, which indicates that there has been a net outflow of funds from MATIC over the past 24 hours.
Overall, the price of MATIC has experienced a decrease over the past 24 hours, and the technical indicators suggest that the downward trend could potentially continue. However, there are also signs that the market may be oversold and that the price could rebound in the near future. Traders should monitor the key levels of support and resistance, as well as the volume and technical indicators, to make informed trading decisions.

$matic weekend long setupactually long matic here from the divergence at the bottom of the channel.
think markets range over the weekend. plenty of scalp opportunities.
planning to tp around $1.16 and assess from there.
