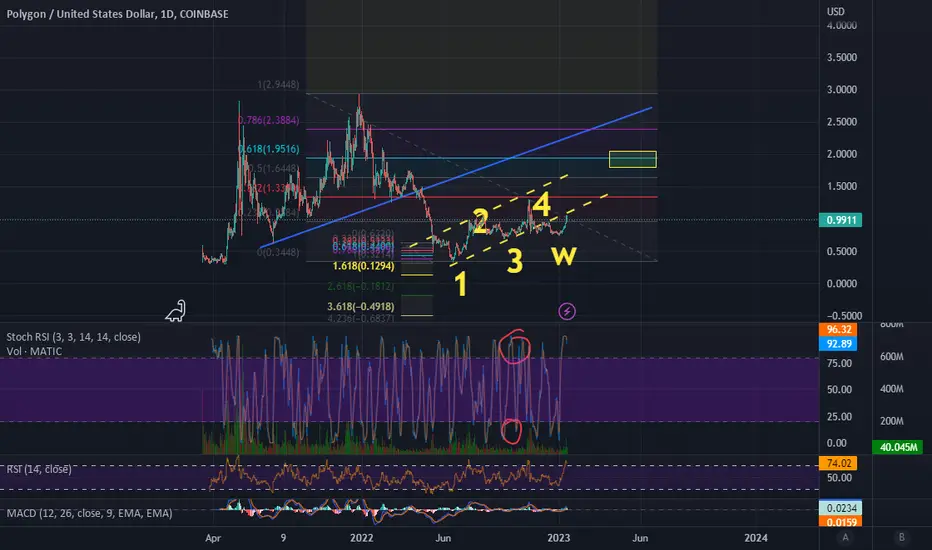
Polygon MATIC leaving the penny crypto area after last Fakeout⁉️MATIC leaving the penny crypto area after last Fakeout⁉️
Like in Stock Market the $1 mark is important for cryptocurrencies as well
Just see Polygon price reaction on the chart
Let me know your thoughts in the comments🤗
⬇️⬇️⬇️
Likes and Follow for updates appreciated🤗
Disclaimer:
Not financial advice
Do your own research before investing
The content shared is for educational purposes only and is my personal opinion
Polygon

MATIC (Polygon): Buy the Dip Strategy in short termHi everyone!
Matic Polygon' main trend is still bearish , but we do not rule out some interesting corrective moves in the near term. If our analysis is correct, it might be interesting to accumulate on corrective swing and let Long positions run to 0.9304 as first bullish target.
If this idea will be supported by your "Likes" we will continue to follow the crypto with updates below.
thanks for your attention and please... trade with care! 💖

matic start to show some weakness im going short from 1.30 $ first take profit 0.90
second 0.80
stop lose 1.35 BINANCE:MATICUSDT

Polygon (MATIC): ...bullish continuation in short term?Hi everyone!
Polygon (MATIC) has triggered a beautiful rally that we have followed in the last few weeks (see chart below), having said that, the trend is still bullish on intraday chart and from a technical point of view, it should be Long on all pullbacks in small times frame.
PREVIOUS ANALYSIS
(Click and Play on chart below)
Thank you for support and your "Likes" ....we will continue to follow the crypto with updates below!
thanks for your attention and please... trade with care! 💖

POLYGON/MATIC to $1.30-1.35Measured move off breakout on 3 day that closes tonight would be 1.30-1.35 looking at the FIB levels and the VPBR on the right for resistance room to grow a bit more and BTC has a similar area of volume at 30K and giant falling pizza too with the 61.8 at $48K, Remember the last bear market rally from $3k base to $14K Gonna Get interesting, see what happens in traditional markets and world tensions, could dampen any rally.

matic usdtbreakout on time frame 1d,nice for long therm breakout on time frame 1d,
tp 1 = 1,45
matic usdtbreakout on time frame 1d,nice for long therm

$MATIC - coming to LifeHello my Fellow TraderZ,
It seems #POLYGON ($MATIC) is breaking of the SYMMETRICAL TRIANGLE and looking forward to test its immediate resistance area ~ $1.25.
Most of the coins have pumped but $MATIC is lagging among them. Follow #BTC also if it pullbacks, $MATIC is no exception and will se the support below.
Happy Trading Fam. CHEERS!!!

MATICUSDT, key zones to watch and next move. UpdateHello guys, This is an update of previous analysis (blow link). Everything is explained on the chart for you like always. We said that the price has the potential to break its resistance and now the resistance is broken and IF the pullback is confirmed, it will continue to reach the target. The targets will be 1.3 and 1.7 .
Good luck.
If you like the idea, do not forget to support with a like and follow me for next analysis :)
Write your comment and opinion below to me

🔥 MATIC IS GOING TO BREAK $1 KEY LEVEL!🔥 Hi friends! The value area is a place where the whales accumulate/distribute their positions. Now MATIC is consolidainge inside the HUGE value area and I think it's an accumulation.
🚩The price of this altcoin should skyrocketing when it break the top boundary of this area ($0.96). So this is a main reason to open our longs before it happen and make a good profit.
📊 THE TRADING PLAN FOR MATIC:
1. squeeze to the trendline after the pullback
2. the huge buy orders on DOM and Footprint sclaping tools before the breakout
3. bullish BTC is a must have for the 99% of altcoins growth
🚩 The huge volume confirm the liquidation of the overleveraged long traders. It's force me to think that the recovery is possible even in a short term.
✅ MY TARGETS FOR MATIC:
🔥 $1 - key level and even number
🔥 $1.16 - key level and local high
🔥 $1.3 - key level and local high
Traders, I recommend you to book at least 30% of profit when the price reach each of our targets. Make a money and stay tuned!
💻Friends, press the "boost"🚀 button, write comments and share with your friends - it will be the best THANK YOU.
P.S. Personally, I open an entry if the price shows it according to my strategy.
Always do your analysis before making a trade

MATIC - Long scenarioThere are possible scenarios for matic to move upward.
targets are on the chart and keep in mind that any position you open, should have stoploss on 0.7. design your position with this SL and a good risk/reward.
in the green zone, we might have very low momentum, but as daily MACD gets above 0, it will jump.
all the idea will expire after getting lower than 0.7

$MATIC position being closedClosed $MATIC position entirely before
If wrong, it's okay, am sure other #crypto coins will pump more if this keeps pumping
Not liking RSI atm
If it sells off decently will rebuy, again
#p2e #metaverse #nft

MATICUSDT, key zones to watch and next moveHello guys, Everything is explained on the chart for you like always. Matic is below a strong resistance zone for now but has the potential to break it. Possible and expected next move and targets are explained to you. The targets will be 1.3 and 1.7 .
Good luck.
If you like the idea, do not forget to support with a like and follow me for next analysis :)
Write your comment and opinion below to me

Polygon (Matic) potential cup and handleAbout to enter Elliot Wave 3...very bullish...I can see upside potential to $2.40 longer term...expecting a short-term pop soon.

MATIC GONNA EXPLODEHidden bullish div on MFI. MFI is forming a falling wedge which will explode upside.
Feel free to comment your opinion.

MATIC - Poised for big against against BTC if history repeatsMATICBTC broke out to the upside of its 18 month channel and is confirming support above it. If we get a strong move to the upside, we may have a repeat of 2021. I'm long here.

Matic update 2023What Is Polygon (MATIC)?
Polygon (previously Matic Network) is the first well-structured, easy-to-use platform for Ethereum scaling and infrastructure development. Its core component is Polygon SDK, a modular, flexible framework that supports building multiple types of applications.

Polygon: Holy Poly Guacamole 🥑Let's show 'em how it's done! Polygon continues to spike up and should exceed the resistance line at $1.30, if it carries on with its bullish temper. Our alternative scenario implies, that MATIC could drop below the support line at $0.689 until it reaches the end of the blue wave alt. (ii).

Matic update #BarendsCryptoThis is an update to my Matic chart, likely this project will the price i set months ago.
long MATIC$MATIC bounced off the support level and the ascending trendline. Bullish movement to resistance level at 1.0546 is possible.

Large range channelMATIC is inside a large range channel in the daily timeframe between the resistance of $1.0751 and the support of $0.7475. The weekly MATIC candle has a long upper shadow; if it closes like this, the price correction could be deep. Therefore, the support level considered for MATIC is $0.8487. So, if we see signs of support, we expect price growth again.

✴️ Polygon Hits Perfectly First Resistance, Next Target Mapped It is hard to belief we haven't revisit Polygon since December 20... Yet it is my pleasure to share a new update for you but first, the previous trade idea to know where we are at:
✴️ Polygon Has Bullish Potential | Can Grow 100%+
Our resistance was hit perfectly and all the indicators are flashing green.
The RSI is trending up strong.
Before making the mistake to think that it will become overbought just zoom out and look at the weekly timeframe... Things are only getting started.
Always do this, when you see the daily timeframe looking over-extended, before reaching any conclusions first zoom out and you might get a new perspective.
Weekly MATICUSDT is moving above EMA50.
Closing and staying above this level is a very strong bullish signal.
Now, we are trading within higher low territory as we already know we can now aim/look forward to the next high.
There are many ways to extract targets/resistance levels but Fib. is our preferred tool.
This is giving us a potential target at $1.65 for 66%.
Very convincing...
It all looks really good but...
Remember, things can always change.
So we prepare for both scenarios, always.
What to do is prices go up, how much to sell and when to sell...
What to do if the chart changes and moves the other way... It is wise to prepare before-hand.
Nothing to lose, much to gain.
Namaste.

Polygon Long TermJudging by the moving averages on the weekly timeframe, closing the week below $0.75 will pull us to the level of $0.62. Conversely, staying above the $0.90 resistance is essential for a sustained rise to start. Closing this week with a green candle could target the $0.90 resistance.

MATIC/USDTesting/Tracking Elliot waves. Please do not trade without stop/loss.
Matic has been my favorite coin throughout this bear market. It has been one of the few coins constantly publishing updates
& making progress in a bear market. Countless numbers of partnerships especially with big name corporations is a plus.
This means a lot of people have faith in this project. Enough with this though lets get to the charts.
Chart timeframe is on the weekly.
I have posted a few charts on matic already and have been signaling the bottom since it hit .31. The reason for this is because that's the -90% drop.
If not all, majority of coins will go through a 90-95% drop from the top when we enter a bear market. If your coin has already dropped 90% and it risk falling another 5% is very little.
This is where you should start positioning more, regardless if it drops further or not. On this chart I am showing you 2 potential top for the next bull run. 4.7 and 7.8. Before I go any further,
let me quickly explain why you should've bought some at .31.
A 90% drop from the top of 2.9 brought us to .31
A 95% drop from the top of 2.9 brings us to to .15 or so
You would've been risking a -50% drop for a potential gain of 1400%+ R/R ratio of 29 (you can check by hovering over the long position: green & red chart)
Now I'm a big fan of DCA. let's say you decided to buy at .31 and it did go lower into a -95% drop. This is the perfect spot for you to add more into your position.
Not only did you get some for the above R/R ratio of 29 now you got some for even more. A -95% drop is normally the highest all coins drop, not many go much lower than this.
With a -95% drop your R/R ratio is 35. I've placed the stop loss at -98% cause I've seen some coins go there. Your potential gain from here is 3500%
Now you're adding your first position with second position. For these type of gains, the risk was very little.
Currently we're at a -69% drop from the top according to today's price. If we ever go near the prices of the above, God has given you a second chance. From today's price
your R/R ratio is 4.5 (437% gains) with the stop loss being under the -95% drop. The gains you potentially could've made has already gone down by tripled. The risk of buying here is still not bad, but
the once in a lifetime opportunity has already gone by.
The wave projection on this chart is based off of wave 1 and wave 2 already being made. Wave 3 target is an estimate of where the next bull run may take us. I tried to time the wave accordingly to the timeline, however,
Elliot waves cannot predict time. Chart timeline is based off of the bull cycles in the crypto market. We normally get 2 years bull & 2 years bear that corresponds to bitcoin's halving events.
