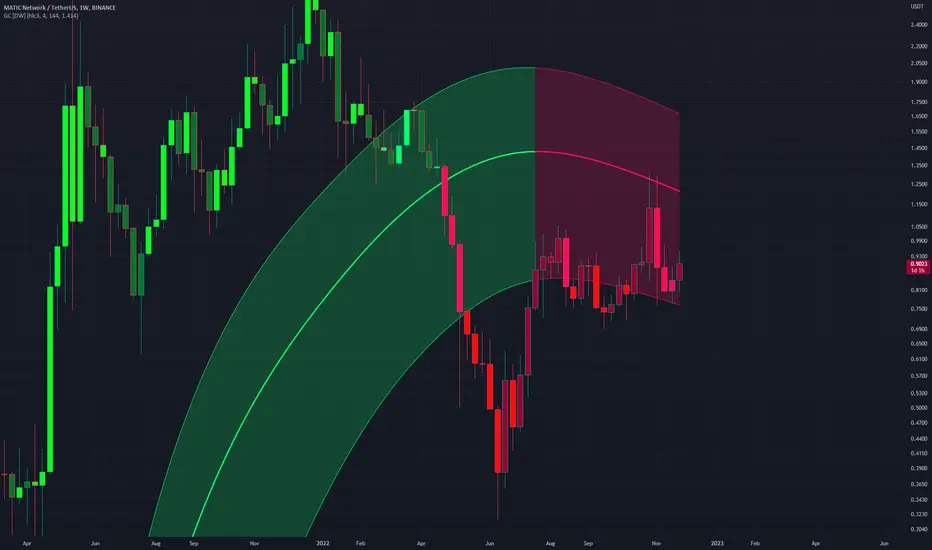
Polygon Massive BullflagWe can see a massive bullflag on the matic/btc chart.
There has already been a break-out and the retest of the upper resistance line confirms the pattern.
Expecting upside moves in the next year to come.
Polygon

MATIC: Pullback in UptrendPolygon (MATIC) technical analysis:
Trade setup : Pullback near $0.75 support and 200-day moving average could be an attractive swing entry in Uptrend.
Trend : Downtrend on Short-Term basis, Neutral on Medium-Term basis and Uptrend on Long-Term basis.
Momentum is Bearish (MACD Line is below MACD Signal Line, and RSI is below 45).
Support and Resistance : Nearest Support Zone is $0.75, then $0.50. The nearest Resistance Zone is $1.00, then $1.30.

MATIC/USDT WEEKLYHello traders, a new week is upon us!
#MATIC update with a look at the weekly candles.
We have formed a bearish engulfing candle formation after which a move down is very likely.
I will definitely look for short entries on the smaller time frames after the confirmation of the trend down to levels around 0.59.
Dollar Index in today London session lifted and currently goes up, if it breaks the current recent last low and maintains this level, this prediction could be confirmed

✴️ Polygon Has Bullish Potential | Can Grow 100%+Ever since the 18-June low, Polygon has remained strong and the lowest level hit after the early November price peak is above the 0.618 Fib. retracement level...
Let's dive into this chart.
Feel free to boost 🚀 to show your support.
Now, volume is a strong indicator we say but there is also another signal that is important to keep in mind.
We will call it the chart structure or stability.
Notice how MATICUSDT has been trading within a stable range after recovering from the June/July drop. This is a signal of strength.
When we had a strong injection of bear volume, prices remained trading above the Fib. 0.618 support level.
This whole phase is considered consolidation...
Consolidation happens before a price jump.
MATIC looks good, it can produce additional growth.
But keep in mind that the charts can always change.
That's why we have a plan, follow a strategy and use a stop-loss if we decide to trade.
Thank you for reading.
I hope you are enjoying the content and find it useful for your growth, learning, success and trading.
Namaste.

MATIC on the verge of a breakdownMATIC has a good downside potential, worth it IMO.
Touch of the Mid Channel + Trendline about to be broken.
NFA.

MATIC : Red Flagged Trade at least for the short term?Are we on the process of a megaphone pattern formation? This is just a thought and needs many more confirming indicators and market movement. Let's wait for some developments and I will update the chart. Stay Tuned.

Matic to continue downtrendSimilar to the macro conditions with BTC and ETH, Matic has a blood diamond on daily chart. I expect a 4 to 9 bar continuation to the downside. This gives us a price target of 0.71
Trading opportunity in MATICUSDTBased on technical factors there is a Sell position in :
📊 MATICUSDT
🔴 Sell Now or by Setup
🧯 Stop loss 0.8680
🏹 Target 1 0.7925
🏹 Target 2 0.7355
💸RISK : 1%
We hope it is profitable for you ❤️
Please support our activity with your likes👍 and comments📝

MATICMatic bottoms around .20c IMO. The triangle/diagonal is very constructive & makes me think MSTIC can lead the next altseason 2023.
I've been charting this for many months now in my group & we are waiting for this juicy op. ;)

MATIC won´t be different. When to buy?Most likely Matic (Polygon) won´t be different. It will go down together with the whole crypto market.
On the chart you can see 2 possible scenarios. The direction is down.
Because of the FTX drama, the sentiment is bearish and probably it will remain bearish for awhile.
In the next days or weeks we may see more crypto firms announcing their bankruptcy therefore altcoins won´t perform well.
Welcome to crypto market!

#Polygon Soars 28% From Q3 Lows, Will MATIC Breach $1?Past Performance of Polygon
Polygon could be up 28 percent from September lows, but bears are still in a commanding position. Overly, MATIC is bearish from a top-down preview and consolidating below $1. As long as the coin is trending below this psychological liquidation level and trading volumes are suppressed, traders can search for entries to liquidate. This preview can only shift once there are gains above $0.95, with traders confirming gains of late November 2022.
#Polygon Technical Analysis
At present, MATIC is consolidating. The path of least resistance in the short term appears northwards. The immediate resistance level is at $0.95, while support remains at $0.88. The optimism stems from the fact that prices are inside the November 30 bullish engulfing bar. From an effort-versus-result perspective, this is bullish, especially now that the recent bars driving MATIC lower are with low volumes. A close above $0.95 may see prices rise, roaring towards $1 in continuation of late November surges. Conversely, if MATIC sellers force prices lower, the coin could crumble, sinking to $0.80 or worse.
What to Expect from #MATIC?
Polygon is propped by solid fundamentals, looking at the performance in the daily chart. All the same, like the rest of the crypto assets, MATIC is under pressure. Ideally, a close above $1 will trigger demand. But before then, the main resistance level lies at $0.95.
Resistance level to watch out for: $0.95
Support level to watch out for: $0.88
Disclaimer: Opinions expressed are not investment advice. Do your research.

MATIC 4H ANALYSIS Matic very well project.
Resistance $0.90 ,0.95,$1
Support $0.85
Matic trying $1 Breakout.
Matic Long Term Vision $5
Matic

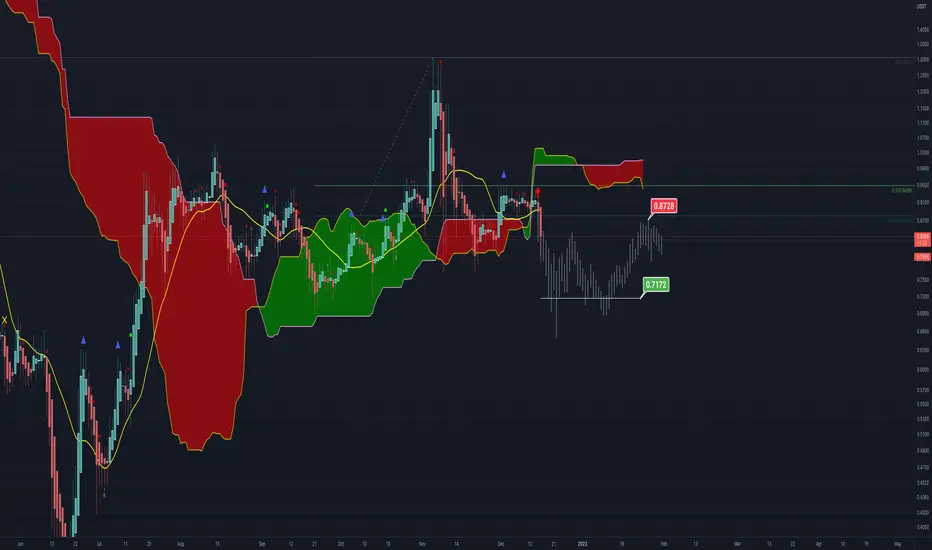
Can MATIC be supported on the HA-High line...Hello?
Traders, welcome.
If you "Follow", you can always get new information quickly.
Please also click "Boost".
Have a good day.
-------------------------------------
(MATICBTC 1W chart)
If the price holds above 0.0000 5049, it is likely to explode the upside force.
---------------------------------------
(MATICUSDT 1W chart)
On the MATICBTC chart the price is in the high range, but on the MATICUSDT chart this is not the case.
This phenomenon is caused by the price fluctuation of USDT following the fluctuation of BTC price.
Therefore, the charts we usually see and trade are the MATICUSDT or MATICKRW charts.
However, I think the MATICBTC chart serves the same purpose as a dominance chart or an index chart, showing the strength of MATIC when the BTC price starts to show an upward trend.
Therefore, even if the price on the MATICUSDT or MATICKRW chart declines, if the MATICBTC chart maintains the price, eventually MATIC will show an increase in price.
In this sense, looking at the MATICUSDT chart, it can be interpreted that if the price is maintained in the 0.6164-0.8191 range or higher, it is likely to show an uptrend.
So, if it goes up, I expect it to touch around 1.2246.
(1D chart)
The question is whether the price can hold above 0.8647 and rise above 0.9486
-------------------------------------------------- -------------------------------------------
** All descriptions are for reference only and do not guarantee profit or loss in investment.
** If you share this chart, you can use the indicators normally.
** The MRHAB-T indicator includes indicators that indicate points of support and resistance.
** HA SRRC indicators are displayed as StochRSI (line), RSI (columns), and CCI (bgcolor).
** The CCI indicator is displayed in the overbought section (CCI > +100) and oversold section (CCI < -100).
(Short-term Stop Loss can be said to be a point where profit or loss can be preserved or additional entry can be made by split trading. This is a short-term investment perspective.)
---------------------------------

DOT Long Idea 💡 DOT retraced back to 61.8 fib level and here I'm looking forward to the following trade:
***SPOT ONLY***
Entry1:5.29 (20%)
Entry2:5.20 (30%)
Entry3:5.13 (50%)
Tp:
5.47
5.57
5.73
SL : Orange box
Note:
This is only according to my analysis.
Not a financial advice
DYOR

MATICUSD Non-Log Trend Line Drawing a trend line between two strong flag like structures
The first prior one popped off greatly, will we see something like this for the second flag structure?
Post to support my prior Analysis that got a few views the other day

MATICUSD Repost (It Reminds Me) MATIC Definitely reminds me of an early Ethereum in many ways
This chart furthers that
Structure with labels 1,2,3 can be seen in early ETH chart
This structure is current on MATICUSD
Will we catch a 13000% move on MATICUSD? As was seen on ETH?

#MATIC SHORT (Triple Top)BINANCE:MATICUSDT This looks like a great entry for a low/medium leverage (5-10x) Short.
*This is not financial or investment advice.
BINANCE:MATICUSDT

MATIC is in danger, it will DUMP hard!Hello, everyone!
Let’s continue to analyze the most dangerous altcoins which showed the greed during the bounce on the Bitcoin. Today it’s MATIC time. It now has the most dump potential. I suppose that the market maker created the fake growth on this altcoin to show other traders the illusion of the asset’s power. Of course it’s fake and MATIC is going to break or at least test it’s bottom at $0.33 and I will show you why. Let’s go!
Let’s take a look at the 1D time frame of the MATICUSDT of the WhiteBit exchange. The bottom at $0.33 was the end of the wave 3 as on the entire crypto market. The corrective wave 4 retraced this wave with the zigzag correction. Zigzag correction usually consists of wave A (5 waves), wave B (3 waves) and wave C(5 waves). You can see on the chart how perfectly the market structure for MATIC corresponds to this theory. One question you can have is why the wave 5 did not break the wave 3 top in the wave C. I can explain it because wave 5 could be trimmed. It’s OK for the altcoins.
Now the price is drawing the wave 5 and I suppose the the sub wave 3 of this wave is in progress. The minimal target for the wave 3 is the $0.61 – 1 Fibonacci extension level, but I think MATIC will hit $0.3 again because the 1.61 Fibonacci placed right here.
Best regards, Ivan
_______________________________________________________________________
Guys, if you like my analytics, please support me with your boosts and comments!

MATICUSD - Contained Within Channel MATICUSD on a Weekly timeframe
Price has moved up within the Gaussian Channel
Price will likely led to a breakout to the upside as this containment within channel continues and is seen as support
This can be seen as a bullflag on the Monthly, which I have linked below
MATIC - Ready for Higher30 cents to 1,27$ was the previous set and Matic seems ready for a new rise to the same level 1,27$
Only this time it will be the third and third attempts have greater chances of succeeding.
Still early since the first target is 1.09$ but things in crypto move fast.
Some projects will go to Zero, others will rise. Matic Polygon is in the second category.
News:
The number of Polygon-based NFT sales has increased by 191% since the end of September, the best result of any blockchain. This mark has been achieved by integrating Polygon's power into the infrastructure of top Web2 companies. In a short period of time, Starbucks, Instagram (Meta), Reddit and many others have used this Layer 2 blockchain's capabilities. How have NFTs fared during the downturn? Polygon saw a 191% increase in NFT sales since the end of September as Web2 companies attempted to fully integrate NFTs into their platforms.Starbucks, Reddit, and Meta have all integrated with Polygon.
Polygon is currently fourth among all chains in terms of total NFT sales since the beginning of the year. However, it would be more interesting to see how Polygon's successes this autumn have affected the price of the fuel powering its network. We're talking about MATIC, currently ranked tenth among the largest crypto assets.
Polygon seems like the right choice.
One Love,
The FXPROFESSOR
PS. Remember: market is GREAT if you are used to taking profits:

Polygon Remains One Of The Strongest ... (111%+ Possible)Polygon (MATICUSDT) has been really strong ever since the June 2022 low and is setting itself up once again for fast growth.
With the current chart we have on screen, we can project a mid-term target of 115%+ growth potential, even possible in the short-term.
That's because we have higher lows and massive strength shown when the correction took place. Prices stayed above the .618 Fib. retracement level.
The easy target can be seen around $1.14 and $1.25.
The main target can be set around $1.85.
It is a bit far off, but once the Altcoins start moving, they tend to do so fast and strong.
No doubt about that, that's why we like crypto...
Endless opportunities and massive potential for growth.
Namaste.

Potential DeFi Bearflag Testing 88.6% Retrace as ResistanceI'm currently not so optimistic about DeFi products and believe that it will be the weakest sector in the crypto market so I have been taking and looking for bearish trades within the DeFi Market and Matic, along with ETH right now appears to be in a position where they could crash and lose a lot of their respective values.

Polygon MATIC price Medium and Long term tradeThe MaticUSDT price was one of the first to break out of the falling trend channel back in July this year.
Now MaticUSD is trading above the liquidity zone of $0.67 - 0.77
You can try a medium-term trade:
Entry $0.831
Stop $0.7624 (-8%)
Take profit $1.1974 (+44%)
Profit/loss ratio 5/1
You can also consider this trade as a long-term investment and hold it until the take profit of $1.90 (+127%)
You can also keep a larger stop on the position, around $0.67
There are many options, it depends on what parameters your risk and money management allows .
But it is probably not worth getting the Polygon token - Matic when the price will be below $0.67 . After all, there is an "emptiness" below the liquidity zone and the possibility of the MaticUSDT price collapsing to around $0.4
_____________________
Did you like our analysis? Leave a comment, like, and follow to get more
