Matic Wave 3 starting target $1 We have our first 5 waves, then and ABC and now another 5 waves movement starting the wave 3 target $1. NFA
Polygon

October 11 BTCUSD BingX Chart Analysis and Today's HeadlineBingX’s Bitcoin Chart
According to CoinShare, digital asset investment products saw outflows totalling US$5m last week. Bitcoin is down 2.41% over the last 24 hours and fell to an intraday low of $18,955.00. The largest cryptocurrency fell below the 20-day exponential moving average (EMA) ($19,584) on Oct 7, and the buyers were not able to push the price above the 20-day EMA since then, suggesting that the BTC/USDT pair may lose its upward momentum. If the seller increases the pressure further and pulls the price below the $19,000 price level, the BTC/USDT pair could drop into the $18,125 to $17,622 support zone. Conversely, if the price rebounded from the $19,000 price level, the price could rise to the 20-day EMA.
Today’s Cryptocurrency Headline
Polygon Launches zkEVM Public Testnet
Polygon announces the launch of the Polygon zkEVM public testnet, the first zkEVM to reach public testnet with an open-source ZK proving system. Zero-knowledge (ZK) tech is one of the most prominent and promising paths to scaling Ethereum, which allows developers to transfer their smart contracts from Ethereum smoothly It is reported that AAVE, Uniswap, Web3 social platform Lens and game studio Midnight Society will be amongst the first protocols to use the zkEVM testnet.
Disclaimer: BingX does not endorse and is not responsible for or liable for any content, accuracy, quality, advertising, products, or other materials on this page. Readers should do their own research before taking any actions related to the company. BingX is not responsible, directly or indirectly, for any damage or loss caused or alleged to be caused by or in connection with the use of or reliance on any content, goods, or services mentioned in the article.

Polygon MATIC Strong Support LinePolygon MATIC is now at a strong support line from which i expect a rebound to the following price targets:
MATIC/USDT
Entry Range: $0.80 - 0.85
Take Profit 1: $0.95
Take Profit 2: $1.05
Take Profit 3: $1.17
Stop Loss: $0.69

MATIC - AnalysisMATIC had good price growth last week. The price continued to grow to the resistance range of $0.83 - 0.85 but considering that in the daily time frame, the current resistance range is a very important supply and demand area. Also, the current resistance has overlapped with the ceiling resistance of the long-term descending channel. Is. Therefore, breaking this resistance can activate the $1 channel targets. If broken, the short-term uptrend line in the 4-hour time frame could issue a bearish signal and push the price down to the $0.74 range.
Because a negative divergence has formed on the RSI indicator, which is one of the signs of a possible price decrease, it is necessary to carefully check the price in the range of 0.85 dollars along with the volume of transactions. On the daily time frame, the Ichimoku super-indicator still acts as resistance above the price, confirming the range considered. Therefore, the price passing through the cloud can signal an upward trend in the short term.
MATIC - Double BottomA bullflag breakdown into a double bottom is evident in early price evolution
This seems to be happening again with a bullflag being present, all that's needed now is a small breakdown and from there it is lift off as per the bullish double bottom pattern
Daily Chart
Posting some of my previous MATIC analyses

Matic target $0.35 SHORT, wave 3 about to startIMO... MATIC bounced from around $0.30 to make a perfect 5 waves correction move, then we have our A,B,C and now we are starting our move to the bottom again to fill the institutional orders. This will create the double bottom we are waiting for this bear market to end... NFA

MATIC/USDT Looks Bullish on 4h ChartMATIC/USDT Looks Bullish on 4h Chart
Took out the low and now trying to recover back above the support🧐
Bull if does so📈
Follow me For daily chart analysis :
MATIC/USDT
#MATIC/USDT
#maticusdt
#long
#bull
#bullish
#longpostion

Polygon (MATIC) - October 6Hello?
Welcome, traders.
By "following", you can always get new information quickly.
Please also click "Boost".
Have a good day.
-------------------------------------
(MATICUSDT 1W Chart)
The 0.6164-0.8191 interval is the interval that determines the trend.
Therefore, it is likely that the trend will continue in the direction off the 0.6164-0.8191 range.
Therefore, if the price holds above 0.8191, it is expected to move towards 1.2246.
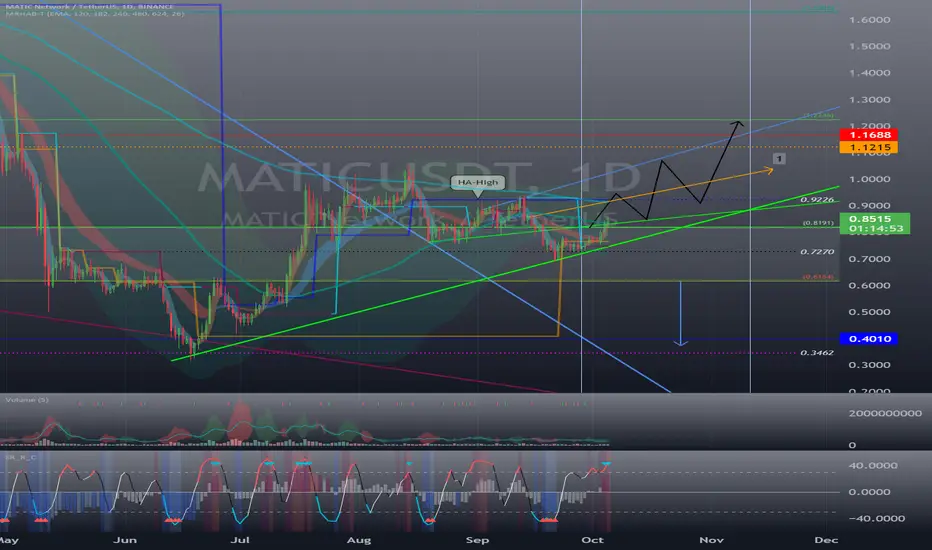
(1D chart)
In order to continue the upward trend, it must rise above the HA-High indicator.
Therefore, the key is whether it can rise above 0.9226 and find support.
If it falls below 0.8191, we need to see if there is support in the 0.6164-0.7270 range.
------------------------------------------------------------ -------------------------------------------
** All descriptions are for reference only and do not guarantee a profit or loss in investment.
** If you share this chart, you can use the indicators normally.
** The MRHAB-T indicator contains indicators that indicate support and resistance points.
** SR_R_C indicators are displayed as StochRSI(line), RSI(columns), CCI(bgcolor).
** CCI indicator is expressed as overbought range (CCI > +100) and oversold range (CCI < -100).
(Short-term Stop Loss can be said to be a point where profit and loss can be preserved or additional entry can be made through split trading. It is a short-term investment perspective.)
---------------------------------
$MATIC - BULLISH but CautiousHello my Fellow TraderZ,
#POLYGON ($MATIC) is going inside the Descending Channel Pattern and again got rejected by the Upper Trendline.
The recent upward movement was also supported by the RSI momentum which clearly was showing Bullish Divergence.
Now I see on 4 HTF price going to come and retest the MA50/200 at the least.
Also on 1 HTF, it is clearly visible that Price was maoving inside the Ascening Triangle and broke the Triangle beautifully and again coming to retest. Here my projection for the coming hours/days where we could go to the $0.9
Happy Trading Fam. CHEERS!!!

SHORT MATICUSDT (Back down to $0.50-$0.70)Entry Price, Stop Loss, Take Profit, and Liquidation Price are all labeled.
Leverage Used: 5x (Short) - Isolated Marigin
Please let me know what you think in the comments!
* I am not a financial advisor. These charts I provide for free are brief explanations of current trades I am in.
Thanks!

$MATIC | Extreme over bought levels upcomingI recently took a long with MATICUSD and was a successful trade. It has also cleared previous resistance currently and looking toward the next short term (drawn from the Daily) resistance level, highlighted with the blue line. MATICUSD is also clear of the 200 EMA but if you look at past movements, the 200 EMA has not been respected by any means. We are also approaching extreme over bought levels at 70+ with the upper band of the Bollinger Band being broken. My eyes are on this and looking for a confirmation candle to SHORT from the most resistance line.

Possible MATIC Bear Flag continuation Thoughts on this one? There is heavy resistance at approx the $0.8 area

$0.32 MATIC testing yearly June lows?Will MATIC retest $0.32 which was the 2022 June lows, BTC looking to correct so...

Matic| We only go forwards not backwardsIf we go down too much further, then its over now. This chart is really showing me that right now we should be going parabolic. Our initial trend line is exponential
Showing a dip down to 66-72 cents but we were just there...we only go forwards not backwards

#Polygon Prices Volatile; are MATIC Bulls readying for $1?Past Performance of Polygon
Like the rest of the crypto market, Polygon is moving within a narrow range and is bearish. Therefore, while buyers stand a chance, sellers may press on and force MATIC below multi-week support. Per the MATIC price arrangement in the daily chart, support lies at $0.701.
#Polygon Technical Analysis
MATIC prices are range bound at spot rates, anchored within the September 22 bull bar despite strong opposition to the upside. Primary support is at $0.701, marking last week's lows and flashing with the 50 percent Fibonacci retracement level of the June to August 2022 trade range. Technically, traders might find loading opportunities if prices are above $0.701, targeting $0.930 in the medium term. Conversely, sharp losses below this week's low may crush bulls, initiating a sell-off towards $0.60, the 61.8 percent Fibonacci retracement of the above-mentioned trade range.
What to Expect from #MATIC?
The crypto market is volatile, and so is MATIC. There are hints of strength, but the uptrend may hold if prices exceed $0.701. This may, in turn, fan demand, lifting the coin towards $0.930 and later $1 in a buy trend continuation formation.
Resistance level to watch out for: $0.930
Support level to watch out for: $0.701
Disclaimer: Opinions expressed are not investment advice. Do your research.

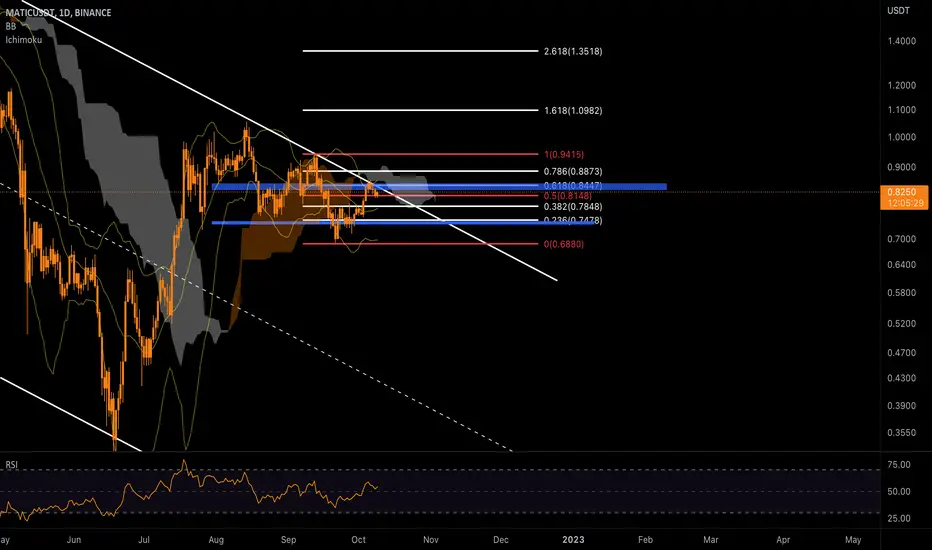
Price predictions for MATIC. Are you Bullish on Polygon?My primary expectation for Matic is one more low in a wave five of the wave c. However it has done a lower low so we could technically go up up from here and nearly hit the 50% fib which is an ideal retracement for a lager wave 2. If we are in the wave 4 still before wave down in the wave C. We could comedown between 0.6867 all the way down to 0.4587 in a wave 2. If we come down any further I will be laddering buy orders down to 0.45 cent. Just remember it reversing in this area is not guaranteed but I think its very likely. If we do reverse to the upside the wave 3 targets would be 1.41 to 1.86 which is 90 to 150% from where we are now. :)

MaticWe are at the exact point where our exponential trend line is getting more parabolic so we must push up now to sustain and continue it. Something is forming in these patterns, this is my easiest but most effective way to look at it.

MATICUSDT Market Update 28/09/2022MATIC formed inverse head and shoulder and traded near to its neckline. Here we have to keep an eye on a successful breakout of the neckline, which will confirm its bullish move towards the upper marked resistance levels.
If MATIC loses strength and lost its right shoulder path then that would be a sign of another leg down in MATIC. Some further price action will confirm its direction.

Polygon (MATIC) - September 28Hello?
Welcome, traders.
By "following", you can always get new information quickly.
Please also click "Like".
Have a good day.
-------------------------------------
(MATICUSDT 1W Chart)
The key is whether it can support and move up in the 0.6164-0.8191 section.
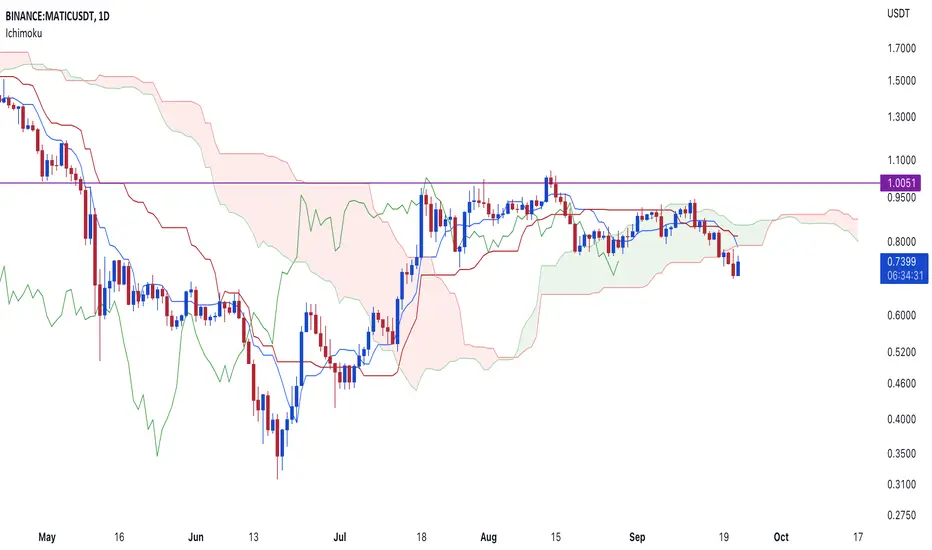
(1D chart)
The key is whether it can move above 0.8191 and move up along the rising channel (1).
If it falls below 0.6164, it is expected to fall around 0.4010.
------------------------------------------------------------ -----------------------------------------------------
** All descriptions are for reference only and do not guarantee a profit or loss in investment.
** If you share this chart, you can use the indicators normally.
** The MRHAB-T indicator contains indicators that indicate support and resistance points.
** Background color of Long/Short-S indicator: RSI oversold and overbought sections
** SR_R_C indicators are displayed as StochRSI(line), RSI(columns), CCI(bgcolor).
** CCI indicator is expressed as overbought range (CCI > +100) and oversold range (CCI < -100).
(Short-term Stop Loss can be said to be a point where profit and loss can be preserved or additional entry can be made through split trading. It is a short-term investment perspective.)
---------------------------------

matic polygon0.96 is our resistance line. if we surpass it we will go to 3$
i based my stimations on RSI and ghost candles, from the last bullrun one year ago.
a cup and handle is being formed.
if you want another coin, just say it.

MATIC - Video Top-Down Analysis!Hello TradingView Family / Fellow Traders. This is Richard, as known as theSignalyst.
Here is a detailed update top-down analysis for MATIC .
Which scenario do you think is more likely to happen? and Why?
Always follow your trading plan regarding entry, risk management, and trade management.
Good Luck!.
All Strategies Are Good; If Managed Properly!
~Rich

MATIC repeating ETH's first run : UPDATE 2022MATIC repeating ETH's first run : UPDATE 2022
check out my old analysis following this idea. the red squiggle from that one played out. was really hoping it wasn't over yet but alas the world seems to be crumbling down and it was already over. just deal with it. life goes on.
there is always another train through the station as long as we haven't nuked ourselves into oblivion.
anwayyyy this seems to be playing out nicely. the chart says it all. the repeating RSI pattern says we've bottomed already. or it seems that way anyway. RSI can be a tricky beast tho, you need to be careful with it.
it does seem like macro wise there has been enough blood but there are some fundamental bad things playing out in the system. war/climate change/massive unraveling of over inflated assets/normal max inflation etc etc so i wouldn't be surprised if it goes down another big leg.
two options there, clearly just wait and see if it all reverses on that first support coming up. then matic maybe a nice play. 250% sounds good to me.
lets see how this one goes. good luck to you fellow degen.
x
