Pretty cool patternAlthough, this is not a perfect cup & handle I'd say it's pretty darn close. The last bullish engulfing candle confirmed it for me. What is important here is to get a move above $0.75 that would start to change the trend & Matic certainly has a lot of upside potential from there.
Polygon

Matic 200EMA Retrace.Going back down to touch the 200EMA ladies and gentlemen, in my opinion. Happy Trading!

Polygon (MATIC) - July 14Hello?
Welcome, traders.
By "following", you can always get new information quickly.
Please also click "Like".
Have a good day.
-------------------------------------
(MATICUSDT 1W Chart)
The interval 0.6163-0.8191 is the interval that determines the trend.
Therefore, it is important to be able to support and rise in this section.
If it falls below the 0.5590-0.6163 section, it may lead to further declines, so a short-term stop loss is required.
(1D chart)
If support is found near 0.6163 by the next volatility period around July 29, I would expect further upside.
------------------------------------------------------------ -----------------------------------------------------
** All indicators are lagging indicators.
Therefore, it is important to be aware that the indicator moves accordingly with the movement of price and volume.
However, for the sake of convenience, we are talking in reverse for the interpretation of the indicator.
** The MRHAB-T indicator used in the chart is an indicator of our channel that has not been released yet.
** The OBV indicator was re-created by applying a formula to the DepthHouse Trading indicator, an indicator disclosed by oh92. (Thanks for this.)
** Support or resistance is based on the closing price of the 1D chart.
** All descriptions are for reference only and do not guarantee a profit or loss in investment.
(Short-term Stop Loss can be said to be a point where profit and loss can be preserved or additional entry can be made through split trading. It is a short-term investment perspective.)
---------------------------------

POLYGON MATIC is about to reaccumulate monster shotInstrument is growing up shrply and we might have a great reaccumulation phase before mooning to the 0.78$ which will be last stand of the bulls and bears will take momentum

#Polygon surges 85%, will MATIC Bulls Break above $0.67?Past Performance of Polygon
Polygon prices are overly stable, trading inside a broader $0.22 trade range clear in the daily chart. While traders expect more gains in the days ahead, the failure of bulls to clear above $0.67, a multi-week liquidation level, could slow down the uptrend in the short term.
#Polygon Technical Analysis
The primary liquidation level marking June 2022 highs stands at $0.67. Although MATIC traders are confident of more gains, there must be a clear, high volume close above this line before traders double down, targeting $1.20 in the medium term. However, the daily chart shows signs of waning upside momentum since the stochastic is at the overbought territory. In that case, traders should watch out whether buyers will build momentum to surge above $0.67. On the reverse side, losses below $0.45 or last week's lows, may invalidate the uptrend, possibly triggering a sell-off towards $0.33.
What to Expect from #MATIC?
Buyers are confident after surging 85 percent from 2022 lows. All the same, prices are flat-lining around a critical liquidation level. In the short term, traders can wait for a sharp close above $0.67 or $0.45 for immediate trend definition.
Resistance level to watch out for: $0.67
Support level to watch out for: $0.45
Disclaimer: Opinions expressed are not investment advice. Do your research.

Polygon: Promising 😊After completing wave 2 in green in the green zone between $0.44 and $0.42, Polygon has proceeded to battle its way upwards. If it can keep up this drive, it should soon make it above the resistance at $0.62, which would then augur well for further ascent.

Ichimoku Analysis for MATICon 4hr tf will get resisted at 0.58 level. As per daily tf it will enter the cloud if it breaks that level.

⚡️ #MATIC/USDT - Potential 90% ⚡️⚡️ #MATIC/USDT - Potential 90% ⚡️
Entry Conditions:
Bullish Divergence
Bottom Of Triangle Range
Partnership Announcement
Moving Averages Turning Bullish
News Source:
blog.polygon.technology
Entry: 0.386 - 0.515
TP1: 0.572
TP2: 0.627
TP3: 0.683
YOLO: 0.747
SL: 0.27 or HOLD

Polygon #MATIC Update (Jul-06)Indeed, MATIC has fallen too sharply in May and now it is looking for a way to recover. As evidenced by the strong buying back on June 19 and helped MATIC rise sharply from $0.3 to $0.6, this buying force is quite unusual and it shows the overwhelming strength of the money flow.
Currently, MATIC continues to face a big problem that it has to hold the $0.50 zone. It has just conquered this zone and only if it does not lose this zone will it continue to have a similar rally on June 19 and break out of the current Broadening Falling Wedge pattern to move towards the $0.75 zone. Breaking through the $0.75 zone at this point is very difficult and let's wait for a further target.
However things will get very bad if it loses $0.5 zone back, it might crash because of the pressure of profit taking on LONG positions of the last June rally and it will fall very hard with The target could be the $0.20 zone in just a few days.

Polygon MATIC Entry Range, Take Profit and Stop LossAfter the sell signal
and the buy signal
here comes the continuation!
MATIC/USDT
Entry Range: $0.48 - 0.53
Take Profit 1: $0.62
Take Profit 2: $0.70
Take Profit 3: $0.93
Stop Loss: $0.41

MATICUSDT 1D Great potential for growth, but there are conditionToday we will consider what prospects are emerging for the Maticusdt trading pair
But to begin with, we offer you a look at our previous idea for a Maticusdt pair, which we did 2 months ago.
In it, we noted an important liquidity zone of $0.67-0.81. However, during the fall, there were no buyers in it. This was clearly visible when sellers easy fixed the Matic price below this zone, which in turn is a clear signal for activation of the red scenario.
Today, the chart shows signs of "recovery" and the desire for the Maticusd price to rise a little.
In the coming days/weeks, the $0.67-0.81 zone will act as strong resistance.
To continue the rapid growth with a maximum target of $1.10-1.20 , buyers need to anchor in the liquidity zone of $0.67-0.81 and follow the blue route.
If at the approach of $0.67 there are signs of weakening growth and will start consolidation below this zone, then activation of the red route is possible with a potential correction to $0.45
_______________________________
Since 2016 , we have been analyzing and trading the cryptocurrency market.
We transform our knowledge, trading moods and experience into ideas. Each "like under the idea" boosts the level of our happiness by 0.05%. If we help you to be calmer and richer — help us to be happier :)

MATIC long opportunity- Bounce off of strong support
- Massive capitulation candle down
- Bullish momentum on the 1h chart
TP1: $0.4950 for 2R/R trade.
TP2: $0.5125 for 3R/R trade

Important Week For BuyersHello to all members of TradingView and my followers.
MATIC dropped again last week after reacting to the resistance range of 0.60 to 0.64 dollars. MATIC, which started a great rally from the $0.32 range, this bullish move shows strong support from buyers. Therefore, it can be concluded that according to the candles of the last wave, as well as the reaction recorded in the range of 0.40 to 0.435 dollars in the last four days, the price has pulled back towards the downward trend line. But the pullback has not yet fully formed.
Therefore, I expect to see another push to the $0.40 support level. So, if the current support is maintained, the price movement and buyers' efforts could resume once again towards the $0.60 range.
If it is helpful to you, please like it. If you have a comment, I'll be happy to know. Respectfully.

MATIC/USDTesting/tracking elliot wave theory. Please do not trade off idea without S/L. Not financial advice.
89% drop already from ATH
97% drop is still possible (extra 8%)
This 8% from ATH is consider an 80% drop from current price.
RR: 11
Possible upside: 930%
Possible downside: 83%
This is the highest possible downside from all the other charts I see. I would stay away from margin trading this one. Risk is too big.
The thicker the green line, the heavier the support/resistance is.

MATIC - Updated LevelsMassive drop, again but we see some support here.
Could be good for day trading but mind the market is bearish so some short positions are needed. Not on this chart now as we see support at 0.45 and we wouldn't go short, only under 0.43
One Love,
the FXPROFESSOR

LUNA LUNC USD : LUNA + MATIC FRACTAL, LUNA COULD EXPLODE FAST!FOLLOW, LIKE, AND COMMENT IF YOU APPRECIATE THIS CONTENT. THANK YOU.
LUNA CLASSIC Has had some new developments come into it over the past couple of days. Starship the largest Metaverse by size will be incorporating LUNA Classic into their project. LUNA will be used for payments in the Starship Metaverse, and from each payment 1.2% of the Luna will be burned. Depending on how big and popular this metaverse will be this could be huge for LUNA classic holders. The price of LUNA Classic will continuously go up over time because of the burn rate. Luna could eventually reach 1 dollar again in the not too distant future, maybe a few years or less and continue to rise as the supply of Luna is constantly decreasing. All it will take is another project to accept luna in the same way and burn as well and the supply of luna will go down rapidly, in turn increasing the price rapidly. I don't know what will come of this but with these new developments I will be buying into LUNA again and holding for the longer term. The risk to reward here is a no brainer at this point. I mean LUNA really hit people hard and it sucks, but this may be the driver and the catalyst for LUNA Classic to explode. If the community takes over LUNA and then DO KWON is found guilty of the crash etc, then his new LUNA 2.0 will crash to nothing and every project and platform on the LUNA 2.0 chain will migrate over to LUNA Classic because no one wants to support a crook. This could be massive my friends and this could be a once in a lifetime opportunity here. I sold out of LUNA back when it hit 12 cents and I said I was done with it but now with these new developments I believe LUNC has a chance to take off and get back into the dollar figures in the future. If 10 companies/projects work on LUNA Classic and all are burning coins the supply of Luna could rapidly fall and LUNA could be in the single digit billions supply fast.
In the chart you will see a fractal from MATIC Polygon that is really similar to LUNC. After this rally/pump we may see another big drop and then off to the races. Matic dropped 70% in one night back in 2019 and no one knew what happened, and people were calling it dead, pump and dump, similar to LUNC. Matic then went on to rally from about $.01 cent (one cent) to $3. That is a 300x gain. $1000 bucks right now will get you about 8 million LUNC. Imagine if LUNA gets back into the dollar digits, you'll be kicking yourself for not spending a few bucks at these levels. Look at what happened to DOGE holders, multiple millionaires and a couple billionaires were made, and thats just one example of recent, there is hundreds of them. I am supporting this new LUNC community because not only do I believe it will thrive again, but also because I want people who lost everything to be able to get their money back some day, my heart aches for them. Good luck out there my friends and thank you. This is not financial or trading advice this is just what I am doing and my opinion.
BELOW IS A DIRECT COPY AND PASTE ABOUT THE NEW DEVELOPMENTS ON LUNA CLASSIC
StarShip is a quickly growing ecosystem built around a solid foundation of collaborative, loyal businesses and passionate community members. Their whitepaper opens with the statement that “community is at the heart of currency”, and the vibrant culture of partners and projects surrounding the StarShip NFT Game and StarShip’s strong liquidity pool pairings are already a testament to their dedication to this mission.
Recently StarShip unveiled a trailer featuring actual in-game footage of what will be the largest metaverse in existence to date. Built on the powerful new Unreal 5 engine and boasting 32,000 square kilometers of buildable space, the size of this MetaUniverse will allow room for unparalleled long-term growth and opportunity. As a result of LUNC’s new collaboration with StarShip, LUNC will be implemented into the StarShip ecosystem as one form of payment within StarShip Universe, burning 1.2% of all LUNC received for these payments.
In related news, the 1.2% burn tax mechanism put forward in LUNC’s Prop 3568 was successfully passed on Sunday. This will begin to reduce the supply of existing tokens as they are circulated, which comes as great news to its loyal holders. Finding a strong use for LUNC comes at an opportune moment. As StarShip welcomes the Luna community, this collaboration strengthens the foundations of both ecosystems.

Polygon , MATIC/USDT Update 📈📉HEY, Sup Guys and Girls?!
As you can see ,I've posted some analysis for polygon ,that Almost have been successful , but in the last one because of crypto market crashes it wasn't able to rise again ,and according to my bearish scenario , it has been falling up till now, and even lost the support zone ( more than 80 %💰 (1x-short ))🎯 .
recently There are many fundamental developments coming up, and the latest news is about the Bitgert adding Polygon Matic to its chain. The Bitgert BRC20 blockchain has been one of the most talked-about blockchains today because of its attractive features. Bitgert chain popularity has come from its zero gas fee and also the fastest blockchain in the market.
So ,after the weeks of plummeting, Polygon Matic finally pushed past the $0.63 mark in last week. The Matic price hit $0.631 , but the coin has since pulled back, and at the time of this writing, Matic was trading at $0.4825. However, the market is a little bit bearish and it can fall again on the current support , but there is the potential for Matic /usdt to do well this week. so it can even see the higher resistance zones in next weeks, but guys take it mind , everything is depends to bitcoin again , so in this case if it loses the support zones so it can fall on the lower support zones and at there, bulls can raise the price again!
✌️ Good luck with your trading and investing and remember: Trade smart…OR JUST DON’T TRADE!
--------------------------------------------------------------------------------------------------------------------
👉This analysis is my personal opinion ,not a financial advice ,so do your own research.
💜 if you're fan of my analyses please follow me , give a big thumbs 👍 OR drop a comment 🗯

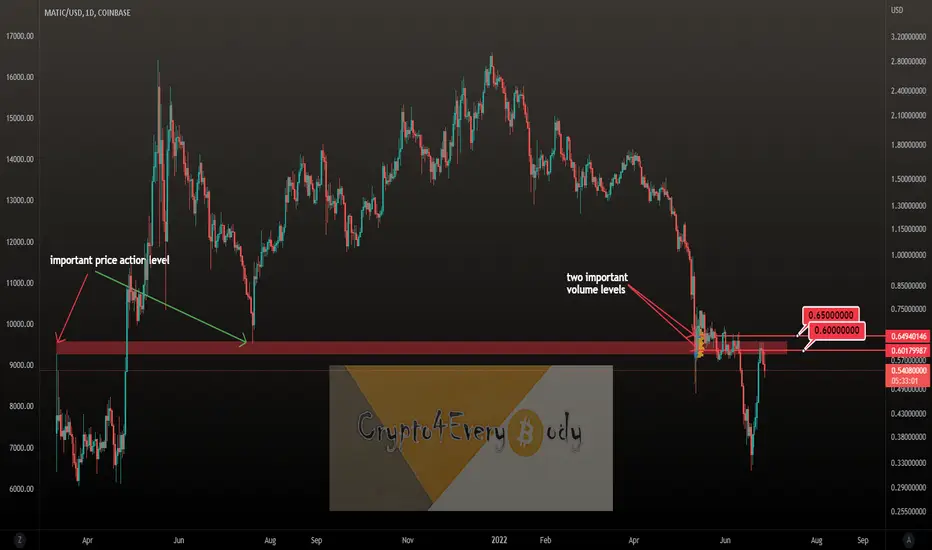
Polygon (MATIC) - $0.60 - $0.65 to breakPolygon (MATIC) - $0.60 - $0.65 to break
That important price action and volume action area has to be broken as a first bullish signal
Current trial did not work - next to follow, right dear Crypto Nation?
Drop me a nice comment if you'd like me to analyze any other cryptocurrency.
*not financial advice
do your own research before investing
Polygon (MATIC) - June 27hello?
Traders, welcome.
If you "follow", you can always get new information quickly.
Please also click "Like".
Have a good day.
-------------------------------------
(MATICUSDT 1W Chart)
The interval 0.616-0.819 is the interval that determines the trend.
Therefore, the important key is whether it can be supported by rising to the 0.616-0.819 section.
(1D chart)
If the price is maintained above the MS-Signal indicator, it is expected to turn into an uptrend in the short and medium term.
However, careful trading is required as it is expected to lead to an additional rise only when it rises above the 0.819-0.889 section.
------------------------------------------------------------ -----------------------------------------------------
** All indicators are lagging indicators.
Therefore, it is important to be aware that the indicator will move accordingly as price and volume move.
However, for convenience, we are talking in reverse for the interpretation of the indicator.
** The MRHAB-T indicator used in the chart is an indicator of our channel that has not been released yet.
** The OBV indicator was re-created by applying a formula to the DepthHouse Trading indicator, an indicator disclosed by oh92. (Thanks for this.)
** Support or resistance is based on the closing price of the 1D chart.
** All descriptions are for reference only and do not guarantee a profit or loss in investment.
(Short-term Stop Loss can be said to be a point where profit and loss can be preserved or additional entry can be made through split trading. It is a short-term investment perspective.)
---------------------------------

MATIC - Will become clear tomorrowMATIC at crossroads with support nearby but not deep enough to sustain a market dipping next.
What do i mean: if BTC drops tonight and crypto follows, MATIC can lose the 0.55 level.
Then again if the market decides to stay Bullish (or become Bullish) then we could see 0.80$ and 1.2$ next.
In any case, MATIC is an asset we like to Buy. The Fundamentals are great. Here is why: www.crypto-news-flash.com
One Love,
the FXPROFESSOR

MATIC (Polygon) Long-Term ForecastThe yellow dotted lines show major S/R lines. The plain yellow line shows where you should place your trailing S/L price.

MATIC Fighting the down sloping trendlineMatic has tested the breakout of the down sloping trendline for the past two weeks. If manage to break it followed by a retest has a good chance of going above $0.75

Matic bullish and bearish scenarios0.55 / 0.65
Seems like if it breaks above 0.65 matic could rally 50% or higher. If below 0.55 matic could slump about 20% or more. Seems like the bullish scenario is more likely. But ya never know. Could go either way.
