MATIC Potential Double BottomThe red line in my price vs whale money flow is the rsi, we still have some room left for the downside. I’m expecting us to bounce from that trendline @ $1.33. If that plays out, TP: $1.70 - $2.00
Polygon

MATIC/USDT Good Time to Accumulate for Huge Profit#MATIC/USDT TA update:-
$Matic still holding $1.40 support level.
Guys Honestly if hold this support then we can see $3 next Target and $5 also in the coming days.
A very important level is $1.10-$1.20
In simple IMO I will hold above $1
I am supper bullish above $1
And In near future we can see $MATIC price could be $10
Support:- $1-$1.20
Resistance:- $3/$5

MATIC/USDTMatic is one of the coins that can't stand very well in drops. If you have it, be careful. It is not financial advice.

Polygon MATIC Price Targets and Stop LossMATIC/USDT short
Entry Range: $1.56 - 1.59
Take Profit 1: $1.49
Take Profit 2: $1.36
Take Profit 3: $1.26
Stop Loss: $1.77

Matic Still Has potential to Touch 2$Matic is trading in a tight range since Mar27, but the rally is not faded yet, Technical are still pointing towards $2. Once it break above 1.70$ it will quickly visit the $2 area.

MATIC Facing Resistance$MATIC for the past 3 days has been struggling to break above it's current resistance(Area) while others alts have been breaking out. On the daily chart we have the 55 day ema attempting to flip the 200 day ema which would signal a change in trend to the upside considering BTC lets it. we already have the 10,20,55 day ema trading above the 200 on 1hr,2hr and current 4hr chart as we can see on the 4hr chart. What does this week hold for $Matic, a Breakout or a Rejection?

Polygon (MATIC) - April 4Hello?
Traders, welcome.
If you "follow", you can always get new information quickly.
Please also click "Like".
Have a good day.
-------------------------------------
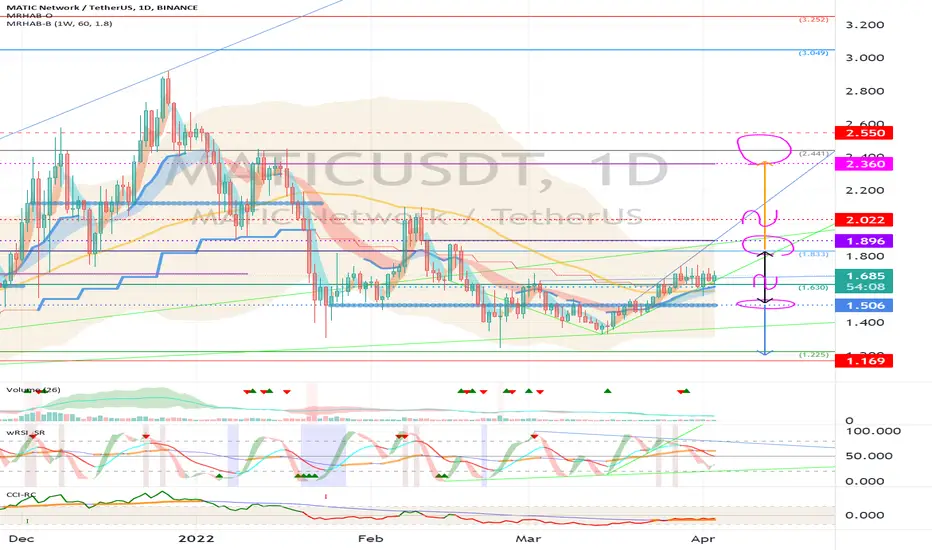
(MATICUSDT 1W Chart)
Primary resistance: around 2.441
Secondary resistance: 3.049-3.252
Support: around 1.225
It is necessary to confirm that it is supported and can rise in the 1.630-1.833 section.
(1D chart)
At points 1.896 and 2.360, the indicator is inverted.
Therefore, careful trading is necessary as there is a high probability of a shake up and down to convert the indicator.
(buy)
- After confirming the support around 1.630
- After confirming the support around 1.833
(Stop Loss)
- When it drops from 1.506 and receives resistance
(Sell)
- When receiving resistance in the range of 2.360-2.550
- When resistance is received in the section 3.049-3.252
------------------------------------------------------------ -----------------------------------------------------
** All indicators are lagging indicators.
Therefore, it is important to be aware that the indicator moves accordingly with the movement of price and volume.
However, for convenience, we are talking in reverse for the interpretation of the indicator.
** The MRHAB-O and MRHAB-B indicators used in the chart are indicators of our channel that have not been released yet.
(Since it was not disclosed, you can use this chart without any restrictions by sharing this chart and copying and pasting the indicators.)
** The wRSI_SR indicator is an indicator created by adding settings and options to the existing Stochastic RSI indicator.
Therefore, the interpretation is the same as the traditional Stochastic RSI indicator. (K, D line -> R, S line)
** The OBV indicator was re-created by applying a formula to the DepthHouse Trading indicator, an indicator disclosed by oh92. (Thanks for this.)
** Support or resistance is based on the closing price of the 1D chart.
** All descriptions are for reference only and do not guarantee a profit or loss in investment.
(Short-term Stop Loss can be said to be a point where profit and loss can be preserved or additional entry can be made through split trading. It is a short-term investment perspective.)
---------------------------------
Matic: Aim $1.89 at BreakoutWait for the breakout of the falling broadening wedge, and aim for $1.89.

MATIC (Polygon) Coin Analysis 01/04/2022Fundamental Analysis:
Polygon (previously Matic Network) is the first well-structured, easy-to-use platform for Ethereum scaling and infrastructure development. Its core component is Polygon SDK, a modular, flexible framework that supports building multiple types of applications.
Using Polygon, one can create optimistic rollup chains, ZK rollup chains, stand alone chains or any other kind of infra required by the developer.
Polygon effectively transforms Ethereum into a full-fledged multi-chain system (aka Internet of Blockchains). This multi-chain system is akin to other ones such as Polkadot, Cosmos, Avalanche etc. with the advantages of Ethereum’s security, vibrant ecosystem and openness.
The $MATIC token will continue to exist and will play an increasingly important role, securing the system and enabling governance.
Polygon (formerly Matic Network) is a Layer 2 scaling solution backed by Binance and Coinbase. The project seeks to stimulate mass adoption of cryptocurrencies by resolving the problems of scalability on many blockchains.
Polygon combines the Plasma Framework and the proof-of-stake blockchain architecture. The Plasma framework used by Polygon as proposed by the co-founder of Ethereum, Vitalik Buterin, allows for the easy execution of scalable and autonomous smart contracts.
Nothing will change for the existing ecosystem built on the Plasma-POS chain. With Polygon, new features are being built around the existing proven technology to expand the ability to cater to diverse needs from the developer ecosystem. Polygon will continue to develop the core technology so that it can scale to a larger ecosystem.
Polygon boasts of up to 65,000 transactions per second on a single side chain, along with a respectable block confirmation time of less than two seconds. The framework also allows for the creation of globally available decentralized financial applications on a single foundational blockchain.
The Plasma framework gives Polygon the potential of housing an unlimited number of decentralized applications on their infrastructure without experiencing the normal drawbacks common on proof-of-work blockchains. So far, Polygon has attracted more than 50 DApps to its PoS-secured Ethereum sidechain.
MATIC, the native tokens of Polygon, is an ERC-20 token running on the Ethereum blockchain. The tokens are used for payment services on Polygon and as a settlement currency between users who operate within the Polygon ecosystem. The transaction fees on Polygon sidechains are also paid in MATIC tokens.
Polygon is self-described as a Layer 2 scaling solution, which means that the project doesn’t seek to upgrade its current basic blockchain layer any time soon. The project focuses on reducing the complexity of scalability and instant blockchain transactions.
Polygon uses a customized version of the Plasma framework which is built on proof-of-stake checkpoints that run through the Ethereum main-chain. This unique technology allows each sidechain on Polygon to achieve up to 65,536 transactions per block.
Commercially, the sidechains of Polygon are structurally designed to support a variety of decentralized finance (DeFi) protocols available in the Ethereum ecosystem.
While Polygon currently supports only Ethereum basechain, the network intends to extend support for additional basechains, based on community suggestions and consensus. This would make Polygon an interoperable decentralized Layer 2 blockchain platform
Polygon (MATIC) London Hard Fork and EIP-1559 Upgrade
Polygon announced the much-anticipated London Hard Fork and Ethereum Improvement Proposal (EIP) 1559 upgrade will go live on the mainnet on Jan. 18, 2022. The upgrade will completely change the way the fee mechanism works on the Ethereum network — it eliminates first-price auction as the main fee calculation mechanism and instead uses a base fee that is burned, instead of sent to miners. Although it does not lower transaction fees, it makes it more stable, allowing users to estimate costs better and reduce overpayment.
However, as MATIC tokens are burned as base fees — and MATIC has a fixed supply of 10 billion tokens — it will have a deflationary effect on the digital asset. Polygon’s core team projected an annual burn of MATIC amounting to 0.27% of the token’s total supply — around 27 million tokens. This deflationary pressure will most likely benefit validators and delegators the most, as rewards for processing transactions on Polygon are denominated in MATIC. Furthermore, base fee will increase automatically once the block is filled up, resulting in fewer spam transactions and less network congestion. Ethereum mainnet’s London Hard Fork went live on Aug. 5, 2021.
As a Layer 2 solution utilizing a network of proof-of-stake validators for asset security, staking is an integral part of the Polygon ecosystem. Validators on the network will stake their MATIC tokens as collateral to become part of the network’s PoS consensus mechanism and will receive MATIC tokens in return.
Members of the network who do not wish to become validators can delegate their MATIC tokens to another validator, but will still take part in their staking process and earn staking rewards.
In addition to the proof-of-stake checkpointing, Polygon uses block producers at the block producer layer to achieve a higher degree of decentralization. These block producers give finality to the main chains using checkpoints and fraud-proof mechanisms.
Polygon (formerly Matic Network) was launched in October 2017. Polygon was co-founded by Jaynti Kanani, Sandeep Nailwal and Anurag Arjun, two experienced blockchain developers and a business consultant.
Before moving to its network in 2019, the Polygon team was a huge contributor in the Ethereum ecosystem. The team worked on implementing the Plasma MVP, the WalletConnect protocol and the widely-used Dagger event notification engine on Ethereum.
The team included co-founder of Polygon, Jaynti Kanani. Jaynti, a full-stack developer and blockchain engineer currently serves as the CEO of Polygon.
Jaynti played an integral role in implementing Web3, Plasma and the WalletConnect protocol on Ethereum. Prior to his blockchain involvement, Jaynti worked as a data scientist with Housing.com.
Co-founder and chief operations officer of Polygon, Sandeep Nailwal is a blockchain programmer and entrepreneur. Before jointly starting Polygon (formerly Matic), Sandeep had served as the CEO of Scopeweaver, and the chief technical officer of Welspun Group.
Anurag Arjun is the only non-programming co-founder of Polygon. As a product manager, he has had stints with IRIS Business, SNL Financial, Dexter Consultancy and Cognizant Technologies.
MATIC tokens are released on a monthly basis. MATIC currently has a circulating supply of 7.70B MATIC tokens and a max supply of 10,000,000,000 MATIC tokens.
At its initial private sale in 2017, 3.8 percent of MATIC’s max supply was issued. In the April 2019 launchpad sale, another 19 percent of the total supply was sold. The MATIC price was $0.00263 per token, and $5 million was generated.
The remaining MATIC tokens are distributed as follows:
Team tokens: 16 percent of the total supply.
Advisors tokens: 4 percent of the total supply.
Network Operations tokens: 12 percent of the total supply.
Foundation tokens: 21.86 percent of the total supply.
Ecosystem tokens: 23.33 percent of the total supply.
According to the release schedule, all the tokens will be released by December 2022.
The current CoinMarketCap ranking is #16, with a live market cap of $12,427,307,622 USD. It has a circulating supply of 7,701,069,511 MATIC coins and a max. supply of 10,000,000,000 MATIC coins.
We have already done the Analyzed MATIC Market Cap Technically:
Technical Analysis:
There exist a Hidden Bullish Divergence of Price Value and MACD which is the Sign of Bullish Trend Continuation and development of new Cycle with new ATH.
There are Total of 3 Targets defined by the Average Confluences of the Fibonacci Expansion and Fibonacci Trend Base Extension. these confluences Points can even be counted as the Major Pivot Points .
The 3 TP gets its confirmation as the Bullish trend Triggers the 2 TP followed by some value correction and Reaccumulations, on its Up Formation rally.
Currently the Total price Value is at 38.2% Fibonacci retracement level, it means, it has broken many resistance levels and had rechecked them backed and it has been Proved to be the support areas.
Probably we may not again see the 61.8% Fib or bellow...
Our Past Analysis on this Asset:
Initial Acquisition:
Reacquisition:

MATIC (Polygon) Coin {Market Cap} Analysis 01/04/2022Fundamental Analysis:
MATIC tokens are released on a monthly basis. MATIC currently has a circulating supply of 7,701,069,511 MATIC tokens and a max supply of 10,000,000,000 MATIC tokens.
At its initial private sale in 2017, 3.8 percent of MATIC’s max supply was issued. In the April 2019 launchpad sale, another 19 percent of the total supply was sold. The MATIC price was $0.00263 per token, and $5 million was generated.
The remaining MATIC tokens are distributed as follows:
Team tokens: 16 percent of the total supply.
Advisors tokens: 4 percent of the total supply.
Network Operations tokens: 12 percent of the total supply.
Foundation tokens: 21.86 percent of the total supply.
Ecosystem tokens: 23.33 percent of the total supply.
The current CoinMarketCap ranking is #16, with a live market cap of $12,427,307,622 USD. It has a circulating supply of 7,701,069,511 MATIC coins and a max. supply of 10,000,000,000 MATIC coins.
Technical Analysis:
There exist a Hidden Bullish Divergence of Price Value and MACD which is the Sign of Bullish Trend Continuation and development of new Cycle with new ATH.
There are Total of 3 Targets defined by the Average Confluences of the Fibonacci Expansion and Fibonacci Trend Base Extension. these confluences Points can even be counted as the Major Pivot Points.
The 3 TP gets its confirmation as the Bullish trend Triggers the 2 TP followed by some value correction and Reaccumulations, on its Up Formation rally.
Currently the Total Value is at 38.2% Fibonacci retracement level, it means, it has broken many resistance levels and had rechecked them backed and it has been Proved to be the support areas.
Probably we may not again see the 61.8% Fib or bellow...
50B $ is a fare target for this assets Market Capitalization.

MATIC Network (Polygon) Token Analysis 31/03/2021 Fundamentals:
Polygon (previously Matic Network) is the first well-structured, easy-to-use platform for Ethereum scaling and infrastructure development. Its core component is Polygon SDK, a modular, flexible framework that supports building multiple types of applications.
Using Polygon, one can create optimistic rollup chains, ZK rollup chains, stand alone chains or any other kind of infra required by the developer.
Polygon effectively transforms Ethereum into a full-fledged multi-chain system (aka Internet of Blockchains). This multi-chain system is akin to other ones such as Polkadot, Cosmos, Avalanche etc. with the advantages of Ethereum’s security, vibrant ecosystem and openness.
The $MATIC token will continue to exist and will play an increasingly important role, securing the system and enabling governance.
Polygon (formerly Matic Network) is a Layer 2 scaling solution backed by Binance and Coinbase. The project seeks to stimulate mass adoption of cryptocurrencies by resolving the problems of scalability on many blockchains.
Polygon combines the Plasma Framework and the proof-of-stake blockchain architecture. The Plasma framework used by Polygon as proposed by the co-founder of Ethereum, Vitalik Buterin, allows for the easy execution of scalable and autonomous smart contracts.
Nothing will change for the existing ecosystem built on the Plasma-POS chain. With Polygon, new features are being built around the existing proven technology to expand the ability to cater to diverse needs from the developer ecosystem. Polygon will continue to develop the core technology so that it can scale to a larger ecosystem.
Polygon boasts of up to 65,000 transactions per second on a single side chain, along with a respectable block confirmation time of less than two seconds. The framework also allows for the creation of globally available decentralized financial applications on a single foundational blockchain.
The Plasma framework gives Polygon the potential of housing an unlimited number of decentralized applications on their infrastructure without experiencing the normal drawbacks common on proof-of-work blockchains. So far, Polygon has attracted more than 50 DApps to its PoS-secured Ethereum sidechain.
MATIC, the native tokens of Polygon, is an ERC-20 token running on the Ethereum blockchain. The tokens are used for payment services on Polygon and as a settlement currency between users who operate within the Polygon ecosystem. The transaction fees on Polygon sidechains are also paid in MATIC tokens.
Polygon is self-described as a Layer 2 scaling solution, which means that the project doesn’t seek to upgrade its current basic blockchain layer any time soon. The project focuses on reducing the complexity of scalability and instant blockchain transactions.
Polygon uses a customized version of the Plasma framework which is built on proof-of-stake checkpoints that run through the Ethereum main-chain. This unique technology allows each sidechain on Polygon to achieve up to 65,536 transactions per block.
Commercially, the sidechains of Polygon are structurally designed to support a variety of decentralized finance (DeFi) protocols available in the Ethereum ecosystem.
While Polygon currently supports only Ethereum basechain, the network intends to extend support for additional basechains, based on community suggestions and consensus. This would makePolygon an interoperable
As a Layer 2 solution utilizing a network of proof-of-stake validators for asset security, staking is an integral part of the Polygon ecosystem. Validators on the network will stake their MATIC tokens as collateral to become part of the network’s PoS consensus mechanism and will receive MATIC tokens in return.
Members of the network who do not wish to become validators can delegate their MATIC tokens to another validator, but will still take part in their staking process and earn staking rewards.
In addition to the proof-of-stake checkpointing, Polygon uses block producers at the block producer layer to achieve a higher degree of decentralization. These block producers give finality to the main chains using
MATIC tokens are released on a monthly basis. MATIC currently has a circulating supply of 4,877,830,774 MATIC tokens and a max supply of 10,000,000,000 MATIC tokens.
At its initial private sale in 2017, 3.8 percent of MATIC’s max supply was issued. In the April 2019 launchpad sale, another 19 percent of the total supply was sold at $0.00263 per token to generate $5 million.
The remaining MATIC tokens are distributed as follows:
Team tokens: 16 percent of the total supply.
Advisors tokens: 4 percent of the total supply.
Network Operations tokens: 12 percent of the total supply.
Foundation tokens: 21.86 percent of the total supply.
Ecosystem tokens: 23.33 percent of the total supply.
According to the release schedule, all the tokens will be released by December 2022.
Polygon (formerly Matic Network) was launched in October 2017. Polygon was co-founded by Jaynti Kanani, Sandeep Nailwal and Anurag Arjun, two experienced blockchain developers and a business consultant.
Before moving to its network in 2019, the Polygon team was a huge contributor in the Ethereum ecosystem. The team worked on implementing the Plasma MVP, the WalletConnect protocol and the widely-used Dagger event notification engine on Ethereum.
The team included co-founder of Polygon, Jaynti Kanani. Jaynti, a full-stack developer and blockchain engineer currently serves as the CEO of Polygon.
Jaynti played an integral role in implementing Web3, Plasma and the WalletConnect protocol on Ethereum. Prior to his blockchain involvement, Jaynti worked as a data scientist with Housing.com.
Co-founder and chief operations officer of Polygon, Sandeep Nailwal is a blockchain programmer and entrepreneur. Before jointly starting Polygon (formerly Matic), Sandeep had served as the CEO of Scopeweaver, and the chief technical officer of Welspun Group.
Anurag Arjun is the only non-programming co-founder of Polygon. As a product manager, he has had stints with IRIS Business, SNL Financial, Dexter Consultancy and Cognizant Technologies.
Technical Analysis:
the price is in the retracement phase and soon will start its impulsive wave,
there are total of 2 Targets defined by the Fibonacci expansion of the previews Bullish wave,
the 1 TP is 127%
the 2 TP is 161.8%

MATIC, large CHANNEL breakout! But where to open LONG?Polygon (MATIC) is in a large growing channel. As the global trend is still ascending, we expect further price growth! Where should we take long positions?
Be careful when price touching the lower boundary of the channel. This is where the BIG players like to collect liquidity (fool the traders and collect their stops). There should definitely be an increase in volumes - a sign of a big player! After that, it is safest point to open LONG positions.
If Bitcoin continues to rise, MATIC will quickly reach the upper boundary of the channel!
Friends, press the "like" button and share with your friends - it will be the best THANK YOU.
P.S. Personally, I open an entry if the price shows it according to my strategy.
Always do your analysis before making a trade.

Matic ; Falling wedge patternOn 16 March, MATIC’s price squeeze ended as it broke out of the falling wedge, forecasting a 36% ascent to $1.95. Making this breakout interesting and adding a tailwind is the daily demand zone, extending from $1.15 to $1.36. Since the breakout, the crypto has rallied by 28% and at press time, was hovering above the $1.60-support level.
Going forward, MATIC’s price could undergo a minor retracement that retests the $1.64 barrier before embarking on its uptrend. The bulls are likely to retest the target at $1.95, but in some cases, the rally might extend to the $2-psychological level. Such a move would push the total gains from 36% to 48%.

POLYGON 2 waysPolygon is the right choice with a bright future as an investment asset. The movement is normal.

Game over for MATIC.Such a great run MATIC has had. Time to cool down.
Please note that this is a weekly chart. Don't expect the price to start moving right after you buy or sell.
The result of this projection will be seen between 8 to 16 weeks. Be patient.
Happy Thursday!
Rio.

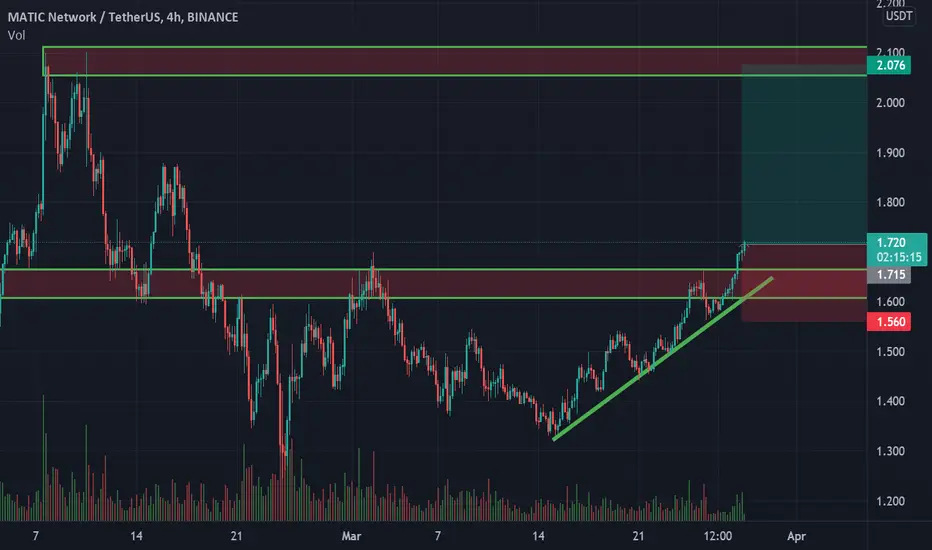
MATIC long$MATIC broke through the resistance level. Bullish movement is expected to continue up to 2.07$
MATIC LongHey traders, in today's trading session we are monitoring MATIC for a buying opportunity around 1.6 zone, once we will receive any bullish confirmation the trade will be executed.
Trade safe, Joe.

Matic break out Hi everyone ; matic success break out resistent trend line pattern but we waiting to watch confirm it and then send it to $2

Polygon (MATIC) Buy ZonePolygon (MATIC) Buy Zone
--------------------
BIAS
Long-Term : Bullish
Risk : Medium
As long as we remain this entry zone, we can expect further bullish momentum to build up over the next couple of days and eventually lead to a short-term break above $1.545 zone and higher.
--------------------
$MATIC/USDT LONG SETUP
Leverage : x3 - x5
Entry Price : 1.425 - 1.51
TP 1 : 1.545
TP 2 : 1.575
TP 3 : 1.6
TP 4 : 1.66
TP 5 : 1.715
TP 6 : 1.788
TP 7 : 1.84
TP 8 : 1.89
Stop Loss : 1.325
*Maximum 3% of Portfolio.
*Unload 12.5% at each TP. Whenever TP 2 hits, Move stop loss to entry.
--------------------

MATIC short$MATIC is bouncing off the local resistance level. Decline to support level at 1.4 $ is likely to happen.

MATICUSDT - Falling Wedge PatternMATICUSDT (1D Chart) Technical analysis
MATICUSDT (1D Chart) Currently trading at $1.49
Buy level: Above $1.52
Stop loss: Below $1.30
Target 1: $1.67
Target 2: $1.93
Target 3: $2.4
Target 4: $2.89
Max Leverage 2x
Always keep Stop loss
Follow Our Tradingview Account for More Technical Analysis Updates, | Like, Share and Comment Your thoughts

Update: Simple chart for Polygon (MATIC) - keep an eye on $1.36Update: Simple chart for Polygon (MATIC) - keep an eye on $1.36
Huge volume support that better not be broken and confirmed to the downside.
What do you think? 😎
Drop me a nice comment if you'd like me to analyze any other cryptocurrency.
*not financial advice
do your own research before investing

MATIC ABOUT TO EXPLODE?In this chart we can see that matic is coming to a point where its either going to make a leap to the sky or to the ground. In my view it can potentially go to 1.9 area (bull scenario) or 1 dollar area (bear scenario). It might be intresting to watch matic the coming days to get a good buying oppertunity.
