MATIC/USDT A fantastic opportunity LONG trade!BINANCE:MATICUSDT The weekly chart has recently breached a significant resistance level, with the price now trading above it. This sets the stage for a promising long trade, with a potential target price ranging between USD 4 to 5.
#MATIC/USDT SPOT LONG ENTRY
Leverage: 1x
Entries: $1.1668
Take profit 1: $1.5055
Take profit 2: $2.5197
Take profit 3: $5.0244
Stop Loss: $0.7197
NOTE: This is just my prediction. Be sure to use STOPLOSS and remember that I am not a financial adviser. your money, your risk!
Thanks
The sroced.
Polygon

#MATIC #MATICUSD #MATICUSDT #Polygon #Short #ShortSetup #Eddy#MATIC #MATICUSD #MATICUSDT #Polygon #Final #Update 'C' #Short #ShortSetup #Eddy
I'll Think Its Time to short Crypto ;-)
It's My New short setup on Polygon Matic <3
We are in the heavy supply order block range of the daily time frame, which is in the heart of the order block of the weekly time frame!
You also enter into sales short positions after checking the multi-time frame and getting the necessary approvals & at your own risk.
Related Analysis of Polygon Matic : (( MATIC/USDT )) : Check Link :
Polygon Matic Short Setup in #Update 'B' : (( MATIC/USDT )) : Check Link :
(( We got 19% profit in update 'B' ))

MATIC - Don't Miss the PARABOLIC ALTSEASON coming📉Hi Traders, Investors and Speculators of Charts📈
We're all looking for solid projects that have good fundamentals... and good upside. MATIC is one of those altcoins that haven't yet made a new ATH. Infact, it's not even close to its previous ATH with 190%+upside potential!
From a technical indicator perspective, we see a reliable "BUY" signal in the weekly timeframe:
From here, I expect altcoins to start making their rallies. Find more info on alt season 2024 here:
And if you need a little bit more technical info on how the rotation between BTC and altcoins work, check out this idea:
Cheers to another profitable day in crypto 🥳 And remember to realize gains🥂
_______________________
📢Follow us here on TradingView for daily updates📢
👍Hit like & Follow 👍
CryptoCheck
BINANCE:MATICUSDT

MATIC/USDT planning upward journey what's in your mind?💎 Paradisers, get set for a promising opportunity with #MATICUSDT as it faces a setback from the supply zone, suggesting a strong chance for a bullish rebound from the demand level.
💎 Historically, we've seen supply transform into demand, propelling the price upward. Currently, #Matic surpassing robust supply zone $1.0535 a strong chance for a bullish pivot from the current demand level. The asset's robust position above the ema55 is signaling a potential uptick.
💎 On the flip side, should the $POLYGON dip below the $1.0535 demand level, we could see a shift towards a bearish trend it time to revise strategy a bullish rebound expected from lower demand $0.8318 droping below casue donward.

Riding the Fibonacci Wave: A Strategic Approach to Price PolygonTitle: Riding the Fibonacci Wave: A Strategic Approach to Price Targets
Introduction:
In the dynamic world of financial markets, traders are constantly seeking reliable tools to forecast price movements and identify potential reversal points. Fibonacci retracement levels have emerged as a popular and versatile technical analysis tool, providing traders with a systematic approach to understanding market trends. When applied judiciously, Fibonacci retracements can offer valuable insights into potential price targets, enabling traders to navigate the markets with increased precision.
The Ascent: Riding the Fibs Upward:
As an asset experiences an upward trend, savvy traders often turn to Fibonacci retracement levels to gauge potential resistance and project future price targets. By applying the Fibonacci retracement tool from the swing low to the swing high, traders can identify key levels where the asset may encounter resistance during its ascent. The retracement levels, such as 38.2%, 50%, and 61.8%, act as potential support zones, offering strategic entry points for those looking to ride the upward momentum. As the asset climbs, traders closely monitor these Fibonacci levels, adjusting their positions and leveraging the insights provided by the Fibonacci retracements to optimize their risk-reward ratios.
The Descent: Navigating the Retreat:
However, markets are inherently volatile, and trends rarely move in a straight line. Understanding the potential retracement levels during a pullback is equally crucial for traders seeking to maximize profits and minimize risks. As the asset retraces from its peak, traders can utilize Fibonacci retracement levels from the recent swing low to the swing high to identify potential support zones. These levels, including 38.2%, 50%, and 61.8%, serve as crucial areas where the asset may find support before resuming its upward trajectory. Traders employ a disciplined approach, combining Fibonacci retracements with other technical indicators, to validate potential reversal points and make informed decisions as the market retreats.
Hitting Targets: Precision in Profit-Taking:
Successfully navigating both the upward and downward movements using Fibonacci retracements allows traders to set precise profit targets. By strategically placing take-profit orders near key Fibonacci levels, traders aim to capitalize on market movements with a calculated approach. This method provides a structured framework for profit-taking, allowing traders to secure gains as the asset hits predefined Fibonacci targets. In this way, the combination of riding the Fibonacci wave upward, navigating the retracement, and hitting profit targets offers traders a comprehensive strategy to enhance their trading success in the dynamic world of financial markets.

MATIC - Skys the limit!Breaking out on the weekly, sitting and holding long term uptrend line.
When matic moves it moves hard and fast like a torpedo.
With ZK going live properly soon, strong team and great bear market survival I am happy to hodl this position.
Unless BTC keeps ripping and pulls more liquidity, or crashes and brings everything down

MATIC (Y24.P1.Video1).Finding levels of impportanceHi Traders,
This one is good for those who want to find levels of importance which is our groundwork prior to trading the levels using SFP's or Failed Auctions.
On the macro perspective, we use other strategies that is not covered here but again, these levels played the role for decisions.
We used 3rd party tools as well and maybe there are scripts here on Tradingview that also do the same. I know there is some but how well they do it, I have not checked.
Moving forward, if you want to ask questions about this approach, I will point you in the right direction.
All the best,
S.SAri
Current resistance, VAH
completed


Matic Long Term SetupHello everyone (whoever follows or aware that I exist),
I believe Matic will claim 1.34 in a month. We can expect a small correction from around there and then the last impulse move will occur.
All targets specified.
Good luck to us all.

MATIC - Bullish Flash on THIS Indicator 📢📉Hi Traders, Investors and Speculators of Charts📈
If you've been following, you'll know I'm fundamentally bullish on MATIC. And it gets better than fundamentals - we just saw a bullish "BUY" signal flash on the weekly from a powerful indicator!
Polygon is unique in that it's a blockchain platform designed to work with another blockchain platform. It improves Ethereum's scalability - which we all know if the biggest problem of ETH. ETH dApps can use Polygon's sidechains, thereby making it a functional and fundamentally great choice as an altcoin asset.
One of the exciting things about Polygon is the partnerships it has established. Many big brands are working with Polygon to launch their NFT projects. Current partners include:
✅ Walt Disney
✅ Starbucks
✅ Meta Platforms
✅ Nike
✅ Mercedes
✅ Google
✅ Adidas
✅ Adobe
✅ Mastercard
✅ Reddit
While it might not pump as hard as other altcoins, it's also far less likely to fail than smaller , newer cryptos with similar aims - and it still has plenty of room to grow. Its partnerships make it an interesting buy for those who are interested in a well diversified portfolio, containing assets with real-world use case and strong fundamentals.
A possible scenario like this seems possible IF we can maintain closing daily candles ABOVE the diagonal trendline (support):
A drop and CLOSE UNDER this zone invalidates short term bullish sentiment:
If you found this content helpful, please remember to hit like and subscribe and never miss a moment in the markets.
_______________________
📢Follow us here on TradingView for daily updates📢
👍Hit like & Follow 👍
CryptoCheck
BINANCE:MATICUSDT

Matic is forming a Harmonic Pattern.Polygon (Matic) is trying to form a harmonic pattern known as "three drives pattern" .
You can trade it by opening a long position first. Then set a %2 stop loss and short it.
For target points, check the chart please.

MATIC Polygon Price TargetIf you haven`t sold MATIC when Robinhood delisted it:
With the stock market reaching record highs, there is growing optimism that the positive momentum could spill over into the crypto market.
Historically, we've seen a correlation between bullish sentiments in traditional markets and increased interest and investment in cryptocurrencies.
As traditional investors seek diversification and alternative assets, the crypto market, with its potential for high returns, could benefit from this wave of enthusiasm.
This alignment with the prevailing positive trends in the stock market might act as a catalyst, fostering a bullish outlook for the crypto market in the coming days.
My Price Target for MATIC is the next resistance, $0.92.

MATICUSDT - Bull Target IdeasUsing trend lines across important areas of MATICS chart development
Using these we can plot a large bull move with two potential profit targets a more extreme one at $17 and a lesser one at $3.
I believe we are on the cusp of seeing a large bull run so pick your targets.

MATIC/USDT Nearing a Crucial Resistance Eyes on the Next Step?💎 Paradisers, get ready for an exciting development with MATICUSDT as it edges closer to a pivotal resistance, hinting at potential upcoming actions.
💎 Observing POLYGON recent patterns, we've noticed a recurring price action. Currently, it's mirroring past behaviors, and if it honors the resistance at $0.9584, we might see a retreat to the support level of $0.7216.
💎 Should the price hit the support at $0.7216, there's a strong chance for a significant bullish push towards the formidable resistance at $1.0970. However, a loss of steam at $0.7216 could trigger a bullish recovery from the deeper support at $0.6594.

Long Matic to $1+For my final long (sorry tradingview followers as I have only had the time to post a few of my trades here but you know where to find the rest), I chose Matic. Nice little cup and handle. Above VRVP POC and above all SMAs. Entry was .86. Final target is 1.03 with profit taking at .94 along the way. SL is .80 with a rrr of 3.5 to 1.

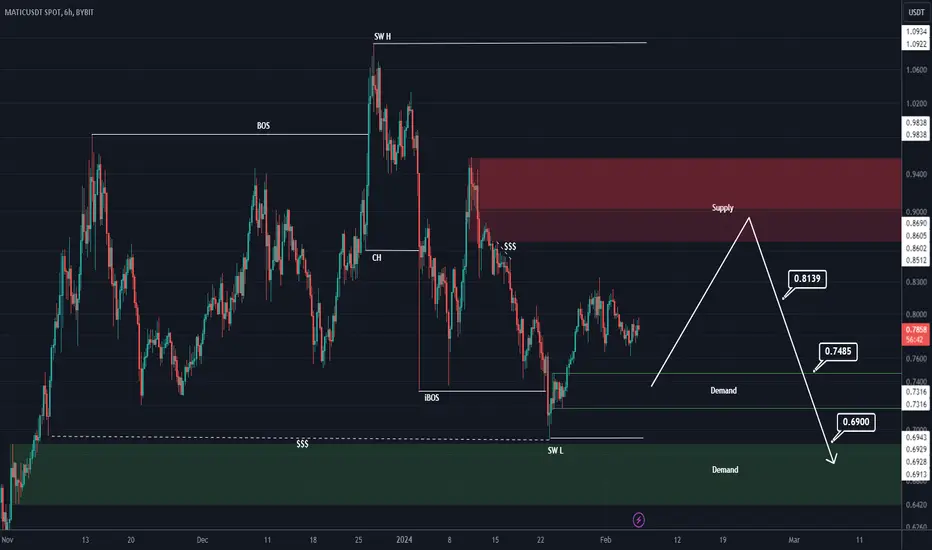
Matic analysis (4H)We have an important supply on the MATIC chart that may cause a drop or change the trend.
We have the change of structure with bearish CH on the chart and we also have supplies that have been mitigated and have moved sell orders to lower ranges with lower H and L.
In case of rejection from Supply, we have specified the targets and
For risk management, please don't forget stop loss and capital management
Comment if you have any questions
Thank You
MATIC/USDT Could MATIC back to break resist or back to demand ?💎 MATIC has recently experienced significant developments in the market. Currently, MATIC has displayed strength by bouncing from the demand area, which previously acted as a supply zone. Moreover, it has successfully broken out of a descending channel pattern.
💎 If this breakout is valid, there is potential for MATIC to continue its upward trajectory and attempt to break through the resistance area. Breaking this resistance is essential because a successful breakout, probability could pave the way for MATIC to reach our target at the Bearish OB area.
💎 However, if MATIC fails to sustain its upward momentum and experiences a false breakout, there is the possibility that the price will retreat to the demand area to establish a new bullish momentum.
💎 The demand area holds significant importance, as a breakdown from this level could signal a return to bearish sentiment, potentially driving the price back towards the strong support area.

Polygon Chart Analysis: Daily and 4-Hour PerspectiveWe're eyeing a particularly interesting chart: Polygon BINANCE:MATICUSD . On the daily chart, we're observing a very discernible cycle. While we've certainly seen very impulsive upward and downward movements in our last bull market, we've been convinced since the summer of 2022 that we completed a downward correction and have since developed a Wave (1) and (2) with an overshooting B, now finding ourselves in the overarching Wave (3). This should, at a minimum of $2.
🔎 Zooming into the 4-hour chart, we've hit our 50% retracement limit order for the subordinate Wave 2 at $0.74, witnessing a very nice correction to this limit order. On closer inspection, we have an Expanded Flat with Wave B at 138%, which is the maximum for an overshooting Wave B. Thus, this scenario seems to be accurate.
📉 However, there's always a chance that we might dip again, possibly retesting the 50% or even the 61.8% levels. Yet, we should ideally not drop below our 78.6% mark, which is our $0.60 level. Falling below this would make it highly unlikely that we're still dealing with a Wave 2, and should we fall under the 78.6%, we must consider the possibility of a decline to the origin point X, $0.49.

0.90 to 1.10 MATICAnalyzing the current market trends and technical indicators, my projection for #MATIC in the upcoming 2024 bull market is a price range between $0.90 and $1.10 USD.
This valuation is based on several key factors, including historical data, recent market performance, and the overall growth trajectory of the cryptocurrency sector. #MATIC's fundamentals, coupled with increasing adoption and technological advancements, suggest a strong potential for this price range to be achieved.
As always, it's crucial to monitor market dynamics closely, as cryptocurrencies can be volatile and subject to various external influences. This forecast considers both the potential market highs and the resilience of #MATIC in sustaining its value in a fluctuating market.

MATICUSDT - Symmetrical TrianglesTwo symmetrical triangles the first leading to a large breakout of around 16000%. Will we see anything comparable in the future

Polygon (Matic): Coin, Target and Buy Zone Review!Hi all!
♾ Polygon was previously called Matic Network. Polygon (MATIC) is an Ethereum token that powers the Polygon network, which is used to scale Ethereum. Polygon's goal is to enable faster and cheaper transactions on Ethereum using Layer 2 sidechains, i.e. blockchains that run parallel to the main Ethereum blockchain.
✅Official website polygon.technology
Now let's move on to the charts on the main timeframes
M
➩ Globally, the price is in a downward movement as the monthly structure was broken and confirmed in 2022
➩ Now there is a corrective movement towards a wave of decline, which has lasted for almost two years.
➩ Below there is an unfilled IMB M ($0.0483 - $0.1829) and equal minimums on the way to it.
➩ Currently the price is testing IMB M ($0.6651 - $0.7505)
W
➩ On the weekly time frame, after reacting to OB W and filling IMB W, the price began to correct to the growth wave.
➩ Below in the form of support IMB W ($0.6651 - 0.6892 $) and the zone of combined OB W + IMB W ($0.5006 - 0.5994 $)
D
➩ On the daily timeframe, the price is still in an ascending structure, but, judging by the protracted correction, it will be broken.
➩ There is also an accumulation of a large pool of liquidity below, which can attract the price
💭On the chart I noted two options for reducing the price to potential areas for purchases
❗️Not a financial recommendation; before entering into any transaction, conduct your own analysis of the asset

MATIC/USDT 4H analysis DUMP incomingMATIC is one of the most popular coins and is in consolidation phase, it will soon dump from 0.94 or dump after going towards 1.02. And might plummets up to 0.62 range

3- entry (MATIC)📊Analysis by AhmadArz:
safe in chart risk by 3-entry.
🔗"Uncover new opportunities in the world of cryptocurrencies with AhmadArz.
💡Join us on TradingView and expand your investment knowledge with our five years of experience in financial markets."
🚀Please boost and💬 comment to share your thoughts with us!
