Ascending PositionMATIC, positioned at the top of the Fibonacci 0 zone, indicates a potentially strong base for growth, particularly if Bitcoin's price rises.
This correlation with Bitcoin's movement implies that a positive trend in Bitcoin could significantly benefit MATIC.
This analysis is for informational purposes only and should not be considered as financial advice.
Polygon

Uptrend turning point : 0.9483Hello traders!
If you "Follow" us, you can always get new information quickly.
Please also click “Boost”.
Have a good day.
-------------------------------------
(MATICUSDT chart)
(1M charts)
Since it has not yet risen above the MS-Signal indicator, it is difficult to say that it has turned into an upward trend.
Accordingly, the key is whether it can rise above 0.9279.
(1W chart)
The key is whether the price can be maintained above 0.7529 and rise above 0.9391.
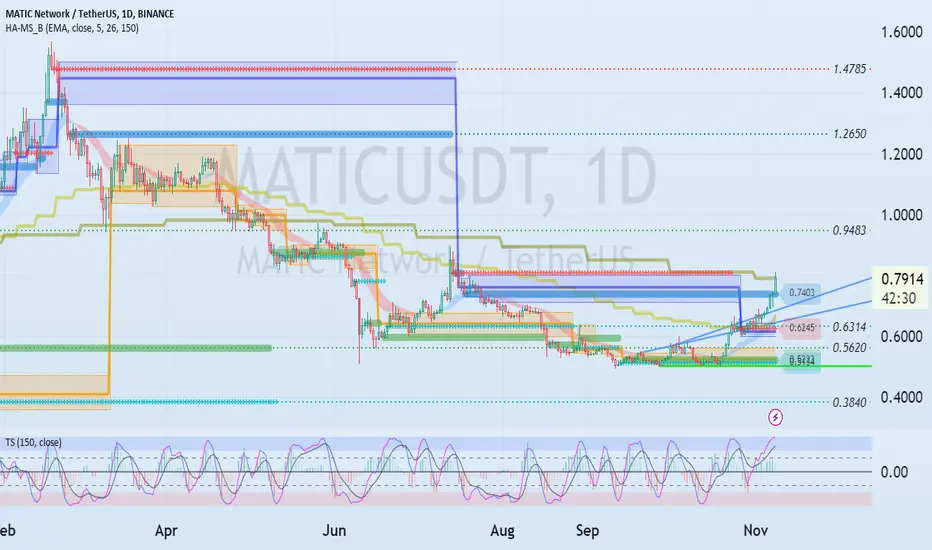
(1D chart)
Looking at the overall picture, I think the range from 0.3840-0.5620 to 0.9483 is an important support and resistance range.
Accordingly, the direction in which one deviates from this section is important.
This is the current 1M chart's M-Signal indicator touched.
Therefore, the key is whether it can rise above the M-Signal indicator on the 1M chart and rise above 0.9483.
If this is not the case and it falls below 0.7403, there is a possibility that it may fall to around 0.6314, so you need to think about a response plan.
If the price rises above 0.9483 and holds, it is expected to turn into an upward trend.
--------------------------------------------------
- The big picture
The full-fledged upward trend is expected to begin when the price rises above 29K.
This is the section expected to be touched in the next bull market, 81K-95K.
-------------------------------------------------- -------------------------------------------
** All explanations are for reference only and do not guarantee profit or loss in investment.
** Trading volume is displayed as a candle body based on 10EMA.
How to display (in order from darkest to darkest)
More than 3 times the trading volume of 10EMA > 2.5 times > 2.0 times > 1.25 times > Trading volume below 10EMA
** Even if you know other people’s know-how, it takes a considerable amount of time to make it your own.
** This chart was created using my know-how.
---------------------------------

MATIC Set for Major Price Move as Whale Activity SpikesAfter an impressive run in November 2023, the price of MATIC, the native token of the Polygon PoS chain, has been largely muted, hovering just below the psychological resistance level of $0.80. But the asset’s recent lackluster price movement might be at an end. Amid the doldrums, recent whale activity suggests that MATIC might be ready to make its move.
Can MATIC make another dash at $1, or are new lows in store?

NUBANK NU Problem! Possible parallel channel break out.
- 1.618 Fib Ext & Channel target is $8.51 to $9.13
- Plucked positions at green circles for long term hold
- RSI continues to rise
- Above 200 day SMA (same as 40 week SMA)
- Failure to break above (which is very possible) will only lead me to make
another allocation on RSI trend line retest.
NUBANK Fundamentals look exciting
- Milestone of 80 million customers 2 weeks ago
- Brazil-based Nubank partnered Polygon to expand the reach of its Nucoin loyalty programme to its 80 million customers.
- In October 2022, the Nubank/Polygon announced the Nucoin token and launched a pilot run involving around 2000 users. Nucoin was designed to recognize customer loyalty and encourage engagement with Nubank products,
and by expanding the programme, the token could reach as many as 70 million customers across Brazil.
- David Marcus former Paypal CEO and former head of payments & crypto at META has been added to the NUBANK Board
- Nubank secured a loan of up to USD 150 million from the International Finance Corp in January 2023 in order to expand its operations in Colombia
- Nubank has a division in Colombia named Nu Colombia, which is a fast-growing credit card issuer. In August 2022, Nu Colombia made the announcement that the country's regulator had granted its proposal to form a financial
firm. This licence allowed Nu to add a full savings account linked to other credit products to its lineup of credit cards and e-wallets, as well as acquire deposits, a less expensive financing source similar to that used by large
banks.
- Approximately 35 percent of the Colombian adult population has no access to any formal financial services and are considered “unbanked,” according to the Colombian Banking Association. Some 79 percent of adults have no
access to credit cards. There is a HUGE market here for long term growth.
- Last 4 earnings reports have had surprised to the upside.
- Next earnings report is 15th May 2023 (key date for break of channel or rejection)
- We all know Warren Buffet holds a long position in Nubank.

Matic short ⏰ period analysis 📌Completely ⚡ short period analysis based on Trend support and supply and demand
With movement shift // pls #DYOR
👉 I am expecting COINBASE:MATICUSD shifted 🙄 it's movement bullish side 😛 in day frame LL >> HL
Use 1% position size of ur liquid 💰
Leverage must be below 4X cross 🤞
⏰ expecting 30-50 day's below later invalid 📌
🔥Buy :: $0.5 - $0.54 < split liquid 💰 60% - 40% >
🎯 :: $0.6238 - $0.6475 < move stop lose to entry or profit >
🎯 :: $0.7280 - $0.7575 < 💯% exit >
Stop 🚏 lose < #SL > ::- $0.4804

The Crypto Bull Run has Begun: SOL to 20xLONG TERM CRYPTO VIEW
The crypto bull run has begun and with the BTC halving coming in 2024, it's just a matter of time before BTC hits new highs and altcoins follow.
BTC is, of course, the bellwether of the crypto market but it is not my biggest position. I am heavily weighted to Solana as I believe it will act how Ethereum did in the previous 2021 peak cycle. Solana is a similar "platform-type" cryptocurrency like ETH that allows for applications to be built upon it, but the network is far superior. Transaction fees are lower, speed is higher, and I believe SOL has the scalability to compete with ETH in the long run. I am not suggesting SOL will overtake ETH's market cap any time soon because ETH will rise in a bull run too. ETH's market cap is about 10.6x that of SOL. If my predictions for the bull run peaks are accurate, this will decline to about 3.75x as SOL outperforms ETH by 3x in the coming cycle.
The charts here are a logarithmic analysis and if I'm correct about Sol being the ETH of this cycle, we should see a $1200 peak, give or take. $600 minimum and up to $2500 wouldn't surprise me. Crypto can surpass even your wildest expectations.
In the short term, I expect a BTC consolidation and maybe a local top when ETF approval hits.
Best of luck out there.

MATIC/USDT Anticipating a Breakthrough Above Resistance? 👀 🚀 💎 Paradisers, focus on #MATICUSDT as it's showcasing a promising market behavior. Following a rejection at resistance, it is now regaining strength in a demand zone, preparing for another shot at breaking through the resistance, with a bullish move highly anticipated post-breakout.
💎 Reflecting on #MATIC past performance, it has shown a consistent pattern of following a descending trendline before breaking above to initiate an upward trend. Currently, it is maintaining strong momentum, signaling an equal low trajectory and gearing up for a potentially robust bullish move. If this upward momentum is sustained, #MATIC could be eyeing higher resistance levels at $.9819 and $1.2425.
💎 However, in the dynamic and often unpredictable world of cryptocurrency trading, #Polygon traders must stay prepared for various scenarios. If the present breakout effort doesn’t gain the expected traction, a prudent fallback strategy would involve preparing for a bullish recovery from the demand level of $0.7722. 🌴💰

MATICUSDT Idea - MATIC NETWORKGreetings, traders,
There exists potential for an upward movement within the following price ranges:
1. $0.8600
2. $0.8850
3. $0.9000
This is contingent upon successfully breaking the resistance line at $0.8180.
It's crucial to emphasize that the validity of the resistance break is confirmed with the acknowledgment of breaking the resistance line.
Best of luck in your trading endeavors.
BINANCE:MATICUSDT COINBASE:MATICUSD
⚠️ Disclaimer: The viewpoints shared represent my individual outlook on the market, based on publicly accessible information and historical data. While a portion of these opinions is influenced by my actual trades, others are not. It's important to note that I am not a financial advisor, and I do not assume any responsibility for the decisions you make in your trading activities.
✅ Feel free to share your inquiries or suggestions in the comments. I am more than willing to assess and analyze any cryptocurrency, forex currency pair, or stock index that piques your interest, so, Please don't hesitate to ask or mention the specific currency chart you'd like me to review.

#QUICK #quickswap is extremely undervaluedThis important DEX has not played it' s move yet... Technicals are showing a great potential to make an unforgettable pump, especially on #binance derivatives.
NOT FINANCIAL ADVICE.

MATIC keep bouncing off 78.6 FIB, preppin for UPSIDE.MATIC, keeps touching the 78.6 FIB level -- and it keeps being rejected to the upside. This convey a strong order block support at this range.
Expect matic to go horizontal for a bit before a significant price change to the upside. The squeeze to the upside is imminent.
Spotted at 0.98
TAYOR.
MATIC/USDT Navigating the Bullish Wave? 👀🚀MATIC Today Analysis💎 Paradisers, set your sights on #MATICUSDT, as it weaves an intriguing narrative in the crypto arena. Grasping a pivotal support level, MATIC teases us with the high prospects of an upward ballet.
💎 Let's rewind a bit recently, #MATIC has shown us its flair for breaking resistances and gracefully leaping upwards. But after a slight stumble at the resistance of $.9811, it's back in the game, retesting what was once a barrier but now serves as a springboard a transformed support.
💎This dance above the support line is not just movement; it's a crescendo building up to a potential leap. #MATIC, with the poise of a seasoned performer, is eyeing the resistance once again at $.9811, and who knows, it might just pirouette to the lofty target of $1.1868.
💎But Paradisers, the market is an unpredictable stage. Should #MATIC falter in its upward choreography and dip below this critical demand, #POLYGON enthusiasts must brace for a different rhythm. A fallback plan? A potential bullish resurgence from the wings at the support level of $.7244. However, a dip below this mark might dim the spotlight on the bullish trend. 🌴💰

#POLYGON #MATIC Long-Term targets, until end of 2025#POLYGON #MATIC Long-Term targets, until end of 2025
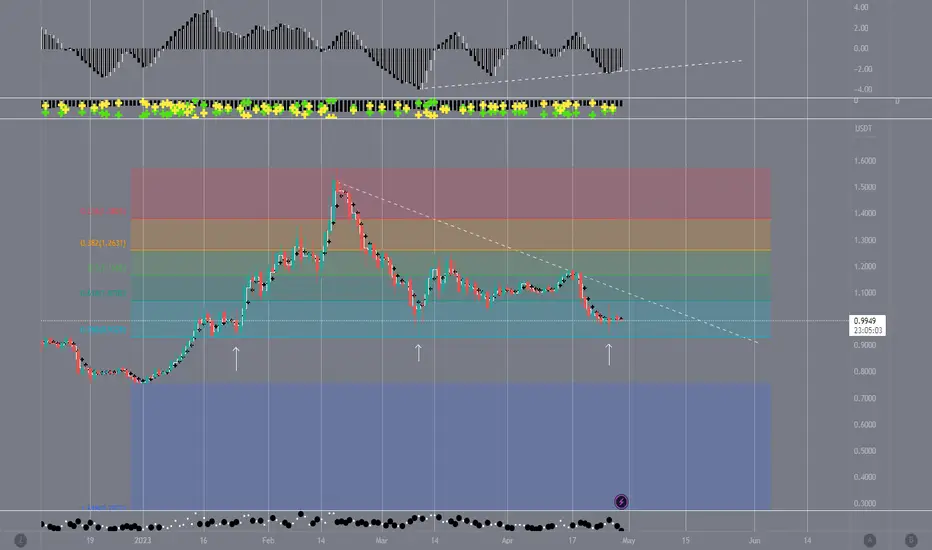
According to Elliott's wave count indicated on the chart, the rise from 2020 to 2021 took place during a five-wave, where either wave 1 is bigger than a five-wave or wave A is bigger than a three-wave.
Considering the possibilities ahead, we can estimate the possible goals of Link until the end of 2025 as follows:
TARGET1: 8$
TARGET2: 24$
TARGTE3: 48$
TARGET4: 145$
ENTRY: 0.85-0.60$
STOPLOSS: 0.50$

MATIC: Pullback in UptrendPolygon (MATIC) technical analysis:
Trade setup : Following a bullish breakout from Sideways Channel ($0.50-$0.60), price broke above 200-day moving average, which confirmed a bullish trend reversal to Uptrend. Price reached our target of $1.00 resistance where it got rejected and pulled back. How far could it pull back? The nearest horizontal support area is $0.75, which also lines up with a 50% Fibonacci retracement level and could be an attractive swing trade entry in Uptrend, with upside potential back to $1.00. The next support area after that is at $0.69, which is a 200-day MA level and also a 61.80% Fibonacci retracement level.
Trend : Neutral on Short-Term basis and Uptrend on Medium- and Long-Term basis.
Momentum is Mixed as MACD Line is below MACD Signal Line (Bearish) but RSI ~ 50 (Neutral).
Support and Resistance : Nearest Support Zone is $0.75 (previous resistance), then $0.60. The nearest Resistance Zone is $1.00.

Polygon zkEVM to Undergo Crucial UpdatePolygon zkEVM has announced it will be undergoing a major protocol upgrade Today, November 23 as the protocol gets crucial face-lift.
Polygon zkEVM Mainnet Beta update is underway and in anticipation of the advancement, the network has released some core information for users in its ecosystem.
Polygon zkEVM Upgrade Schedule
According to layer-2 protocol, the update of Polygon zkEVM Mainnet Beta infrastructure will occur on November 23 at 13:00 UTC and it is expected to happen within 30 minutes. Markedly, there will be no interruption of the activities on the Polygon network during this time, except for when the update has been completed and the sequencer takes approximately 2 minutes to restart.
Just as with other notable upgrades in the past, no action is required from end users prior to the upgrade or even afterward. This is because no alterations have been made to the side of the Polygon zkEVM that impacts them. Only developers are required to upgrade their node, prover, and bridge to the latest versions to grasp the network’s full potential and continue to build Decentralized Applications (DApps) on the Ethereum blockchain.
The upcoming update is a pivotal move for the Polygon zkEVM as it comes with several significant changes and features. In the long run, these changes will play important roles in the zkEVM node, bridge, and prover infrastructure, including changes to RPC, sequencer, synchroniser, and databases. One other fix that would come with the zkEVM update is Web socket improvements.
Impressive Upgrade Pathway for zkEVM
Markedly, the Polygon zkEVM Beta version was first released earlier this year. This was after a funding round of $1 billion, two audits conducted by third-party organizations, and an internal audit involving 26 researchers. Sandeep Nailwal, Polygon’s co-founder explained how the zkEVM brings an extra level of innovation to the deployment of DApps.
Since then, several upgrades have been introduced into the Layer-2 scaling solution. In April, Polygon announced the addition of the Polygon PoS Bridge to the Polygon zkEVM. Another milestone is the integration of the network with other projects.
Polygon’s native token MATIC spiked 3.44% on the news and is changing hands at $0.7782 at the time of writing.

MATIC/USDT Poised for an Upward Trajectory? 👀 🚀 MATIC 💎 Paradisers, it's time to focus on MATICUSDT as it exhibits a promising shift, breaching the supply threshold with a bullish trend in sight.
💎 MATIC has been consistently overcoming a descending trendline, propelling upwards. Currently, it's navigating past the supply level at .7007, hinting at a heightened likelihood of a bullish trajectory as the supply zone transforms into a stronghold of demand, bolstering the bullish sentiment.
💎 Should POLYGON falter in its ascent, we foresee a potential bullish resurgence from the demand zone at .5998. However, a dip below this zone could signal a bearish downturn.

MATIC/USDT challenges in breaking through the crucial resistance💎 MATIC has undeniably captured significant attention in the market. Presently, MATIC is encountering challenges in breaking through the crucial resistance level. The presence of several bearish rejection candles at the resistance level suggests that if MATIC fails to breach this barrier in the near future, the price may undergo a decline, returning to retest the demand zone to generate new momentum.
💎 However, if MATIC successfully breaks out of the resistance level, a substantial upward movement is anticipated, probability reaching our target area.
💎 In the event of a retesting phase at the demand zone, if MATIC struggles to maintain its position and undergoes a breakdown, there is a likelihood of a bearish reversal. This could lead to a retracement to the next lower-demand area.
💎 In this scenario, a bounce is required to reclaim the area around $0.805 to resume the upward movement. Failure to reclaim the area may result in MATIC continuing the downward trend and returning to the strong support area.

Can Polygon leave the penny Crypto area for ever❓Can MATIC break the $1 and leave the penny Crypto area for ever❓
The Renko Chart shows that Polygon is at an important support line🟩
If Polygon breaks through the trendline resistance as well a huge bullish future is ahead IMO🚀
Comments💭, Likes♥️, RT🔃 & Follow🔗appreciated
Disclaimer:
Not financial advice
Do your own research before investing
The content shared is for educational purposes only and is my personal opinion

MATIC/USDT In the crucial area. Break out or rejected ??💎 MATIC has indeed become a focal point in the market, showcasing a well-executed rounding bottom pattern. Currently contending with a challenging supply area, MATIC is facing hurdles in breaking through. However, a close examination of the daily candle, especially with a robust green candle, suggests a potential breakout from the supply area in the imminent future. A successful breakout would pave the way for MATIC to probability advance toward our targeted supply area.
💎 On the flip side, if MATIC encounters difficulty in breaking the supply area in the near future, the likelihood of a downward movement increases. MATIC could retreat and undergo testing, heading towards the demand area at $0.69 to instigate a fresh momentum.
💎 The undesirable scenario unfolds if, during the retesting at the demand of $0.69, MATIC struggles to sustain its position and breaches the demand area. In such a case, MATIC would revert to a bearish movement, potentially retracing to the robust support area.

MATIC Fractal Geomerty ResearchMethod : Fractal Geomerty Research
White Line : Matic Chart
Purple Line : Geometry fractal predictions
" Previous history has been a repeated failure; the more I delve into this method, the closer I get to patterns that resemble the actual future. The more it fails, the more patterns/options I find that approach success in analysis. Because this method is an ancient one, rarely utilized, and challenging to comprehend, references are scarce."
Observing historical data from the smallest particle frame to larger time frames using fractal and Fibonacci, methods are very suitable for investors, spot traders, long-term or swing trades.
!However, it's not suitable for scalping, short-term, or future traders!
Note: that personal observation does not constitute financial advice. It's important to seek advice from a licensed financial advisor before making any investment decisions.
#matic #polygon

Polygon (MATIC) Whalers Spurred A Resurgence Polygon (MATIC)
Yesterday's brief downturn in BTC was seen by investors as an attractive chance to buy altcoins at lower prices, with MATIC being one of them. A swift gathering of buyers at the local low of $0.760 spurred a resurgence in its upward trend.
Currently, the asset is oscillating between a support zone of $0.765-$0.790 and resistance levels ranging from $0.843 to $0.860. There's also an additional marker for buyers at $0.814. Aiming for continued growth and potentially setting new highs is the main focus. In the near term, the $0.905 level might be the next milestone for buyers.
However, a downtrend in BTC's chart could adversely affect altcoin prices. If this happens, MATIC could descend to the support levels at $0.734 and $0.694. It's also important to keep a close eye on Bitcoin's movements, as a more pronounced correction in BTC could make several altcoin support levels obsolete, possibly leading to a more significant drop compared to BTC.

Get Ready to Ride the MATIC Rocket to $1 - It's Pump Time!MATIC token is gearing up for a monumental pump, and it's aiming straight for the $1 mark!
Yes, you heard it right! MATIC is on the rise, and we have all the reasons to be thrilled about it. This incredible opportunity is knocking at our doors, and it's time to seize it with both hands. So, buckle up and get ready to embark on a thrilling journey towards profits and success!
Here's why you should consider joining the MATIC long party:
1. **MATIC's Impressive Performance**: Over the past few weeks, MATIC has showcased remarkable resilience and growth. With its solid fundamentals and a dedicated community backing it, MATIC has proven its potential to soar to new heights.
2. **Market Sentiment**: The overall market sentiment is overwhelmingly positive towards MATIC. Experts and analysts are buzzing with excitement, predicting a substantial surge in its value. It's the perfect time to jump on board and ride the wave of success!
3. **Technological Advancements**: MATIC's innovative layer 2 scaling solution has been gaining significant traction lately. This groundbreaking technology has the potential to revolutionize the blockchain industry, attracting more investors and driving up the demand for MATIC.
Now, it's time for the call-to-action! Don't miss out on this golden opportunity to long MATIC and maximize your profits. Here's what you can do to join the action:
1. **Conduct Thorough Research**: Before making any investment, ensure you have a solid understanding of MATIC's fundamentals, recent developments, and market trends. Knowledge is power, and it will help you make informed decisions.
2. **Set Realistic Targets**: While we're all excited about MATIC's potential, it's essential to set realistic profit targets and manage your risk. Plan your trades carefully, and don't forget to implement stop-loss orders to protect your investments.
3. **Stay Informed**: Keep a close eye on the latest news, social media buzz, and market trends surrounding MATIC. By staying informed, you'll be able to adjust your trading strategy accordingly and make the most of this exciting pump.
Remember, this article is not financial advice, but rather an enthusiastic heads-up about a promising opportunity. Always do your due diligence, consult with professionals, and trade responsibly.
Let us embrace this thrilling moment with open arms. Get your trading platforms ready, prepare your strategies, and let's ride the MATIC rocket together towards the $1 target! Exciting times await us, and I couldn't be more thrilled to share this journey with all of you.

MATIC Surges 6% as Whales Jump In!
MATIC token has just experienced a remarkable surge of 6%, and the cherry on top? Whales are diving into this promising opportunity!
Yes, you read that right! The MATIC token has been making waves in the market, and it's time for us to ride this exhilarating wave. With whales investing in MATIC, it's a clear sign that the smart money is betting big on its future potential. This is a golden opportunity for us to join the ranks of these savvy investors and potentially reap substantial profits.
So, what are you waiting for? It's time to seize the moment and take advantage of this exciting development. I encourage you to seriously consider going long on MATIC, as this surge, coupled with whale investments, indicates a strong bullish sentiment surrounding the token. By going long, we position ourselves to potentially benefit from the anticipated upward momentum.
Why should you consider MATIC? Well, apart from the recent surge and whale interest, MATIC has been gaining significant traction in the market due to its innovative scalability solutions for Ethereum. As the crypto world continues to evolve, MATIC's technology is well-positioned to address the scalability issues faced by many blockchain platforms. This potential for widespread adoption makes MATIC an attractive long-term investment opportunity.
Remember, timing is crucial in the crypto market, and this surge presents a unique chance to capitalize on the growing interest in MATIC. Don't let this opportunity slip through your fingers! Conduct thorough research, analyze the market trends, and consider adding MATIC to your portfolio.
If you're ready to take the plunge and long MATIC, I suggest exploring reputable exchanges that provide a seamless trading experience and offer the necessary tools to maximize your gains. Ensure you stay updated with the latest news and developments surrounding MATIC to make informed decisions.
As always, please remember that investing in cryptocurrencies carries risks, and it's essential to make decisions based on your own financial situation and risk tolerance.
