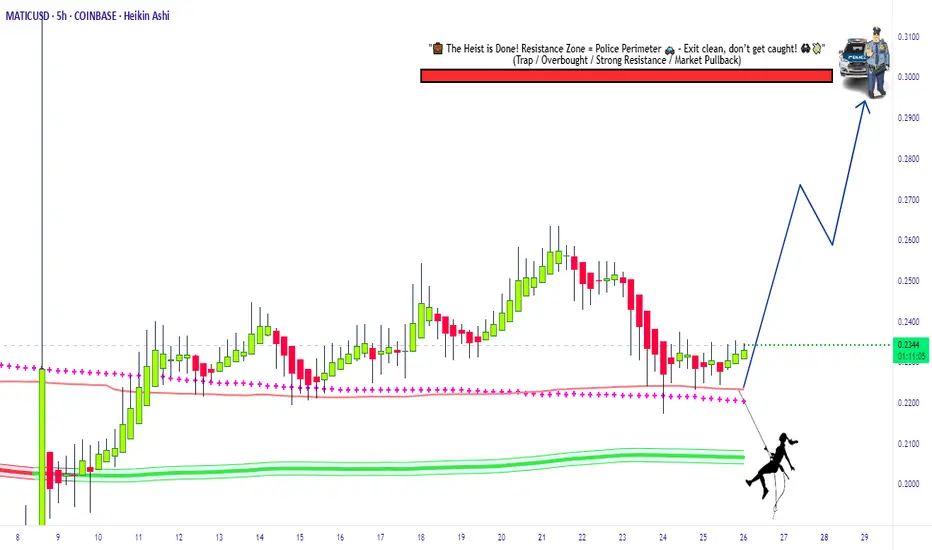
Swipe the Polygon Vault MATIC/USDT Bullish Heist Strategy🔥 MATIC/USDT Heist Plan: Swipe the Loot Before the Cops Clock In! 🏴☠️💸
🌍 Oi! Hola! Bonjour! Hallo! Marhaba!
💼 Welcome back, Money Makers & Market Bandits!
The Polygon (MATIC) vs Tether vault is wide open! Based on our 🔍 Thief Trading Style Analysis, it's time to plan the ultimate crypto chart robbery with a long-side assault on this bullish breakout. 📈💥
💣 Robbery Blueprint – The MATIC/USDT Master Plan
🚪 ENTRY STRATEGY: Get In, Get Rich, Get Out!
⚡ Vault Breach: Enter LONG at market price if you're bold & fast.
🎯 Smart Entry: Wait for price pullbacks on 15m/30m swing lows/highs.
💎 Use layered DCA-style orders for clean risk-controlled entries.
Thieves don’t rush—they snipe the perfect price levels.
🛑 ESCAPE PLAN: Stop Loss Strategy
📍 SL placed at: 0.2000 (based on 4H candle wick zone).
💡 Adjust SL to your loot capacity (risk, lot size, number of orders).
⚠️ If price dips near SL, that’s the cops knocking—bail fast or go down swingin’.
🎯 TARGETS: Stack Your Bags Before the Alarm Rings
🚀 Primary Target: 0.3000
🧲 Scalpers: Grab & Go! Stick to long bias only. Use trailing SL to protect the gains.
🎩 Swing Robbers: Hold strong. Watch for resistance traps & trailing stops near key zones.
📊 Market Intel: Why This Heist Has High Odds 🎯
🔋 Bullish pressure building with growing momentum.
📡 Supporting Data:
🔍 On-chain metrics signaling accumulation
💼 Macro sentiment favoring risk assets
🧠 COT reports + intermarket analysis leaning bullish
Just don’t get comfy—this is a heist, not a honeymoon!
🚨 Trade Warning – Don’t Get Caught!
📢 Major News Releases = High Volatility.
🚫 Avoid fresh trades during key announcements.
🔒 Use trailing SL to lock in profits & escape clean.
💥 Like, Follow & Power Up the Robbery Squad 💥
💬 Support the crew. Hit BOOST to keep these trade ideas flying.
Your thumbs-up fuels the next chart breach. 💪
📡 Stay locked in—more heist setups coming soon!
🎯 Trade Sharp. Swipe Smart. Escape Fast. 🏴☠️
Thief Trader Out. 🐱👤💰
Polygonusd
POLUSDT 1D AnalysisPOL ~ 1D Analysis
#POL This coin is currently at its lowest support. Buy if you still have confidence in this coin with a short term target of at least 15%+ from this support.

Polygon: More (short-term) Upward PotentialFor Polygon’s POL, we primarily expect further corrective rises during the blue wave (iv), but below the $0.51 mark, renewed sell-offs should take over. These declines should then drive the price down below the support at $0.15, allowing the large wave to reach its conclusion there. Our alternative scenario – where the low of wave alt. in green would be already behind us (probability: 33%) – is still relevant. This scenario would be reinforced with a jump above the resistance at $0.51 but only finally confirmed with increases above the next higher level at $0.76.
📈 Over 190 precise analyses, clear entry points, and defined Target Zones - that's what we do.

POL is breakout out of the descending wedge upper trend line.POLYGON is now trading outside the upper trendline of the descending wedge pattern and may be preparing for a substantial move in the month of May.
Good luck, and always use a stop-loss!

Polygon (POL) AKA "MATIC" - Long Key LevelsPolygon (POL) or "MATIC" has experienced a strong rally recently, climbing from its monthly low of $0.40 to its current price of $0.70. This implosive move has brought the bulls to push POL to a critical descending trendline resistance level that the bears have held in a long-term downtrend since 2022.
The key level to watch is the $0.76 mark, where the neckline and trend line meet with previous resistance zones. A breakout above $0.76 could potentially surge POL to it's 1st target which is around a resistance level of: $0.89. If momentum continues, then price action will retest between: $1.23 - $1.48 representing a potential upside of +100% from the breakout at this current point

POL/USDT: The Perfect Short-Term Play?POL/USDT – Demand Zone Opportunity with Caution
Polygon Ecosystem Token (POL) is approaching a demand zone that aligns with a Fibonacci retracement level, offering a potential short-term bounce. However, since this is not a high-timeframe (HTF) level , traders must exercise caution and manage their risk effectively.
Buyer Activity : The demand zone reflects a lower timeframe area where buyers have stepped in previously, indicating potential short-term interest.
Fibonacci Confluence : This zone aligns with a key Fibonacci retracement level (e.g., 0.618 or 0.786), which could enhance its strength for a short-term reaction.
Why Traders Must Be Careful
LTF Nature : This is a lower timeframe (LTF) level, making it more vulnerable to volatility and false breakouts compared to HTF zones.
Limited Strength : Since it lacks the institutional significance of HTF zones, the level may not hold as strongly.
Breakdown Risk : LTF zones are more prone to invalidation, so risk management is crucial.
How to Trade POL/USDT Safely
Wait for Confirmation : Only enter after bullish signals like candlestick patterns (e.g., hammer, bullish engulfing) or volume spikes indicate buyer strength.
Set Tight Stop-Losses : Place a stop-loss just below the demand zone to minimize potential losses.
Monitor HTF Context : Align your trade with the HTF trend. If the overall structure is bearish, this LTF zone may not hold.
Use Smaller Position Sizes : Reduce position size compared to HTF levels to account for the increased risk.
Summary :
The POL/USDT demand zone and Fibonacci retracement setup present a short-term trading opportunity. However, the lack of HTF validation means traders should proceed with caution, use tight risk management, and wait for strong confirmation signals.
I keep my charts clean and simple because I believe clarity leads to better decisions. Trading doesn’t have to be overly complicated, and I enjoy sharing setups that have worked well for me.
My approach is built on years of experience and a solid track record. I don’t claim to know it all, but I’m confident in my ability to spot high-probability setups. It’s all about learning and growing together as traders, and I’m here to share what I see.
The markets can confirm what the charts whisper if we’re paying attention. I hope these levels help you as much as they’ve helped me in the past. Let’s see how this plays out!
My Previous Hits
🐶 DOGEUSDT.P: Next Move
🎨 RENDERUSDT.P: Opportunity of the Month
💎 ETHUSDT.P: Where to Retrace
🟢 BNBUSDT.P: Potential Surge
📊 BTC Dominance: Reaction Zone
🌊 WAVESUSDT.P: Demand Zone Potential
🟣 UNIUSDT.P: Long-Term Trade
🔵 XRPUSDT.P: Entry Zones
🔗 LINKUSDT.P: Follow The River
📈 BTCUSDT.P: Two Key Demand Zones
🟩 POLUSDT: Bullish Momentum

Polygon: Shaken UpFollowing an impressive 60% rally from the low of the green wave on November 5, POL has seen a sharp pullback since Tuesday, shedding about 20% of its value. The price remains stuck within our blue Target Zone between $0.30 and $0.47. However, it should exit this range during the ongoing blue upward wave (i) to surpass the August 21 high at $0.60. However, if the price instead falls below the support at $0.28, the green wave alt. will mark a new low. This would delay the development of the blue five-wave upward structure – a scenario we rate with a 37% probability.

MATIC/USD "Polygon vs US Dollar" Bullish Side Robbery Plan.Hallo! My Dear Robbers / Money Makers & Losers, 🤑 💰
This is our master plan to Heist MATIC/USD "Polygon vs US Dollar" Market based on Thief Trading style Technical Analysis.. kindly please follow the plan I have mentioned in the chart focus on Long entry. Our target is Pink Zone that is High risk Dangerous level, market is overbought / Consolidation / Trend Reversal / Trap at the level Bearish Robbers / Traders gain the strength. Be safe and be careful and Be rich.
Entry 📈 : Can be taken Anywhere, What I suggest you to Place Buy Limit Orders in 15mins Timeframe Recent / Nearest Low Point
Stop Loss 🛑 : Recent Swing Low using 2h timeframe
Attention for Scalpers : Focus to scalp only on Long side, If you've got a lot of money you can get out right away otherwise you can join with a swing trade robbers and continue the heist plan, Use Trailing SL to protect our money 💰.
Warning : Fundamental Analysis news 📰 🗞️ comes against our robbery plan. our plan will be ruined smash the Stop Loss 🚫🚏. Don't Enter the market at the news update.
Loot and escape on the target 🎯 Swing Traders Plz Book the partial sum of money and wait for next breakout of dynamic level / Order block, Once it is cleared we can continue our heist plan to next new target.
Support our Robbery plan we can easily make money & take money 💰💵 Follow, Like & Share with your friends and Lovers. Make our Robbery Team Very Strong Join Ur hands with US. Loot Everything in this market everyday make money easily with Thief Trading Style.
Stay tuned with me and see you again with another Heist Plan..... 🫂

POLYGON (Crypto) BUY TF H4 TP = 0.4564On the H4 chart the trend started on Aug. 05 (linear regression channel).
There is a high probability of profit taking. Possible take profit level is 0.4564
Using a trailing stop is also a good idea!
Please leave your feedback, your opinion. I am very interested in it. Thank you!
Good luck!
Regards, WeBelievelnTrading

Polygon MATIC Intraday Trade SetupThe chart highlights breakout/rejection points, criteria, and targets to execute on the trade opportunity.

Cryptolean Chainlink MATIC Update Polygon MATIC declined sharply to $1.01, the key daily support.
A bullish reversal from $1.01 is likely and will result in a bullish move to re-test $1.07 and the key daily resistance zone of $1.14-$1.20.
A bearish break-out of $1.01 will push #MATIC price in the daily range zone and will increase probability of a deeper correction towards the next support at $0.89.
Intraday Chart
The MATICUSDT 4-Hour chart is bearish and teasing the resistance at $1.07.
A bearish rejection of $1.07 will lead to $1.01 and lower to the key support zone of $0.86-$0.92, where I will be closely watching the MATIC price action, as the bullish rejection of this zone is possible.
A bullish break-out of $1.07 will lead to a re-test of $1.13 and, possibly, $1.19, however the price action may be slow and choppy.
Support once read!
Thank you.

Polygon (MATIC) Bull ScenarioDo you think Altcoins will stall when Bitcoin starts running? If you think the alts will walk too, I can talk to you about MATIC.
In my opinion, I think we are in the days when we have the last opportunity to buy MATIC, which will be the star of the next bull season.
As you can see on the black lines, MATIC, which made the symmetrical triangle it made in the past, entered short-term downtrends 2 times within this symmetrical triangle (Orange line) and after the second break, the bull run started. We are on the eve of this process.
In the two symmetrical triangle patterns, we can see that MATIC is spending a lot of time inside the 0.382 and 0.618 levels of Fibonacci retracement. (Purple Boxes)
In addition, the bottoms and tops that form the symmetrical triangle in both patterns are made at the same Fibonacci levels. This is another indication that the two patterns are very similar. (Red arrow and circles)
Therefore, when we look at the Fibonacci levels again, we can see that when the bull season is entered, the targets will be $10 and $87, respectively. This means 1672% when the first target arrives; In the second target, a profit of 14000% will be obtained.
Since the risk/reward ratio in this scenario fits my trading style and strategy, I made my first purchase at this level. I will add when the orange resistance is broken and retested, and I will add my position at the retest after the triangle break (black) and wait for the $87 level.

Matic | Polygon Looks Bearish HereTargets from the initial move down line up with targets from the next move down and support levels.

Polygon: Exemplary 🤓Quite commendably, Polygon has advanced into our magenta-colored target zone between $0.78 and $1.02 and has touched at the lower edge of the pink trend channel to finish wave (iv) in blue. Now, we expect the altcoin to gain strong upwards momentum to haul itself up, leaving the magenta-colored zone on the northern side and developing wave (v) in blue, which should end in the top of wave (i) in magenta. Wave (ii) in magenta should then make for a distinct counter movement before wave (iii) in magenta should take Polygon further upwards.

Polygon Analyze (Road Map, 03/14/2023)!!!🗺️Today let's take a look at Polygon project 🗺️roadmap🗺️ in daily time frame.
First, let's take a look at the fundamental.
Fundamental :
Polygon is a layer-2 scaling solution for Ethereum which aims to address the scalability issues on the Ethereum network by providing faster and cheaper transactions. Polygon utilizes a network of sidechains to enable fast and secure transactions, allowing users to transfer assets between Ethereum and other networks.
Polygon has a strong development team that is dedicated to improving the network and expanding its capabilities. This is evidenced by the frequent updates and upgrades to the network that are aimed at improving its scalability, security, and functionality.
It also has strong partnerships with notable players in the blockchain industry, such as Aave, Curve, and Chainlink, which increases its credibility and reputation.
Overall, the combination of strong partnerships, a dedicated development team, and impressive growth make Polygon a promising project in the blockchain industry.
----------------------------------------------------------------------------------------------------------------------------------------------------------------------------------------------------
Technical :
It seems that Polygon has started to form a zigzag correction(ABC/5-3-5) after completing its 5 impulse waves in the 🔴resistance zone($1.488-$1.249)🔴, so that wave A has ended on the important uptrend line.
💢Currently, the Polygon is moving in the Time Reversal Zone (TRZ) and near the resistance zone.
💢Polygon can also form the fan principle at top pattern.
💢In addition, the sell signal is created by the 50-SMA and 50_EMA.
💢The RSI indicator is also rejected from the 50% line and above the descending channel.👇
🔜I expect the Polygon to decrease to the 🟢support zone($0.77-$0.69)🟢after the important uptrend line breaks.
Polygon Analyze ( MATICUSDT ) Daily Time frame⏰.
Do not forget to put Stop loss for your positions (For every position that you want to open).
Please follow your strategy, this is just my Idea, and I will be glad to see your ideas in this post.
Please do not forget the ✅' like '✅ button 🙏😊 & Share it with your friends; thanks, and Trade safe.

Polygon aka Matic nice uptrend hey everyone,
Polygon is in nice constructive uptrend direction... it may or may not pull back to strong support trendline because its currently consolidating at the point where it is... Previous high was 1.55 approx... next high is 1.72... this year the polygon may break its previous high of $3 if crypto market remain bullish till end of this year... the lowest it can go is 0.98-1.00 since price is above 200ma.. the price may retest the 200ma if market crashes
good luck ...

MATIC Pattern in Weekly TimeframeMatic seems to be remaking the pattern it did before 2021 on the weekly timeframe. The final fix will be the last buying opportunity for me. It is clear that the correction will come up to the 40-week moving average.

MATIC is under bearish controlMATIC is so different from the whole market. However, it's also in a bearish state. but keep in mind that in case of any consolidation (of the bearish movement), MATIC will have a stronger move and will catch the green zone. then it (and the market) will continue the downtrend.
its best timeframe to daytrade is 15min. only open short in market demand saturation.

Could we be headed to .90 MATIC/USD (polygon) ?
Polygon's Layer 2 solution is becoming increasingly important for Solana developers seeking to connect with Ethereum's DeFi ecosystem. The fast and cost-effective integration options offered by Polygon are driving greater cross-chain interoperability and connectivity. #Polygon #Solana #Ethereum #DeFi"

Continued BEAR thoughts on #MATIC
Continued BEAR movement to the area of 1.25 is seeming certain now! Calling it!

MATIC looks bearishHello, everyone!
Let's take a look at the BINANCE:MATICUSDT chart. After the huge downside impulse price is printing the clear upward sloping trend channel. We can also notice that it formed the deviation below this channel. It was the fake breakdown to stimulate traders open short trades.
In such cases price usually tends to create the same deviation to the upside. It could perfectly coincides with the supply zone above. Therefore I expect the MATIC price a little bit higher at $1.8 and crash after that.
Best regards, Ivan
________________________________________________________________________________________________
If you like my trade ideas, please smash the boost button to stimulate me make more quality analytics!

Polygon MATIC price will double or halve its value in few monthFinally, altcoins have started their upward movement, most of the ideas we have published on different coins over the past 2–3 weeks are in the process of working out the targets.
But the MATICUSDT price did not grow much on the crypto market in the last few days. In fact, the MATIC price was one of the first to break out of the downward trend in the summer of 2022 and has been in a protracted consolidation since then.
The way out of such consolidation will be a powerful impulse movement that will double the value of the Polygon token or halve it.
Therefore, it is very important to monitor the behavior of the MATICUSDT price around $0.75.
Another holding of the price above this level will increase the chance of starting growth to $1.50 per MATIC
However, if sellers can easily push and fix the price below $0.70-0.75, then this will be a signal that keeping MATIC in your portfolio may be unprofitable. After all, because of such conditions, an almost unobstructed path will open for the price to fall to 0.44
_____________________
Did you like our analysis? Leave a comment, like, and follow to get more

MATIC - Long scenarioThere are possible scenarios for matic to move upward.
targets are on the chart and keep in mind that any position you open, should have stoploss on 0.7. design your position with this SL and a good risk/reward.
in the green zone, we might have very low momentum, but as daily MACD gets above 0, it will jump.
all the idea will expire after getting lower than 0.7
