Matic seems bullishIts just my speculation But I am bullish on Matic. Just bounced back from a support zone.
Polygonusdt

MATIC - Double BottomA bullflag breakdown into a double bottom is evident in early price evolution
This seems to be happening again with a bullflag being present, all that's needed now is a small breakdown and from there it is lift off as per the bullish double bottom pattern
Daily Chart
Posting some of my previous MATIC analyses

SHORT MATICUSDT (Back down to $0.50-$0.70)Entry Price, Stop Loss, Take Profit, and Liquidation Price are all labeled.
Leverage Used: 5x (Short) - Isolated Marigin
Please let me know what you think in the comments!
* I am not a financial advisor. These charts I provide for free are brief explanations of current trades I am in.
Thanks!

Matic/Polygon looks like it's forming a head and shoulders patteSeems like a clear head and shoulders pattern near the golden pocket.

Polygon MATIC short Entry Range, Take Profit and Stop LossMATIC/USDT short
Entry Range: $0.80 - 0.85
Take Profit 1: $0.76
Take Profit 2: $0.72
Take Profit 3: $0.61
Stop Loss: $0.95

MATIC BULLISH BREAK-OUT. $0.96 ON THE RADARHello traders & investors!
We have a nice day trading idea here.
Breaking out of important consolidation range. 0.80-0.85 is a nice entry point for this move up
Let's wait and see how it plays out
Take care!

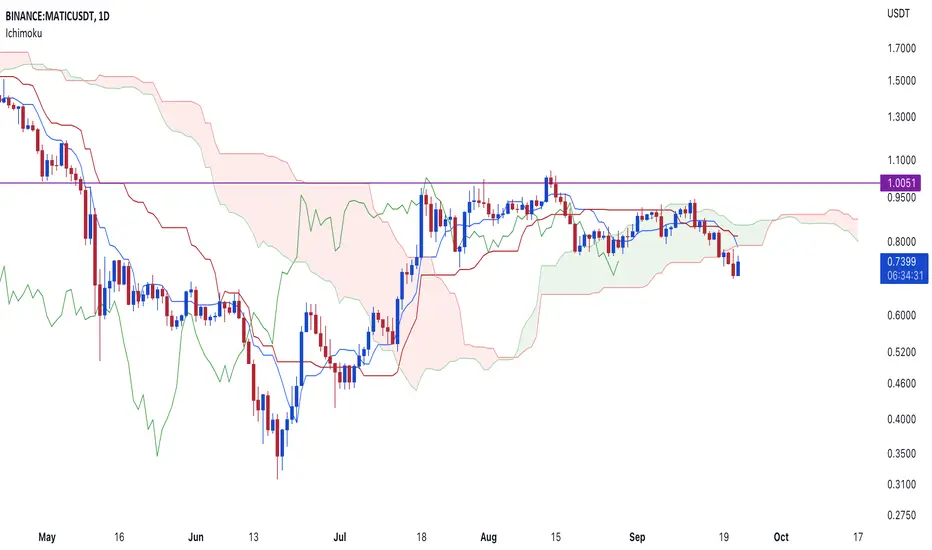
♌ MaticUsdt ♌ Polygon ♌♌ Matic Usdt
⏰ Time Frame : 1D
✴️ I have shown Supports and Resistances .
please tell me about your Idea
what do you think?
❓ Will Break Resistance 1.0110 ?
📛 Please follow the market trend and decide to buy or sell.
⚠️ (This isn't a signal for buy or sell) ⚠️
#️⃣ August / 08 / 2022
👸 Analyzed by : Parisa_Alipoor

MATIC SHORT TILL 0.8035$MATIC gave a breakout from a bear flag 20 ma , 50 ma , 20 ema , 50 ema , are going to cross downside which is also a heavy bearish sign 4hr 6hr macd is also indicating bearish movement . you can a open a short till our target and sl with low levrage.
NOT A FINANCIAL ADVICE.

Polymath (POLY) formed Butterfly | A good buy opportunityHi dear friends, hope you are well and welcome to the new trade setup of Polymath (POLY) with Bitcoin pair.
On a 4-hr time frame POLY has formed a huge bullish Butterfly pattern:
Note: Above idea is for educational purpose only. It is advised to diversify and strictly follow the stop loss, and don't get stuck with trade

It Reminds Me.. MATICUSD MATIC reminds me more and more of early ETH every day
Can you see the similarities ??
ETH in yellow (an earlier period of ETH's price development), MATIC in red

Polygon Bounces Off Golden Ratio While the media has called this a "crypto winter" and even some experienced traders are calling for crypto to "go to zero", I've been trading based on nothing but the charts and it's paid off.
I bought Polygon at its Golden Ratio last month and the price bounced and broke above the EMA exp ribbon. It has more than doubled in a month. It's amazing how few people understand what the blockchain is, and even fewer who understand what Polygon is or why it will be valuable in the future. While I expect Polygon to go down to re-test the EMA before breaking above the non-log Fibonacci level (not pictured on this chart), I will add more and raise my stop loss.
When you hear people say "crypto will go to zero" you know we're close to a bottom. Sentiment does not get any more bearish than that. Whenever you hear people saying that price will go to zero, BUT the charts continue to show a log growth curve, wait until you no longer see capitulation candles (long upper wicks) and the price will rebound. Works almost every time and you can make tremendous amounts of money quickly. If you're wrong, then let your stop loss trigger. Limit loss, not profit.
Despite being in a "crypto winter", 100% of my crypto holdings are in the green, some by a lot. I did not start buying any crypto until June 2022 (I sold my original Bitcoin holding in the latter part of 2021 because there were too many people saying it's going to 100k, some were saying even 500k). With that type of mania, I knew it was time to sell. It's funny that some of the same "experts" on Trading View who were saying in November 2021 that crypto was blasting off to the moon, are now saying it's going to zero. Hearing them now say that price is going to zero means it's time to start buying. Knowing when to buy and sell is all in the charts. Also important is the crypto seasonality chart: bitcoinmonthlyreturn.com. We're coming up on August and September which tend to be more bearish than bullish. Have your stop losses in place.
The crypto fear and greed index is a great contrarian indicator too: alternative.me When sentiment remains suppressed for a prolonged period of time, that usually signals a bottom. All the weak hands, and leveraged accounts on margin would have sold by the time this sentiment shifts away from fear. By that time all the worthless tokens and worthless algorithms have gone to zero. Those who own quality crypto assets like BTC, ETH, SOL, MATIC, etc., should be happy for this crypto winter. When the tide goes out you will see who the real winners are.
Additionally, the crash in Bitcoin and the crypto capitalization is in large part due to monetary policy. Monetary tightening, and even worse, a reduction in the money supply (of the US dollar), causes all currency to crash relative to the US dollar. Money supply very rarely is reduced (as it stifles economic growth). Consumer spending is the heart of American economic growth so the Federal Reserve rarely finds itself in a scenario whereby reducing the money supply actually makes sense. The money supply typically grows exponentially. One can actually draw a linear log regression channel for the entire history of the US money supply and one will see that the money supply always remains in the channel (meaning it always has gone up exponentially). So knowing this means that, soon enough, the printing press will start up again, and more money will be printed exponentially and that this rare period when the money supply is being reduced is actually a rare buying opportunity for cryptocurrency. Anyone saying that we'll never get back to the level of cash infusion that we saw in 2020 clearly does not understand math or exponents. We will not only get back to that level of M2SL, but we'll fly past it in the future, (we just probably won't see that level of ROC in M2SL).
Finally, and importantly, not all crypto is the same. There are definitely many crypto tokens that actually will go to zero. The easiest way to shake out which crypto will go to the moon vs. go to zero is simply analyze the crypto relative to the US dollar. Doing so is actually simple on Trading View, just use the equation 1/(Insert Crypto Token/USD). This will show you which way the US dollar is moving relative to the value of that crypto. You want to see the USD moving down relative to the crypto. If the USD is moving up relative to the crypto, then that crypto is moving toward zero.
Here's an example of DOGE. Note that the USD is moving up relative to DOGE, which in turn means that the DOGE token is moving toward zero.
Seeing this chart and hearing Elon Musk support this token just makes me sad for everyone believing him. No one person alone can move the market. I always say that charts don't lie, and the charts are saying that DOGE tokens are becoming worthless.
Even more lucrative than comparing a crypto token to the US dollar, one can compare the crypto token to Bitcoin or to the SPY. If a crypto asset is growing in a log curve compared to another asset that is also growing in a log curve, well then, investing in that asset is likely going to make you wealthy quite fast. Check out Polygon (MATIC) relative to the SPY:
This might look like a confusing chart, but what it's actually showing is that Polygon is moving so fast relative to SPY that the ratio of SPY to it is approaching zero. From a mathematical perspective, that means that Polygon is growing according to a log growth curve relative to SPY. Since SPY itself grows according to a log growth curve relative to the US dollar, that means Polygon is an especially lucrative place to grow your US dollars. The fact that the EMA exp ribbon is resisting the upward movement of the relative price, suggests that the trend has not broken and that the log growth curve relative to SPY remains intact. If anything, the current levels are suggesting an extremely rare buying opportunity.
If there are any other like-minded traders out there who understand the blockchain and who understand everything I've said above please comment below so I can give you a follow. I need to connect with more like-minded traders who understand blockchain technology, dApps and their role as the building blocks of a decentralized augmented and virtual reality existence. Whereas if you disagree with the above analysis please leave a well-reasoned comment or chart below to argue your point!

#Polygon surges 85%, will MATIC Bulls Break above $0.67?Past Performance of Polygon
Polygon prices are overly stable, trading inside a broader $0.22 trade range clear in the daily chart. While traders expect more gains in the days ahead, the failure of bulls to clear above $0.67, a multi-week liquidation level, could slow down the uptrend in the short term.
#Polygon Technical Analysis
The primary liquidation level marking June 2022 highs stands at $0.67. Although MATIC traders are confident of more gains, there must be a clear, high volume close above this line before traders double down, targeting $1.20 in the medium term. However, the daily chart shows signs of waning upside momentum since the stochastic is at the overbought territory. In that case, traders should watch out whether buyers will build momentum to surge above $0.67. On the reverse side, losses below $0.45 or last week's lows, may invalidate the uptrend, possibly triggering a sell-off towards $0.33.
What to Expect from #MATIC?
Buyers are confident after surging 85 percent from 2022 lows. All the same, prices are flat-lining around a critical liquidation level. In the short term, traders can wait for a sharp close above $0.67 or $0.45 for immediate trend definition.
Resistance level to watch out for: $0.67
Support level to watch out for: $0.45
Disclaimer: Opinions expressed are not investment advice. Do your research.

Polygon MATIC Entry Range, Take Profit and Stop LossAfter the sell signal
and the buy signal
here comes the continuation!
MATIC/USDT
Entry Range: $0.48 - 0.53
Take Profit 1: $0.62
Take Profit 2: $0.70
Take Profit 3: $0.93
Stop Loss: $0.41

MATIC long opportunity- Bounce off of strong support
- Massive capitulation candle down
- Bullish momentum on the 1h chart
TP1: $0.4950 for 2R/R trade.
TP2: $0.5125 for 3R/R trade

Polygon MATIC short Entry Range, Take Profit and Stop Lossall targets reached here
MATIC/USDT short
Entry Range: $0.44 - 0.49
Take Profit 1: $0.39
Take Profit 2: $0.33
Take Profit 3: $0.21
Stop Loss: $0.57

MATIC/USDT - Potential Short ScenarioHello Traders!
MATIC is moving within the descending trend.
Currently, the price is consolidated under the price level of $0.70 and MA100 on the weekly timeframe, which acts as a solid technical trigger in favor of the asset's continuation of the fall.
It can be assumed that the continuation of Bitcoin devaluation as an index of the whole cryptocurrency market will affect other assets in the form of impulse downward movement. In this case, we can consider the search for medium-term purchases.
The price range of $0.20 to $0.30 will be an area of interest for a set of medium-term purchases. The targets for such purchases will be price levels of $0.45 and $0.70.
Good luck, and watch out for the market
P.S. This is an educational analysis that shall not be considered financial advice

POLYGONMATIC/USDT i see in this coin will perfrome with Tripple Bottom i will see 0.743 - 0.750 if dont break this zone i will take SHORT position

POLYGON MATIC expected move elliot wave analysis maticbtcPOLYGON MATIC expected move Elliot wave analysis maticbtc maticusdt maticusdc

If MATIC comes to my entry point I'll Short it#MATIC | USDT
It does look bullish so far, a few resistance to take out, possible final wave till $1.4475 where we will be looking to short it.
- Strong Supplyzone @ $1.447
- We can set limits their as MATIC approaches the zone.
- Invalidation of this pattern above $1.477.
- Correction Waves till target (iii) or maybe more if we doesn't hold.
- Setting up alerts on MATIC

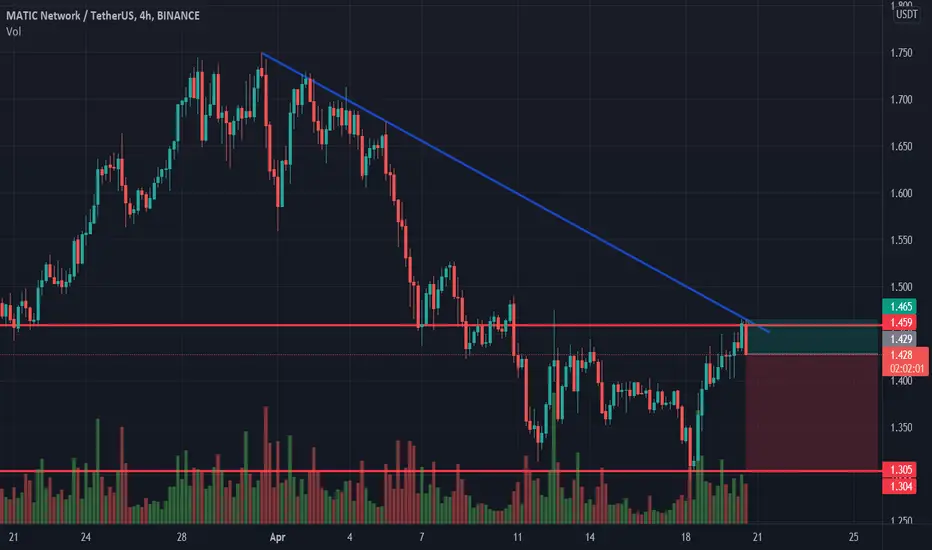
Polygon shortPolygon bounced off the resistance level. Asset bounced down off the bearish trendline. Decline to support level at 1.305 is expected to happen.
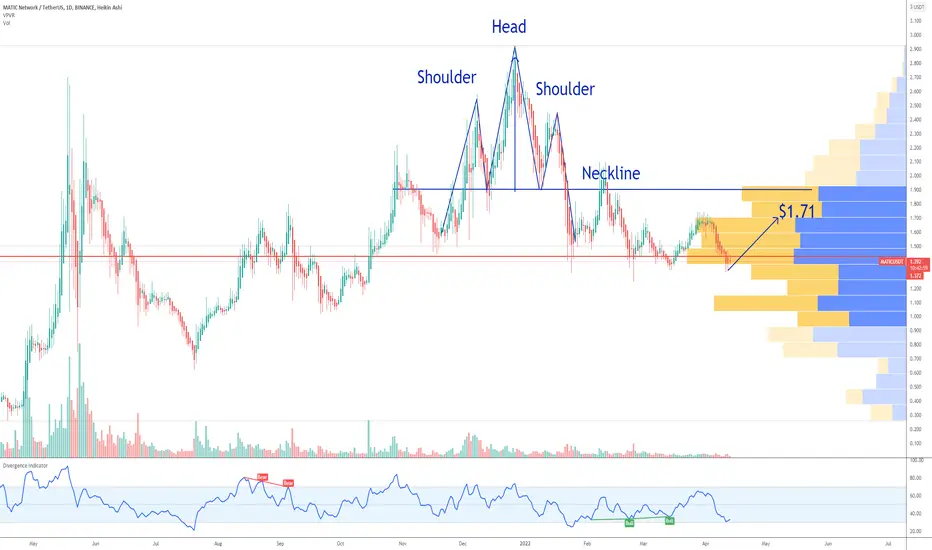
MATIC strong support areaMatic is sitting at a strong support level from which i think it can bounce to the 1.71 resistance area.
Looking forward to read your opinion about it.

MATIC short term targetThere is an increase in MATIC`s volume recently and a lot of interest surrounding it.
Looks like a possible bounce from the support area.
I would expect a pump to $1.71 short term.
Looking forward to read your opinion about it.