PONDUSDT 1W Analysis POND ~ 1W Analysis
#POND This is the lowest support for now. Buy on a retest of this support block with a short term target of at least 15%+ from here.
Pond

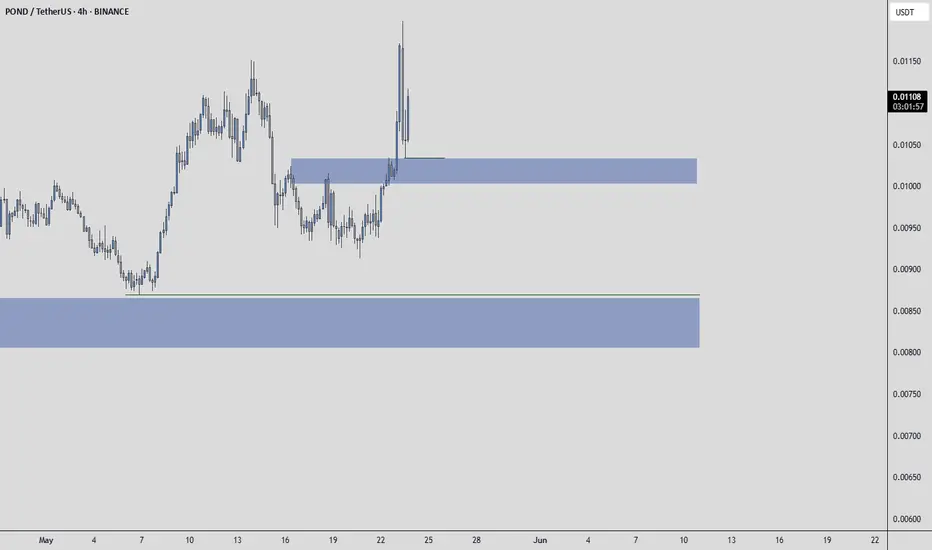
PONDUSDT | Buyers Showing Real PresenceUnlike many altcoins, PONDUSDT is showing clear signs of buyer strength. The blue boxes below represent well-defined demand zones that could reward patient entries.
If you prefer waiting for price to pull into those zones, you're thinking long-term. But even entering here with a market buy isn’t a bad idea, the momentum supports it, and the structure is holding well.
I’ll personally monitor both options, but I never ignore confirmation.
“I will not insist on my short idea. If the levels suddenly break upwards and do not give a downward break in the low time frame, I will not evaluate it. If they break upwards with volume and give a retest, I will look long.”
Whether you're aggressive or cautious, this setup respects both styles, and that’s rare.
📌I keep my charts clean and simple because I believe clarity leads to better decisions.
📌My approach is built on years of experience and a solid track record. I don’t claim to know it all but I’m confident in my ability to spot high-probability setups.
📌If you would like to learn how to use the heatmap, cumulative volume delta and volume footprint techniques that I use below to determine very accurate demand regions, you can send me a private message. I help anyone who wants it completely free of charge.
🔑I have a long list of my proven technique below:
🎯 ZENUSDT.P: Patience & Profitability | %230 Reaction from the Sniper Entry
🐶 DOGEUSDT.P: Next Move
🎨 RENDERUSDT.P: Opportunity of the Month
💎 ETHUSDT.P: Where to Retrace
🟢 BNBUSDT.P: Potential Surge
📊 BTC Dominance: Reaction Zone
🌊 WAVESUSDT.P: Demand Zone Potential
🟣 UNIUSDT.P: Long-Term Trade
🔵 XRPUSDT.P: Entry Zones
🔗 LINKUSDT.P: Follow The River
📈 BTCUSDT.P: Two Key Demand Zones
🟩 POLUSDT: Bullish Momentum
🌟 PENDLEUSDT.P: Where Opportunity Meets Precision
🔥 BTCUSDT.P: Liquidation of Highly Leveraged Longs
🌊 SOLUSDT.P: SOL's Dip - Your Opportunity
🐸 1000PEPEUSDT.P: Prime Bounce Zone Unlocked
🚀 ETHUSDT.P: Set to Explode - Don't Miss This Game Changer
🤖 IQUSDT: Smart Plan
⚡️ PONDUSDT: A Trade Not Taken Is Better Than a Losing One
💼 STMXUSDT: 2 Buying Areas
🐢 TURBOUSDT: Buy Zones and Buyer Presence
🌍 ICPUSDT.P: Massive Upside Potential | Check the Trade Update For Seeing Results
🟠 IDEXUSDT: Spot Buy Area | %26 Profit if You Trade with MSB
📌 USUALUSDT: Buyers Are Active + %70 Profit in Total
🌟 FORTHUSDT: Sniper Entry +%26 Reaction
🐳 QKCUSDT: Sniper Entry +%57 Reaction
📊 BTC.D: Retest of Key Area Highly Likely
📊 XNOUSDT %80 Reaction with a Simple Blue Box!
📊 BELUSDT Amazing %120 Reaction!
📊 Simple Red Box, Extraordinary Results
I stopped adding to the list because it's kinda tiring to add 5-10 charts in every move but you can check my profile and see that it goes on..
PONDUSDT (Marlin) Updated till 23-01-25PONDUSDT (Marlin) Daily timeframe range. 0.01756 defended well we can see the retrace back aftermath. buyers still holding tight. to get out of this range it needs a valid close over 0.02805. if it can long consolidation will push the price up.

EURGBP - Europe will pass this winter safely!?The EURGBP currency pair is below the EMA200 and EMA50 in the 4-hour timeframe and is moving in its descending channel. If the resistance range is broken, we can witness the upward movement of this currency pair. A valid break of the drawn upward trend line will provide us with the downward path of this currency pair to the level of 0.82400.
Bloomberg has reported that the cessation of Russian natural gas flow to Europe via Ukraine is likely to heighten competition with Asia and drive up the cost of alternatives. Ukrainian President Volodymyr Zelensky stated on Wednesday that Ukraine hopes increased gas supplies from the U.S. and other producers to Europe will make prices more acceptable.
The flow of gas from Russia to Europe through Ukraine stopped on Wednesday, marking the end of over five decades of this route being the primary channel for gas to the Eurozone. While this move was anticipated after months of political tension, Europe still needs to replace about 5% of its gas supply and may increasingly rely on storage levels that have now dropped below average.
The European Commission noted that the suspension of gas flow via Ukraine on January 1st was a foreseen scenario, and the EU is prepared for it.
Christine Lagarde, President of the European Central Bank (ECB), expressed optimism that the ECB could achieve a 2% inflation rate by 2025. She stated, “We have made significant progress in reducing inflation in 2024 and hope that 2025 will be the year we reach our target as expected and planned in our strategy. However, we will continue our efforts to ensure inflation stabilizes at the 2% medium-term target.”
Meanwhile, UBS has noted that the value of the U.S. dollar has increased, suggesting that investors can sell dollars more robustly and convert them to currencies such as the British pound or the Australian dollar. Despite the recent rise in the dollar’s value, driven by shifts in expectations around Federal Reserve policies and U.S. government actions, the bank believes the dollar remains overvalued.
While UBS does not anticipate a sharp decline in the dollar’s value in the short term, it sees opportunities for investors to pivot toward more attractive currencies. The British pound (GBP) and Australian dollar (AUD) are among its top picks due to their potential to perform well amidst evolving global monetary conditions.
Additionally, according to data from Nationwide, house prices in the UK reached near-record levels at the end of last year. This indicates that the real estate market continues to gain momentum. Nationwide reported that house prices rose by 0.7% on a monthly basis, reaching an average of £269,426 (equivalent to $337,500). This figure is only slightly below the record high of £273,751 recorded in the summer of 2022.

GBPAUD Bullish Trade Idea from 2.00381-2.0082GBPAUD Bullish Trade Idea
The price fell from the 2.02834 zone and hit back the 2.00381 zone, just respecting the recent support level.
Now the important question is: does the price just test back and wait for the confirmation candle over this zone to reach the next level?
In H4, the bear pressure will increase over time, and the volume increased with sentiments also showing that more volume on the buy side. and the major zone will be tested.
Key level: if the market breaks the support, then we must see at the 1.99567 zone, but on the other side, the Pound index is strong enough.
When the market breaks the 2.00820 level, put buy trade.
Buying zone: 2.00381 - 2.0082
Stop loss: 1.99778
Take Profit Level: 2.0158-2.02763

A trade not taken is better than a losing one!A trade not taken is better than a trade taken from the wrong place.
I find it more accurate and appropriate to wait for this point. The fact that these coins perform well in this atmosphere tells me a lot about their potential.
Don't focus on altcoins in past bulls, new and volume pairs can also do very well. Buy from the right place and wait.

PONDUSDT 1WPOND ~ 1M✅
#POND If you have Conviction on this coin,. Buy gradually after breaking through this resistance line. with a minimum target of 20%+
This trade is high risk. Forget it if you are not interested in this coin.

PONDUSDT (Marlin) Updated till 26-11-24PONDUSDT (Marlin) Daily timeframe range. 0.01590 defended well now PA trying to break its old resistance at 0.02129. a confirm close above 0.02129 can make it room for its next run. and it got lots of space to cover. recent support still at 0.01590.

Marlin (POND)Marlin is an open protocol that provides a high-performance, programmable network infrastructure for DeFi and Web 3.0. Its native utility token, POND, is used for: 1) Running validator nodes on the network via staking; 2) Making and voting on governance proposals to determine how network resources are allocated; and 3) Determining a set of network performance auditors and compensating users from an insurance fund in case of an SLA breach.
Anyway, it is clear from the chart that POND was in a downtrend. Then, POND made a consolidation area in the shape of a triangle and then broke both this area and the major downtrend line. With this, POND started an upward phase that went up to the first horizontal resistance area. But POND couldn't break this horizontal area, and as a result, a correction started. Recently, POND broke the minor downtrend line and is going toward the horizontal resistance area. Let's see if this time POND can break it or not.

GBPUSD Medium cycle GBPUSD was in the bullish channel and now its broken that and its on a supportive level.
According to my last idea,
i said if its hunt the channel sooner that we expected its show the bearish trend power.
Then the bullish channel broke.
but now the price on a supportive level and i think the trend can reversal.
also the DXY confirm that because its in a resistance level.
its show dollar will be weak.
Its just my personal comment please don't trade whit this.
I have no responsibility for your money.

PONDUSDT - Recovery / Continuation PatternAnother AI coin
There is a large overarching Inverted H&S structure if you use the flat base as the H for the structure
Price needs to form the right shoulder and then the next move up can continue
Horizontal line is a light resistance for price and is very achievable
Daily chart

#POND/USDT#POND
The price is moving in a 12-hour bearish channel, is very committed to it, and has just broken through it
We have a green support area at 0.01650 that is expected to be bounced from due to its strength
We have a trend to hold above the Moving Average 100, which is strong support for the rise
We have very strong oversold resistance on the RSI indicator to support the rise with a strong downtrend
Entry price is 0.02300
The first target is 0.02800
The second goal is 0.03260
The third goal is 0.03800

PONDUSDT.4HOn this 4-hour chart for Marlin (POND) against Tether (USDT), the price action is within a critical area of the Ichimoku Cloud, which can offer insights into the market's momentum and potential support and resistance levels.
Ichimoku Cloud: The price is currently sitting just above the Ichimoku Cloud. If it stays above, the Cloud can act as support, suggesting a bullish trend. A drop below the Cloud could signal a shift to a bearish trend.
Trendlines: A descending trendline is visible, which has been acting as resistance. If the price breaks above this line, it might indicate a potential reversal to the upside.
Support (S1): There’s a support level at the green ascending trendline, which if held, could indicate that the price may continue its uptrend.
Resistance (R1): The resistance level is marked above the current price. If the price reaches this level and fails to break through, it could lead to a potential sell-off.
MACD (Moving Average Convergence Divergence): The MACD is below the signal line, suggesting bearish momentum. However, the histogram is showing less negative momentum, which could indicate the possibility of a trend reversal or consolidation.
RSI (Relative Strength Index): The RSI is hovering just under the midline at around 47, which is neither particularly bullish nor bearish.
Conclusion:
I’d watch the price action in relation to the Ichimoku Cloud and the descending trendline. Maintaining above the Cloud and breaking the trendline could offer a bullish signal, in which case I would consider potential long positions with R1 as a target. If the price falls below the Cloud, I’d be cautious of a bearish trend developing and consider any trades accordingly, potentially looking for short opportunities if the trend confirms. The mixed signals from the MACD and RSI suggest it's a critical moment to be vigilant for confirming signs of the future price direction. Trading decisions should be complemented with other analyses and the latest market news.

Trade signal | Marlin (POND) completed a setup for the next pumpHi dear friends, hope you are well and welcome to the new trade setup of Marlin (POND) with US Dollar pair.
Previously we caught almost 92% pump of POND as below:
Now on a 4-hr time frame, POND has formed a bullish Gartley move for the next pump.
Note: Above idea is for educational purpose only. It is advised to diversify and strictly follow the stop loss, and don't get stuck with trade.

PONDUSDT(Marlin) Daily tf Range Updated till 05-02-24PONDUSDT(Marlin) Daily timeframe range. trying to cross over 0.02686 if it can clean than not much of holdup till 0.04068. but that needs for retail interest to keep up and a clean daily close.

POND/USDT LONG#POND
The price has been moving in a sideways channel since July 2022
Moving average 100 was broken to the upside
The fracture test was also repeated again
The current price is 0.01470
First target 0.01634
Second goal 0.02012
Third goal 0.02408

POND/USDT Breaking out the Key resistance. Bullish Momentum ???💎 POND has recently experienced significant developments in the market. Presently, POND has achieved a successful breakout of the key resistance area, effectively breaking free from the confines of the accumulation zone resistance.
💎 This development is indicative of a bullish momentum for future movements, with the probability for the price to undergo a retesting phase before continuing its upward trajectory, ultimately targeting the bearish OB area.
💎 However, if during the retesting phase, POND fails to demonstrate a bounce and instead retraces back into the accumulation zone area, this could be interpreted as a false breakout, potentially leading to a downward movement with the likelihood of reaching the demand or support area.
💎 To maintain its bullish momentum, POND would need to bounce from this point and reclaim the price above the accumulation zone area. Failure to do so could result in a continuation of the downward movement, eventually reaching the strong support area.

Marlin POND Coin Price Prediction🔥 Price on the 4H chart might come at these support area and we might get a potential bounce🔥
Potential bounce areas for Buying 0.01430 and 0.01287
👉 Follow me for More Real Time Opportunities.
Share your Thoughts if you have any?

Trade signal | Marlin (POND) setting up for upto 29.50% pumpHi dear friends, hope you are well and welcome to the new trade setup of Marlin (POND) with US Dollar pair.
Recently we caught almost 92% pump of POND as below:
Now on a daily time frame POND is about to complete a bullish AB=CD move for the next pump.
Note: Above idea is for educational purpose only. It is advised to diversify and strictly follow the stop loss, and don't get stuck with trade.

PONDUSDT Good Potential!PONDUSDT Technical Analysis Update
Buy zone : Below $0.0104
Stop loss : $0.0091
Take Profit 1 : $0.0116
Take Profit 2 : $0.0143
Take Profit 3 : $0.0210
Spot trade
Always Keep StopLoss

Long POND BTC broking down trendAccumulation phase ending, double bottom, nice RR
I see a great opportunity for a bomb in October

2023.9.11 the pound led the rise2023.9.11 the pound led the rise
Hello, I'm Older Duan. Today is Monday, September 11th 2023.
Now it's 17pm Beijing time.
Let me give you a quick comment on the technical forms of the current international mainstream varieties!
First, what we see is the daily graph of the dollar index.
As shown in the figure, the US dollar index fell down today and has already fallen below the daily average of 377 (104.672)!
Now, let's look at gold.
Now you can see the daily chart of gold.
The figure superimposes the combination of gold's recent bottom-up golden section and Fibonacci parameter mean square!
As shown in the figure, gold surged today and is about to challenge the daily level long short divide daily level 55 moving average (1933.70 US dollars)! So, for the rest of today, just use this position as an important point during the day! Above this position, long trading is the main focus; Below this position, short selling is the main focus!
Let's take a look at American crude oil.
What you are now seeing is daily level candle chart of US crude oil. The graph superimposes the recent bottom-up golden section of US crude oil and the Fibonacci parameter mean square combination!
As shown in the figure, US crude oil presents a high level contraction triangular arrangement shape! So, for the rest of today, we will continue to use the monthly level 21 moving average ($86.76) as an important intraday point operation! Above this position, long trading is the main focus; Below this position, short selling is the main focus!
Let's look at EURUSD.
What you can see now is the daily chart of EURUSD.
The figure superimposes the combination of European and American currencies against the recent bottom of the golden section and Fibonacci parameter mean square!
As shown in the figure, the euro strengthened against the US dollar today! So for the continuation period today, just use the highest point on Friday (1.07430) as an important point operation for the day! Above this position, long trading is the main focus; Below this position, short selling is the main focus!
Finally, let's take a look at GBPUSD.
Now you can see the daily chart of GBPUSD.
The figure superimposes the combination of the recent bottom of the GBPUSD against the golden section and the Fibonacci parameter mean square!
As shown in the figure, the pound strengthened against the US dollar today and is about to test the daily level 165 moving average (1.25464)! So for the continuation period today, just use this position as an important point for operation during the day! Above this position, long trading is the main focus; Below this position, short selling is the main focus!
Well, the above is a quick inventory of the technical forms of the international mainstream varieties in today's European period!
Special reminder, today is Monday, and this week there will be US CPI data and "horror data" US retail sales monthly rates. Please pay attention to the risks!
Im Older Duan. Wish you happy win . Goodbye!

Trade suggestion on EURGBPHey guys, my name is Reza, thanks to follow my idea.
Description:
we can find Bearish Order Block on 15m. Also, this chart has 2 other OB (Bullish OB) that shown with Green Zone.
I see RSI14 Bearish Divergence on chart.
To find TP levels, I used Fib Ret.
Drow VP on last movement. High potential level is 0.85361 (close 0.85364, 23.6% Fib Ret.)
Suggestion:
(Strong) My idea (1) Sell-Limit at 0.85709-0.85758 with SL: 0.85771 (can be more)
TP Levels:
0.85654 (more than 95%)
0.85566
0.85504 (High potential)
0.85441 (High potential)
0.85364
My idea (2) Buy-Limit at 0.85469-0.85397 with SL: 0.85384 (can be more)
TP Levels = Fib Levels and price nodes.
(Strong) My idea (3) Buy-Limit at 0.85323-0.85281 with SL: 0.85263 (can be more)
TP Levels = Fib Levels and price nodes.
Note: This currency pair have medium important news*
