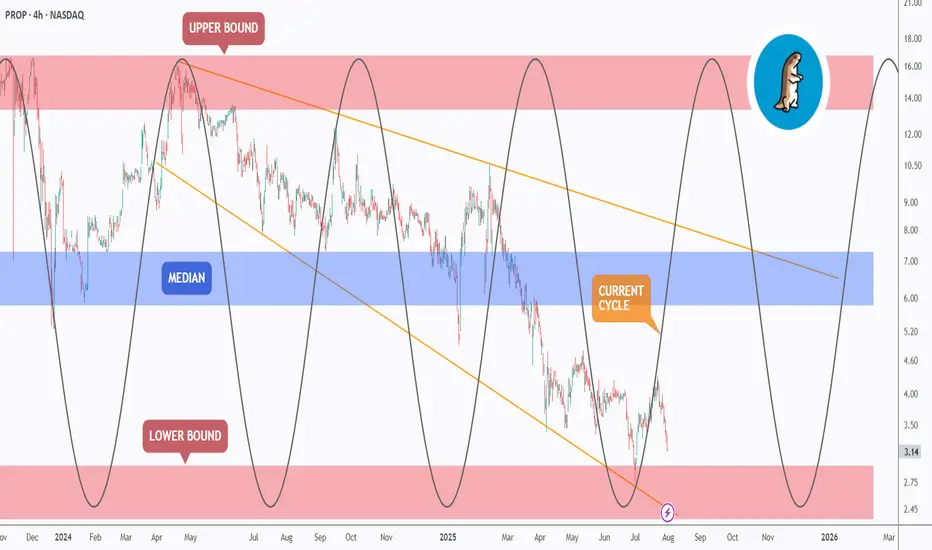
PROP - Riding the Cycle? The Next Wave May Just Be Starting!Markets move in cycles; and PROP is no exception.
If you’ve been following our previous analyses, you’ll recognize the accumulation zone we highlighted earlier. Well, this updated chart adds another layer: the cyclical rhythm of price action.
🔁As shown, PROP has been moving in clearly defined waves, bouncing between key zones with consistency. The current cycle appears to have bottomed — once again — inside the lower bound, where strong demand continues to hold.
We’re now in the early phase of what could be a fresh bullish cycle. If the rhythm plays out as before, the path of least resistance could take us toward the median zone ($6.5 - $7.5) and possibly all the way back to the upper bound ($15 - $17) by late 2025 or early 2026.
🔍 Supporting Fundamentals
While the chart speaks volumes, the fundamentals back it up:
Energy demand is surging globally, fueled by AI, data centers, and electric infrastructure — all of which require massive power capacity.
Oil and gas remain essential in this transition phase, especially with renewable infrastructure still years away from matching base-load demand.
PROP (Prairie Operating Co.) controls 65,000 acres in the DJ Basin — one of the most productive oil regions in the U.S. With advanced drilling tech and low-cost operations, PROP is well-positioned to ride out volatility and capitalize on rising demand.
🎯 Key Zones to Watch
- Support: $2.5–$3
- Median target: $6.5–$7.5
- Macro resistance: $15–$17
📌 We’re not just seeing structure — we’re seeing rhythm, confluence, and timing align.
If this cycle continues to play out, PROP might just be preparing for its next major wave.
Are you ready to catch it?
🧠 Previous posts and technical breakdowns are attached for full context.
➡️ As always, speak with your financial advisor and do your own research before making any investment decisions.
📚 Always follow your trading plan => including entry, risk management, and trade execution.
Good luck!
All strategies are good, if managed properly.
~ Richard Nasr
Portfolio
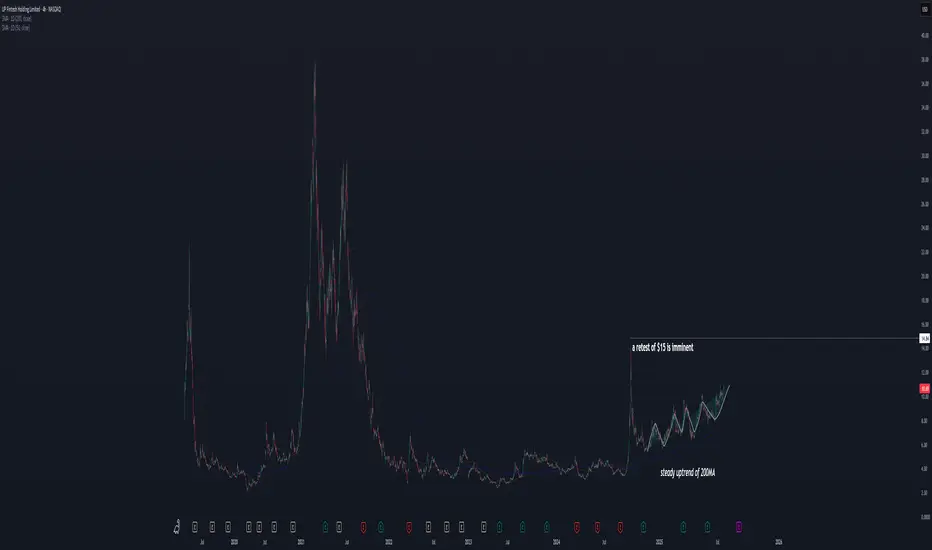
Next Robinhood? TIGR, a hidden gem.We all know the story about retail going crazy on $HOOD. But what about its SEA counterpart, TIGR? Will our SEA friends follow the same trend?
With more and more retail traders rushing to the stock market, TIGR is a safe grab to get on the retail frenzy.
This is also supported from a technical side:
1) a zigzag pattern trending up,
2) a slow and steady uptrend of the 200MA,
3) 3 consecutive earning beats during the last 3 quarters.
All these is suggesting that a retest of the previous high at $15 will happen very soon, if not more (I think there will be more upside, but I have to wait and see how patterns develop when the previous high will be tested).
I am holding TIGR I purchased at 9.55 with a 2.3% portfolio size, with the expectation of reaching at least $15 before/around Oct.
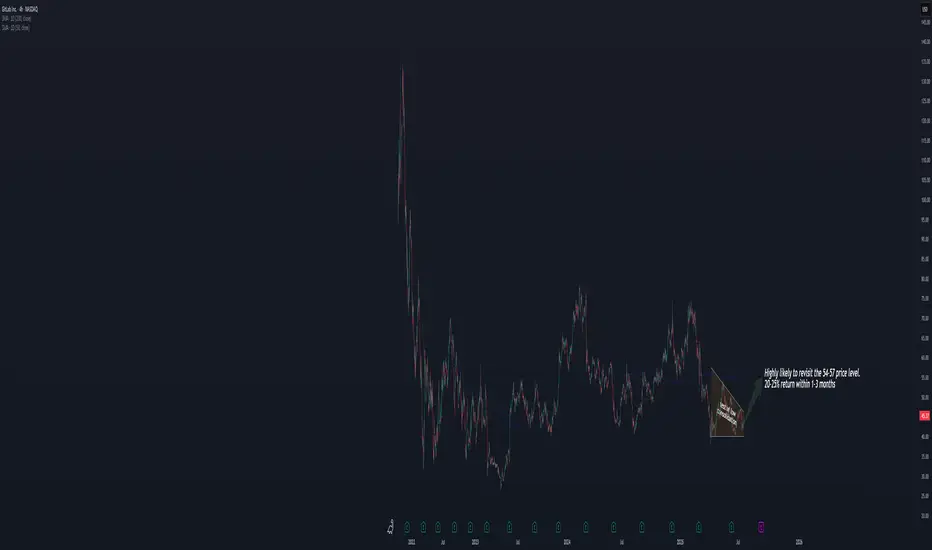
Worst Behind GTLB. Do you think the worst is behind for GTLB?
With news of senior management selling stock share and the downgrade, we see a clear test of low since April this year. Since the news always come out the latest, the decline during the last 3 months is likely the explaination to the selling pressure we have seen.
However, the bottom is well defended structural-wise, supported by a slow and steady increase in company revenue.
My expectation is that at least we should see a retest around the 200MA.
I am adding GLTB to my portfolio at a 3% position size.
Gold: Potential Correction on the Horizon?Gold has long been regarded as a safe haven asset, drawing the attention of investors during periods of economic uncertainty. In recent years, gold prices have reached historic highs, fueled by inflation concerns, geopolitical tensions, and shifts in monetary policy. However, as with any asset experiencing a prolonged rally, the question arises: Is a correction in gold prices imminent?
Understanding the Recent Gold Rally
Several factors have contributed to gold’s impressive performance:
Inflation Hedge: Persistent inflation has driven investors toward gold as a store of value.
Geopolitical Risks: Ongoing conflicts and global tensions have increased demand for safe haven assets.
Monetary Policy: Central banks’ dovish stances and low interest rates have made non-yielding assets like gold more attractive.
Several scenarios could catalyze a correction in gold prices:
Unexpected Economic Recovery: Stronger-than-expected economic data could reduce demand for safe haven assets.
Aggressive Rate Hikes: Faster-than-anticipated interest rate increases could shift investor preference away from gold.
Resolution of Geopolitical Tensions: Any de-escalation in major geopolitical hotspots may dampen gold’s appeal.
#gold #commodity #commodities #metals #trading #portfolio

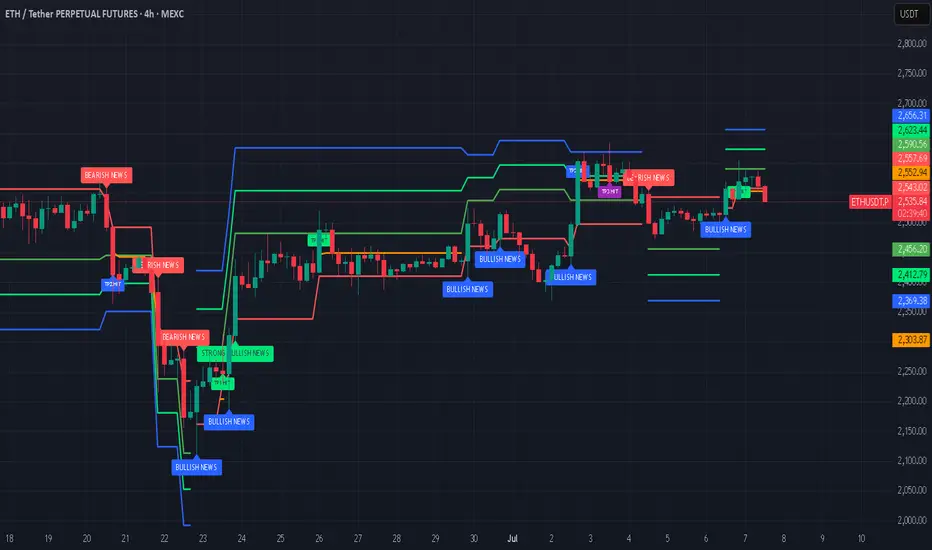
ETH - Should I go long?Ethereum (ETH) is currently positioned at a critical juncture, with multiple technical and fundamental indicators suggesting the potential for a significant move ahead.
Current Price and Momentum: As of the latest real-time data, ETH is trading at $2,549.97, having recently started a fresh increase above the $2,520 zone. The price is above both the $2,550 level and the 100-hourly Simple Moving Average, indicating short-term bullish momentum.
Key Resistance Levels: The immediate resistance is near $2,600, followed by $2,620 and a major barrier at $2,650. A decisive break above $2,650 could open the path toward $2,720 and potentially $2,800 in the near term.
Support Levels: On the downside, $2,520 is a key support zone. A sustained drop below this could trigger declines toward $2,500 or even $2,420, but as long as ETH holds above $2,520, the bullish structure remains intact.
On-Chain and Institutional Signals: Long-term holders have been accumulating ETH, and institutional inflows have surged, with over $750 million invested recently. This accumulation, alongside strong ETF inflows and rising staking activity, points to growing confidence and could act as a catalyst for a major price move.
Technical Patterns: ETH is consolidating above critical moving averages and within bullish chart formations (such as ascending triangles and coiling structures). These patterns often precede significant breakouts, especially when accompanied by increasing trading volumes and improving momentum indicators.
Market Sentiment: While short-term indicators show some cooling, the broader trend remains bullish. Analysts note that if ETH can break above the current resistance cluster, it could ignite a new wave of bullish momentum and set the stage for a broader breakout.
In summary: Ethereum is at a pivotal resistance zone. If it can break and hold above $2,600–$2,650, analysts expect a strong move higher, with targets at $2,800. Institutional inflows, strong on-chain accumulation, and bullish technical setups all support the case for a significant upside move in the coming weeks or months, provided key support levels are maintained.
Note that a possible correction of Bitcoin (which essentially will result in a drop of the entire crypto market) is possible in the next weeks.
#crypto #eth #btc #bitcoin #ethereum #analysis #trading #portfolio #long #algorithm #buysellsignals #tradingsignals #bullrun
Will Ripple "leave a dent in the universe"?They called us crazy, when we bought xrp at the bottom, in the midst of court cases. What they don't see is that, many TODAY major companies that changed the world (e.g. Apple, Amazon, MSFT etc.) had long term court cases with the SEC before "leaving a dent in the universe". In our opinion, Ripple is next in line.
#xrp #crypto #bitcoin #ripple #banking #blockchain #finance #money #stablecoin #financialsystem

Crypto Stocks to the moon?NASDAQ:MSTR , along with numerous other publicly traded companies with significant cryptocurrency exposure, experienced a remarkable rally during the previous crypto bull market. There are indications that a similar dynamic could be emerging once again.
#bitcoin #crypto #stocks #stockmarket #portfolio

Tesla-Heading For A New ATH?NASDAQ:TSLA is looking good!
Robo-Taxi, Optimus Robots...and so more to come!
Tesla to $692 in the next years? Or months?
#stocks #tesla #stockmarket

What Is T-Distribution in Trading? What Is T-Distribution in Trading?
In the financial markets, understanding T-distribution in probability is a valuable skill. This statistical concept, crucial for small sample sizes, offers insights into market trends and risks. By grasping T-distribution, traders gain a powerful tool for evaluating strategies, risks, and portfolios. Let's delve into what T-distribution is and how it's effectively used in the realm of trading.
Understanding T-Distribution
The T-distribution in probability distribution plays a crucial role in trading, especially in situations where sample sizes are small. William Sealy Gosset first introduced it under the pseudonym "Student". This distribution resembles the normal distribution with its bell-shaped curve but has thicker tails, meaning it predicts more outcomes in the extreme ends than a normal distribution would.
A key element of T-distribution is the concept of 'degrees of freedom', which essentially refers to the number of values in a calculation that are free to vary. It's usually the sample size minus one.
The degrees of freedom affect the shape of the T-distribution; with fewer degrees of freedom, the distribution has heavier tails. As the degrees of freedom increase, the distribution starts to resemble the normal distribution more closely. This is particularly significant in trading when dealing with small data sets, where the T-distribution provides a more accurate estimation of probability and risk than the normal distribution.
T-Distribution vs Normal Distribution
T-distribution and normal distribution are foundational in statistical analysis, yet they serve different purposes. While both exhibit a bell-shaped curve, the T-distribution has thicker tails, implying a higher probability of extreme values. This makes it more suitable for small sample sizes or when the standard deviation is unknown.
In contrast, the normal distribution, with its thinner tails, is ideal for larger sample sets where the standard deviation is known. Traders often use T-distribution for more accurate analysis in small-scale or uncertain data scenarios, while normal distribution is preferred for larger, more stable datasets, where extreme outcomes are less likely.
Application in Trading
In trading, T-distribution is a valuable tool for analysing financial data. It is primarily used in constructing confidence intervals and conducting hypothesis testing, which are essential for making informed trading decisions.
For instance, a trader might use T-distribution to test the effectiveness of a new trading strategy. Suppose a trader has developed a strategy using the technical analysis tools and wants to understand its potential effectiveness compared to the general market performance. They would collect a sample of returns from this strategy over a period, say, 30 days. Given the small sample size, using T-distribution is appropriate here.
The trader would then calculate the mean return of this sample and use T-distribution to create a confidence interval. This interval would provide a range within which the true mean return of the strategy is likely to lie, with a certain level of confidence. If this confidence interval shows a higher mean return than the market average, the trader might conclude that the strategy is potentially effective. However, it's important to note that this is an estimation and not a guarantee of future performance.
How to Plug Probability and Normal Distribution in Your T-Calculation
To use a T-calculator for integrating probability and normal distribution, follow these steps:
- Input Degrees of Freedom: For T-distribution, calculate the degrees of freedom (sample size minus one).
- Convert Z-Score to T-Value: If using normal distribution data, convert the Z-score (standard deviation units from the mean in a normal distribution) to a T-value using the formula: T = Z * (sqrt(n)), where 'n' is the sample size.
- Enter T-Value: Input this T-value into the calculator.
- Calculate Probability: The calculator will then output the probability, providing a statistical basis for trading decisions based on the T-distribution.
Limitations and Considerations of T-Distribution
While T-distribution is a powerful tool in trading analysis, it's important to recognise its limitations and considerations:
- Sample Size Sensitivity: T-distribution is most effective with small sample sizes. As the sample size increases, it converges to a normal distribution, reducing its distinct utility.
- Assumption of Normality: T-distribution assumes that the underlying data is approximately normally distributed. This may not hold true for all financial data sets, especially those with significant skewness or kurtosis.
- Degrees of Freedom Complications: Misestimating degrees of freedom can lead to inaccurate results. It's crucial to calculate this correctly based on the sample data.
- Outlier Sensitivity: T-distribution can be overly sensitive to outliers in the data, which can skew results.
Advanced Applications of T-Distribution in Trading
T-distribution extends beyond basic trading applications, playing a role in advanced financial analyses:
- Risk Modelling: Utilised in constructing sophisticated risk models, helping traders assess the probability of extreme losses.
- Algorithmic Trading: Integral in developing complex algorithms.
- Portfolio Optimisation: Assists in optimising portfolios by estimating returns and risks of various assets.
- Market Research: Used in advanced market research methodologies to analyse small sample behavioural studies.
The Bottom Line
The T-distribution is a powerful tool, offering nuanced insights in scenarios involving small sample sizes or uncertain standard deviations. Its ability to accommodate real-world data's quirks makes it invaluable for various trading applications, from strategy testing to risk assessment. However, understanding its limitations and proper application is crucial for accurate analysis.
This article represents the opinion of the Companies operating under the FXOpen brand only. It is not to be construed as an offer, solicitation, or recommendation with respect to products and services provided by the Companies operating under the FXOpen brand, nor is it to be considered financial advice.

Gold Price to Blackrock Traditional 60/40 Portfolio AllocationThis chart is the ratio between the Gold price and the Blackrock Traditional 60/40 Portfolio Allocation

How to Apply Modern Portfolio Theory (MPT) to Trading?How to Apply Modern Portfolio Theory (MPT) to Trading?
Harry Markowitz’s Modern Portfolio Theory revolutionised investing by providing a structured way to balance potential risk and returns. By focusing on diversification and understanding how assets interact, MPT helps traders and investors build efficient portfolios tailored to their goals. This article explores “What is MPT,” the core principles of MPT, its practical applications, and its limitations, offering insights into why it remains a foundational concept in modern finance.
What Is Modern Portfolio Theory?
Modern Portfolio Theory (MPT) is a financial framework designed to help investors build a portfolio that balances potential risk and returns in the most efficient way possible. Introduced by economist Harry Markowitz in 1952, MPT is grounded in the idea that diversification—spreading investments across different assets—can reduce overall risk without necessarily sacrificing returns.
At its core, MPT focuses on how assets within a portfolio interact with each other, not just their individual performance. Each asset has two key attributes: expected return, which represents the potential gains based on historical performance, and risk, often measured as the volatility of those returns.
The theory emphasises that it’s not enough to look at assets in isolation. Instead, their relationships—measured by correlation—are critical. For instance, combining assets that move in opposite directions during market shifts can stabilise overall portfolio performance.
A central concept of Markowitz’s model is the efficient frontier. This is a graphical representation of portfolios that deliver the highest possible return for a given level of risk. Portfolios below the efficient frontier are considered suboptimal, as they expose investors to unnecessary risk without sufficient returns.
MPT also categorises risk into two types: systematic risk, which affects the entire market (like economic recessions), and unsystematic risk, which is specific to an individual company or sector. Diversification can only address unsystematic risk, making asset selection a key part of portfolio construction.
To illustrate, imagine a portfolio that mixes equities, bonds, and commodities. Equities may offer high potential returns but come with volatility. Bonds and commodities, often less correlated with stocks, can act as stabilisers, potentially reducing overall risk while maintaining growth potential.
The Core Principles of MPT
Markowitz’s Portfolio Theory is built on a few foundational principles that guide how investors can construct portfolios to balance potential risk and returns.
1. Diversification Reduces Risk
Diversification is the cornerstone of MPT. By spreading investments across different asset classes, industries, and geographic regions, traders can reduce unsystematic risk. For example, holding shares in both a tech company and an energy firm limits the impact of a downturn in either industry. The idea is simple: assets that behave differently in various market conditions create a portfolio that’s less volatile overall.
2. The Risk-Return Trade-Off
Investors face a constant balancing act between potential risk and returns. Higher potential returns often come with higher risk, while so-called safer investments tend to deliver lower potential returns. MPT quantifies this relationship, allowing investors to choose a risk level they’re comfortable with while maximising their potential returns. For instance, a trader with a low risk tolerance might lean towards a portfolio with bonds and dividend-paying stocks, whereas someone with a higher tolerance may include more volatile emerging market equities.
3. Correlation Matters
One of MPT’s key insights is that not all assets move in the same direction at the same time. The correlation between assets is crucial. Low or negative correlation—where one asset tends to rise as the other falls—helps stabilise portfolios. For example, government bonds often perform well when stock markets drop, making them a popular addition to equity-heavy portfolios.
How the MPT Works in Practice
Modern Portfolio Theory takes theoretical concepts and applies them to real-world investment decisions, helping traders and investors design portfolios that align with their goals and risk tolerance. Here’s how it works step by step.
The Efficient Frontier in Action
The efficient frontier is a visual representation of optimal portfolios. Imagine plotting potential portfolios on a graph, with risk on the x-axis and expected return on the y-axis. Portfolios on the efficient frontier offer the highest possible return for each level of risk. For example, if two portfolios have the same level of risk but one offers higher returns, MPT identifies it as the better choice. Investors aim to build portfolios that lie on or near this frontier.
Portfolio Optimisation
The goal of Markowitz’s portfolio optimisation is to combine assets in a way that balances potential risk and returns. This involves analysing the expected returns, standard deviations (volatility), and correlations of potential investments. For instance, a mix of stocks, government bonds, and commodities might be optimised to maximise possible returns while minimising overall portfolio volatility. Technology, like portfolio management software, often assists in running complex Modern Portfolio Theory formulas, like expected portfolio returns, portfolio variance, and risk-adjusted returns.
Risk-Adjusted Metrics
Investors also evaluate portfolios using metrics like the Sharpe ratio, which measures returns relative to risk. A higher Sharpe ratio typically indicates a more efficient portfolio. For example, a portfolio with diverse holdings might deliver similar returns to one concentrated in equities but with less volatility.
Adaptability to Changing Markets
While the theory relies on historical data, Markowitz’s Portfolio Theory is adaptable. Investors frequently rebalance their portfolios, adjusting asset allocations as markets shift. For example, if equities outperform and dominate the portfolio, a trader may sell some and reinvest in bonds to maintain the desired risk level.
Limitations and Criticisms of MPT
Modern Portfolio Theory has reshaped how we think about investing, but it’s not without its flaws. While it offers a structured framework for balancing possible risk and returns, its assumptions and practical limitations can present challenges.
Assumption of Rational Behaviour
MPT assumes that investors always act rationally, basing decisions on logic and complete information. In reality, emotions, biases, and unpredictable behaviour play significant roles in markets. For example, during a financial crisis, fear can lead to widespread selling, regardless of an asset’s theoretical value.
Ignoring Tail Risks
The model underestimates the impact of extreme, rare events, known as tail risks. These events, including economic collapses or geopolitical crises, can significantly disrupt even well-diversified portfolios.
Dependence on Historical Data
The theory relies on historical data to estimate risk, returns, and correlations. However, past performance doesn’t always reflect future outcomes. During major market disruptions, correlations between assets—normally stable—can spike, reducing the effectiveness of diversification. For instance, in the 2008 financial crisis, many traditionally uncorrelated assets fell simultaneously.
Simplified Risk Measures
MPT equates risk with volatility, which doesn’t always capture the full picture. Sharp price swings don’t necessarily mean an asset is risky, and relatively stable prices don’t guarantee reliability. This narrow definition can lead to overlooking other important factors, like liquidity or credit risk.
How Investors and Traders Use MPT Today
Modern Portfolio Theory remains a cornerstone of investment strategy, and its principles are widely applied in portfolio construction, asset allocation, and diversification.
Portfolio Construction and Asset Allocation
Central to Modern Portfolio Theory is asset allocation: determining the optimal mix of assets based on an investor’s risk tolerance and goals. A classic example is the 60/40 portfolio, which allocates 60% to equities for growth and 40% to bonds for so-called stability. This balance aims to provide steady possible returns with reduced volatility over time.
Another well-known approach is Ray Dalio’s All-Weather Portfolio, designed to perform across various economic conditions. It includes:
- 30% stocks
- 40% long-term bonds
- 15% intermediate bonds
- 7.5% gold
- 7.5% commodities
This portfolio reflects MPT's emphasis on diversification and risk management, spreading investments across asset classes that respond differently to market shifts.
Alternative Investments and Diversification
MPT has evolved to include alternative investments like real estate, private equity, crypto*, hedge funds, and even carbon credits. These assets often have lower correlations with traditional markets, enhancing diversification. For example, real estate might perform well during inflationary periods, offsetting potential declines in equities.
Investors also consider geographic diversification, combining domestic and international assets to balance regional risks.
Implications for Traders
While MPT is often associated with long-term investing, its principles can inform trading strategies. For instance, traders might diversify their positions across uncorrelated markets, such as equities and commodities, to reduce overall portfolio volatility. Dynamic position sizing—adjusting exposure based on market conditions—also aligns with MPT’s risk-return framework.
The Bottom Line
The Modern Portfolio Theory offers valuable insights into balancing possible risk and returns, helping traders and investors create diversified, resilient portfolios. While it has its limitations, MPT’s principles remain widely used in portfolio construction and trading strategies.
FAQ
What Is the Modern Portfolio Theory?
The Modern Portfolio Theory (MPT) is a framework that helps investors construct portfolios to balance possible risk and returns. It emphasises diversification, using statistical analysis to combine assets with varying risk and return profiles to reduce volatility and optimise potential income.
What Are the Two Key Ideas of Modern Portfolio Theory?
MPT focuses on two main concepts: diversification and the risk-return trade-off. Diversification spreads investments across assets to potentially reduce risk, while the risk-return trade-off seeks to maximise possible returns for a given level of risk.
What Are the Most Important Factors in Modern Portfolio Theory?
Key factors include expected returns, risk (measured by volatility), and correlation between assets. These elements determine how assets interact within a portfolio, enabling investors to build an efficient mix that aligns with their risk tolerance and goals.
What Are the Disadvantages of Modern Portfolio Theory?
MPT assumes rational behaviour and relies on historical data, which does not predict future market behaviour. It also underestimates extreme events and simplifies risk by equating it solely with volatility.
*Important: At FXOpen UK, Cryptocurrency trading via CFDs is only available to our Professional clients. They are not available for trading by Retail clients. To find out more information about how this may affect you, please get in touch with our team.
This article represents the opinion of the Companies operating under the FXOpen brand only. It is not to be construed as an offer, solicitation, or recommendation with respect to products and services provided by the Companies operating under the FXOpen brand, nor is it to be considered financial advice.

Momentum Trading Strategies Across AssetsMomentum trading is a strategy that seeks to capitalize on the continuation of existing trends in asset prices. By identifying and following assets exhibiting strong recent performance—either upward or downward—traders aim to profit from the persistence of these price movements.
**Key Components of Momentum Trading:**
1. **Trend Identification:** The foundation of momentum trading lies in recognizing assets with significant recent price movements. This involves analyzing historical price data to detect upward or downward trends.
2. **Diversification:** Implementing momentum strategies across various asset classes—such as equities, commodities, currencies, and bonds—can enhance risk-adjusted returns. Diversification helps mitigate the impact of adverse movements in any single market segment.
3. **Risk Management:** Effective risk management is crucial in momentum trading. Techniques such as setting stop-loss orders, position sizing, and continuous monitoring of market conditions are employed to protect against significant losses.
4. **Backtesting:** Before deploying a momentum strategy, backtesting it against historical data is essential. This process helps assess the strategy's potential performance and identify possible weaknesses.
5. **Continuous Refinement:** Financial markets are dynamic, necessitating ongoing evaluation and adjustment of trading strategies. Regularly refining a momentum strategy ensures its continued effectiveness amid changing market conditions.
**Tools and Indicators:**
- **Relative Strength Index (RSI):** This momentum oscillator measures the speed and change of price movements, aiding traders in identifying overbought or oversold conditions.
- **Moving Averages:** Utilizing short-term and long-term moving averages helps in smoothing out price data, making it easier to spot trends and potential reversal points.
**Common Pitfalls to Avoid:**
- **Overtrading:** Excessive trading can lead to increased transaction costs and potential losses. It's vital to adhere to a well-defined strategy and avoid impulsive decisions.
- **Ignoring Market Conditions:** Momentum strategies may underperform during sideways or choppy markets. Recognizing the broader market environment is essential to adjust strategies accordingly.
By understanding and implementing these components, traders can develop robust momentum trading strategies tailored to various asset classes, thereby enhancing their potential for consistent returns.
Source: digitalninjasystems.wordpress.com
How to pick a benchmark for you portfolio and beat the market What is a benchmark?
A benchmark is an index or a basket of assets used to evaluate the performance of an investment portfolio In the context of portfolio analysis the benchmark serves as a point of comparison to determine whether a fund a strategy or an investment is performing better worse or in line with the reference market.
In the current chart, Bitcoin ( BINANCE:BTCUSDT ) is displayed with a solid and larger blue line in relation to other cryptocurrencies for the current period.
Benchmarks are essential tools for institutional and private investors as they allow measuring the effectiveness of asset allocation choices and risk management Additionally they help determine the added value of an active manager compared to a passive market replication strategy.
Benchmark analysis example: NASDAQ:TSLA - NASDAQ:NDX
Benchmark analysis example: NASDAQ:TSLA - NASDAQ:AAPL - NASDAQ:NDX
What is the purpose of a benchmark
The use of a benchmark in portfolio analysis has several objectives
1) Performance Evaluation: Provides a parameter to compare the portfolio's return against the market or other funds
2) Risk Analysis: Allows comparing the volatility of the portfolio against that of the benchmark offering a measure of risk management
3) Performance Attribution: Helps distinguish between returns derived from asset selection and those linked to market factors
4) Expectation Management: Supports investors and managers in assessing whether a portfolio is meeting expected return objectives
5) Strategy Control: If a portfolio deviates excessively from the benchmark it may signal the need to review the investment strategy
How to select an appropriate benchmark?
The choice of the correct benchmark depends on several factors:
1) Consistency with Portfolio Objective: The benchmark should reflect the market or sector in which the portfolio operates
2) Representativeness of Portfolio Assets: The benchmark should have a composition similar to that of the portfolio to ensure a fair comparison
3) Transparency and Data Availability: It must be easily accessible and calculated with clear and public methodologies
4) Stability Over Time: A good benchmark should not be subject to frequent modifications to ensure reliable historical comparison
5) Compatible Risk and Return: The benchmark should have a risk and return profile similar to that of the portfolio
Most used benchmarks
There are different benchmarks based on asset type and reference market Here are some of the most common.
Equity
FRED:SP500 Representative index of the 500 largest US companies.
NYSE:MSCI World Includes companies from various developed countries ideal for global strategies
FTSE:FTSEMIB Benchmark for the Italian stock market
NASDAQ:NDX Represents the largest technology and growth companies
Bonds
Barclays Global Aggregate Bond Index Broad benchmark for the global bond market
JP Morgan Emerging Market Bond Index EMBI Benchmark for emerging market debt
[* ]BofA Merrill Lynch US High Yield Index Representative of the high-yield bond market junk bonds
Mixed or Balanced
6040 Portfolio Benchmark 60 equities SP 500 and 40 bonds Bloomberg US Aggregate used to evaluate balanced portfolios
Morningstar Moderate Allocation Index Suitable for moderate-risk investment strategies
Alternative
HFRI Fund Weighted Composite Index Benchmark for hedge funds
Goldman Sachs Commodity Index GSCI Used for commodity-related strategies
Bitcoin Index CoinDesk BPI Benchmark for cryptocurrencies
A reference benchmark is essential in portfolio analysis to measure performance manage risk and evaluate investment strategies The selection of an appropriate benchmark must be consistent with the strategy and market of the portfolio to ensure meaningful comparison.
Understanding and correctly selecting the benchmark allows investors to optimize their decisions and improve long-term results.

$BTC 1W Largest Scale Playing with Long Term Ideas #LongThis idea i made today for long term idea just as it is an idea some basic lines and formations were made but it was pretty simple using same red lines the decline lines are same angle as it states. showing prices and times as estimates i will come look at this and progression when iI m older and know more of this trading and chart mechanics etc!
I am not a Financial advisor or any way good with number.. sorry that's a lie I am very good with math but I haven't had to make financial gains on markets not crypto at least.! I have crypto but earned it all freely over short time last 2 years have over a few band only a couple,, but free earned and mostly passive about 70% passive :) anyway and so that makes it all gains but i do swap stuff at lows and highs and various coin swaps using special maths and tools no one else does a lot and take advantage of the "virtual arbitrage" between trading oone coin for another and then another .... if you get it you get it!
WHAT YOU THINK OF IDEA its one for me to come back to in years and look and go wow we were at 100k moment JUST like the 10k moment. Only I don't remember It so well!
hope you enjoy! let me know your opinion and what could be wrong or different! lets learn from one another and take over the markets!!!!

Nifty Index about to witness Quarterly Bearish Engulfing4 and a half years from April 2020, it has been a euphoric ride for India's Nifty and Sensex.
If prices remain more or less unchanged by New Year's Eve, we're about to witness a once in 5 year event on the charts. A "quarterly bearish engulfing" at all time highs. In simpler terms, quarterly prices closing below the lowest price of previous quarter.
What has happened in the past when this happened?
This happened last in 2020 (the deep red pandemic candle) - where 15 quarters or nearly 4 years of gain was wiped out in a single quarter.
Before that, it happened in 2015 - where it took 3 quarters to wipe out 4 quarters or 1 year worth of gain. (Indicating more of a systemic sell-off, than a knee-jerk news based panic. Something similar is happening now, after a long long time.)
2015, then 2020, and now 2024-25. For those who understand time cycles in nature and its inevitable influence on our nature, and thus the markets, you'd appreciate this is no co-incidence.
There is no reason to panic, as this, just like any other event, presents an opportunity to grow wealth.
Before you read further, I intend to keep this idea beginner friendly on how to potentially benefit from this opportunity. It can form a base for you to navigate your personal finance journey further. Intermediate and advanced traders/investors may benefit from my other (future) posts. Kindly note that this published note is only my opinion, solely for educational purposes, and not investment advice.
Through the remainder of this piece, I will waltz you through the most probable outcomes and the possible decisions one may take, all assuming that you're relatively new to witnessing a systematic sell-offs.
Understanding the logic of a bearish engulfing pattern:
First - What a bearish engulfing candlestick pattern on a quarterly time frame means is that
for 1 whole quarter, there was a net gain (July-Sept2024 = +7.5%) and the lowest price was 23893.7; whilst immediately for next 1 whole quarter (Oct- 30Dec2024 = -8.49%) we can see a net loss. Not only do we see a net loss, but also most importantly, we see quarter price "closing" lower than the "lowest" price of previous quarter . This is powerful information as it indicates that buyers have "failed to remain in strength" even at the lowest price of the previous quarter (Understand that the lowest price of previous quarter is where the buyers were the most powerful in that quarter, that is why it was the "lowest" price of that quarter because the price went up from there). For reference, see the feature image of this post again.
What does this mean for the next few weeks/months/quarters: (The most probably outcomes)
1) Normally, a bearish engulfing pattern at the top of the charts indicates end of an existing up-trend. When this happens in a higher time frame (weekly/monthly/quarterly), it is more reliable.
2) End of an existing up-trend indicates beginning of a new opposite trend. An opposite trend can either be sideways or downside. This depends on further reaction from market forces in the coming days. We can see that after the pandemic quarterly crash, we had no opposite trend, in fact, there was an immediate rebound. This was an exception as pandemic market crash was a 1 time panic-led sell-off rather than a systemic sell off (which is more sustainable time-wise).
3) We are highly likely in a systemic sell off now, if this quarter's low is taken out in January. This is the highest likely scenario after a 4.5 years of euphoric uptrend in the market.
How to benefit in the following weeks/months:
The simplest way with minimal to moderate time investment, is to begin SIP in fundamentally strong "value" stocks, or the index itself, or both - in a "pyramid" fashion.
Once you select the stocks, pyramiding your investment amount - that is, starting small at current levels and scaling up your investment as you get better prices when Nifty (or your cherry picked stocks) fall further.
A simple way to apply it is to buy whenever price is near the Moving Averages (MA) of 55 weeks, 89 weeks and 233 weeks - as the index continues in a down trend in the following weeks/months. You can plot these on Tradingview with ease. Remember to plot on weekly time frame. Buy lower multiples at 55 MA, higher at 89 MA and even higher at 233 MA.
This is a simple, more optimised way of buying the index fund which can help you get higher ROI as compared to someone making SIP on a fixed date every month. This is because your average buy price will be lower than someone buying the same quantity at random prices every month.
Yet another way is to learn the skill of selling index call options by hedging them. Even though this is a slightly advance way of generating extra income, it is great to learn in downtrending markets - as you will be able to generate profits from a decline in the price of index (remember it is a lot more difficult to generate profits from individual stocks and investments in a broader down-trending market). A realistic expectation for beginners can be making 1-3% a month with this technique (average annualised) - thus helping offset the loss in the existing stocks/MF portfolio.
If this sounds difficult, yet another way is assessing the hygiene of your portfolio and rejig the holdings if needed. Without proper knowledge, it is best to let a qualified financial advisor/expert review your holdings/portfolio and see if they want to re-shuffle the portfolio. This could even mean reducing exposure to equity for a period of 1 year, and increase exposure to debt funds or other fixed income avenues, or simply sitting on some % cash to buy at a later, better value. Whilst this sounds too much work, remember that a mere 4-5% extra gain for the entire year, every year, compounds to a large number over the years. So entrusting a reliable financial advisor to do this could be worth your time and resources. Now is a good time to do that.
Disclaimer:
This is my personal opinion and is only for educational purposes. Please consult your financial advisor before making any decision. Stock Market investments are subject to market risk. Past performances are no guarantee of future returns.
This content above is solely for educational purposes only and to provide information and is not intended to give any advice. Information shared is personal opinions only. Wherever any stock or mutual fund name is mentioned, this is only for educational and informational purposes. Share market and investment can be risky, please take professional advice before making any decision.


Portfolio and the Sensex Correction AnalysisMy personal Portfolio performance against the Indian markets, all with holding period of 1 year to 3 years. (No single stock in the portfolio taken with tips from others, brokers, TV. All research on my own, using Fundamental / Technical analysis learned over past 20 years of weekends).
This includes stocks sold, dividend received, no mutual funds included:
The portfolio has had a draw down of 7.5% from peak from 2 months ago to bottom 1 week ago which was a market correction of 11%
A lot of the Ideas i have been posting over the years on trading view platform were part of my portfolio, when i analyzed a stock i thought i should share. I stop sharing when i didn't have time or had personal issues.
I thought i should share my performance on the platform which has helped me analyse.

Portfolio-and-Sensex-after-recent-11-correctionMy personal Portfolio performance against the Indian markets, all with holding period of 1 year to 3 years. (No single stock in the portfolio taken with tips from others, brokers, TV. All research on my own, using Fundamental / Technical analysis learned over past 20 years of weekends).
This includes stocks sold, dividend received, no mutual funds included:
The portfolio has had a draw down of 7.5% from peak from 2 months ago to bottom 1 week ago, during which Sensex had a correction of 11%.
During correction, i sold weak stocks and accumulated strong ones at the 200d EMA support.
I used Tradingview for all my technical analysis and thought it right to share my performance on this platform.
I am a student of the stock market, i do not recommend, nor take recommendations . Best thing if you don't have the time to do research and the analysis or learn it, as it is a full time job, stick to mutual funds and that too SIP. Or take recommendation from only SEBI registered and experts analysts preferably a authorised portfolio manager.
Disclaimer: i have never recommended stocks, all part of my educational purpose and sharing my analysis for feedback purposes only.

TESLA : Opportunity Time!Hello Team,
Tesla is down almost 75% from the ATH, we are at the bottom of the formation with a corresponding support level. The weekly RSI level is also oversold.
Now is a good time to start opening positions for your long-term stock portfolio.
Enjoy!

How I Position Size: sizing positions as an active investorHey, guys. Wanted to cover a brief overview of how I size my positions of late as I think about how to invest/trade a trend. I will plan to mark this video as an analysis video. Middle part of the video will be reviewing my past activity in NASDAQ:RIVN and how that has helped me learn to temper position sizing as much as possible.
After the Eleven Minute mark, I take the opportunity to review $NYSE:NCLH. I talk a little bit about what position sizing might look like there as well. Position sizing is certainly the most important aspect of trading - especially as you are looking at taking part in long term trends. The volatility within a long term trend can be quite significant (which of course can present opportunities in its own right) and you want to put yourself in the best position to take advantage of a great, long term move. To me, this means entering a position with responsible size so that you are not exiting a potentially great trade too early, or, even worse, with a loss.
Anyway, hope you guys enjoy, and best of luck out there!

GBPJPY BUY TRADE Oct 8 2024This trade comes to fruition after checking for manipulation of lows using 4H-1H-30min-15min.
Allowing me to activate the said pending order -Buy limit during London session (metatrader 4 platform) . I marked that demand because using the order flow, I can see enough evidence to go long. Risking 0.5% of the capital. Every trade that I initiate comes from the basic idea of supply and demand.
(please check the attached charts for a detailed structure of entry and exit points)
Always be patient and look for proof before you put pending order.

Creating a Balanced Investment PortfolioCreating a Balanced Investment Portfolio
In the vast realm of trading, where platforms like FXOpen play a pivotal role, strategy and skill stand paramount. As the age-old adage goes, 'Don't put all your eggs in one basket.' In the context of trading, this underscores the significance of diversification. Enter the concept of a balanced investment portfolio - an excellent balanced portfolio example, which emerges as an oasis of hope amidst the unpredictable dunes of market volatility.
Understanding the Importance of a Balanced Investment Portfolio
To achieve a balanced investment portfolio, it's crucial to consider the balance of individual components, especially forex, CFDs, stocks, and bonds. For example, a stock portfolio balance refers to the proportion of stocks in relation to other investment types. This balance is pivotal, as stocks often carry higher risks but also higher potential rewards. By understanding their own risk tolerance and learning how to balance portfolio assets effectively, traders can determine the ideal portfolio balance that meets their specific objectives.
Building the Foundation: Investment Basics
Every experienced trader knows that the world of investments is vast, presenting myriad opportunities. Some of the primary investment types include:
- Stocks: These signify ownership in a company and constitute a claim on a fraction of its assets and earnings.
- Bonds: Essentially, when you invest in bonds, you're loaning your money, either to a corporation or the government, in exchange for periodic interest payments plus the return of the bond's face value when it matures.
- Real Estate: Investing in tangible land, buildings, or housing. Given its physical nature, it often acts as a hedge against more volatile markets.
- Mutual Funds: These funds pool money from several investors to invest in a diversified portfolio of stocks, bonds, or other securities.
Central to investment basics is the risk-return tradeoff. Essentially, it highlights that the potential return on any investment is directly proportional to the risk associated with it. In this matrix, diversification emerges as the most effective strategy, helping to spread and, in turn, mitigate risk.
Asset Allocation Strategies
Asset allocation might seem like a complex term, but at its core, it's about ensuring that your portfolio reflects your investment portfolio balance, harmonising your desired risk and reward.
1. Modern Portfolio Theory (MPT)
Introduced by the visionary economist Harry Markowitz in the 1950s, the Modern Portfolio Theory (MPT) has since established itself as a seminal concept in portfolio management. Groundbreaking for its time and still influential today, MPT hinges on a principle that feels intuitive yet was revolutionary upon its debut: diversifying investments to maximise returns while judiciously managing the associated market risk. Central to the MPT is the construct of the 'Efficient Frontier'.
This captivating concept represents a boundary in the risk-return space where portfolios lie if they offer the highest expected return for any given level of risk. In essence, any portfolio residing on the Efficient Frontier is deemed optimal, reflecting a balance where no additional expected return can be achieved without accepting more risk.
2. Strategic Asset Allocation
Here, traders establish a base policy mix — a proportional combination of assets based on expected rates of return for each asset class. It’s a long-haul game, adjusting the portfolio as long-term goals or risk tolerance evolve.
3. Tactical Asset Allocation
A more active management portfolio strategy, this method tries to exploit short-term market conditions. It involves shifting percentage holdings in different categories to take advantage of market pricing anomalies or strong market sectors.
Diversification
In the complex world of investing, understanding how to balance a portfolio is key. Diversification is the guardian against unpredictability. It is the art of spreading investments across various assets or sectors, ensuring that potential adverse events in one area won't unravel the entire portfolio's performance. Essentially, diversification is the protective shield that buffers against market volatility, offering a more stable and consistent growth path for traders.
Geographical Diversification
Globalisation has knit economies closer than ever before, yet each retains unique characteristics influenced by internal and external events. By diversifying investments across continents and countries, traders can leverage these unique attributes.
Sector Diversification
Beyond geography, the global market is segmented into various sectors — technology, healthcare, and finance, to name a few. Each has its growth trajectory, impacted by different factors. Spreading investments across sectors can hedge against unforeseen adversities.
Individual Asset Selection
The keystone of a robust portfolio is the judicious choice of individual assets. Beyond the broad strokes of diversification, the meticulous selection of each asset determines the portfolio's potential success. It's where profound understanding meets strategic decision-making, ensuring that every asset, be it a stock, bond, or commodity, is handpicked to serve the trader's overarching goals and vision. Proper research, encompassing financial performance, management quality, growth potential, and market trends, provides insight, reducing the chances of unwelcome surprises.
Risk assessment is another crucial part of individual asset selection. Risk is an inherent part of investing. However, with rigorous risk assessment, traders can anticipate potential pitfalls. Evaluating the risk associated with each asset and its correlation with others in the portfolio helps in achieving the desired balance.
Monitoring and Rebalancing
In the dynamic dance of markets, continuous oversight and timely adjustments keep a portfolio's rhythm and harmony intact.
- Regular Portfolio Review. The world doesn't stand still, nor do the markets. Regular reviews ensure that the portfolio aligns with the trader's goals and market realities.
- Rebalancing Strategies. Over a period of time, certain investments will experience more rapid growth than others. This can shift the portfolio’s balance, necessitating rebalancing. Rebalancing, whether by reinvesting dividends or selling assets that have appreciated to buy those that have declined, ensures alignment with the desired risk levels and asset allocation strategy.
Conclusion
Crafting a balanced trading portfolio is an art backed by science, strategy, and due diligence. It's an ongoing process requiring constant monitoring and fine-tuning. By keeping a finger on the pulse of global trends, understanding risks, and staying committed to their goals, traders can navigate the choppy waters of global markets effectively. For those eager to embark on or deepen their trading journey, FXOpen offers the platform and tools. To initiate this exciting endeavour, you can open an FXOpen account and explore the dynamic offerings of the TickTrader platform.
This article represents the opinion of the Companies operating under the FXOpen brand only. It is not to be construed as an offer, solicitation, or recommendation with respect to products and services provided by the Companies operating under the FXOpen brand, nor is it to be considered financial advice.

Understanding Warren Buffett’s Investment PhilosophyWarren Buffett is arguably one of the most successful investors of all time. Over the years, he has developed a set of principles and strategies over his career. He was inspired by the teachings of key financial thinkers like Phil Fisher, Benjamin Graham and Charlie Munger.
Key Influences
Phil Fisher
Fisher’s approach focusses on quality companies with long-term growth potential, emphasizing focused portfolios and long-term holdings. He believed in gathering information about a company beyond what’s readily available. His lessons on maintaining a focused portfolio and committing to long-term holdings are clear influences on Buffett’s patient, value-driven investment philosophy.
Benjamin Graham
Known as the father of value investing, Graham’s core principle was to buy stocks at a price lower than their intrinsic value, creating a margin of safety (MOS). This strategy helps mitigate risk and increase the likelihood of future gains. Buffett absorbed Graham’s teaching on finding stocks that are undervalued and buying them at the right price— definitely a large contributor of his investment success.
Charlie Munger
Munger is Warren Buffett’s long-time business partner. He introduced the concept of economic moats, which refers to a company’s long-term, sustainable competitive advantages. Munger advocates investing in businesses that can fend off competition and maintain profitability over time. This philosophy drives Buffett’s focus on companies with strong market positions and solid long-term potential, favoring these over shorter-term, speculative opportunities.
Buffett's Investment Approach
1 - Buy for the Long Term. Buffett’s strategy emphasizes identifying companies that can consistently perform well over long periods. He holds stocks for years, or even decades, often looking for opportunities where other investors may overlook value.
2 - Buy at the Right Price . Buffett is known for his discipline in waiting for the right moment to invest. His approach ensures he doesn’t overpay, instead seeking stocks when they are priced below their true value, maintaining a margin of safety.
3 - Buy the Right Stocks . Buffett doesn’t just buy cheap stocks, he buys quality companies with sustainable advantages. His goal is to invest in firms with strong business models that will continue to perform well regardless of market conditions.
Warren Buffett emphasizes investing in companies with simple and clear business models , ones that fall within his circle of competence. He prefers to thoroughly understand the operations, products, and long-term prospects of a company before making any investment.
This principle is combined with in-depth analysis of how the company operates and how sustainable its valuations and future growth prospects are. If a business model is too complex or outside his expertise, he avoids it.
He prioritizes companies with integrity and transparency in their management. He believes in backing leaders who are passionate, have strong vision and execution capabilities and who use shareholder funds wisely. Trusting management to run the company effectively, with efficiency and accountability, is critical for long-term success in Buffett’s eyes.
Investing in quality companies isn’t enough—Buffett also insists on buying them at attractive prices. He maintains a strict discipline of buying with a margin of safety, ensuring the price paid is lower than the company’s intrinsic value. This means waiting for opportunities to buy great businesses at fair prices rather than settling for fair businesses at attractive prices , which may not perform well over time.
Buffett has made many of his lessons and strategies available to the public through his letters to shareholders and partnership letters. These documents offer insight into his investment approach, decision-making process, and lessons from both successes and failures. There are several key books that capture Buffett’s life, philosophy, and strategies in greater detail:
Warren Buffett’s Ground Rules
The Warren Buffett Way
Buffett: The Making of an American Capitalist
The Warren Buffett Portfolio
The Snowball: Warren Buffett and the Business of Life
Each of these resources provides a comprehensive look into the mind of one of the most successful investors of all time, offering practical advice and detailed case studies of his investments.
________________________________
