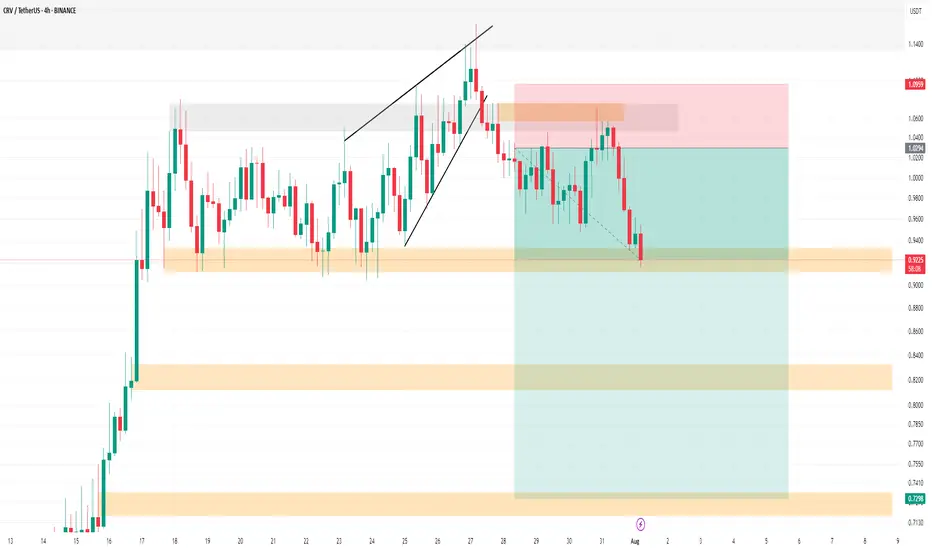
CRV SHORT Update Hello.
CRV Update
💁♂️ TP1 🔥
You can see this analysis in the analyses I posted before. It has now reached its first target. Please don't forget to like, share, and boost so that I can analyze it for you with more enthusiasm. Thank you. 💖😍
✅ TP1: 0.93$ Accessible (done)🔥
TP2: 0.82$ Possible
TP3: 0.73$ Possible
Position
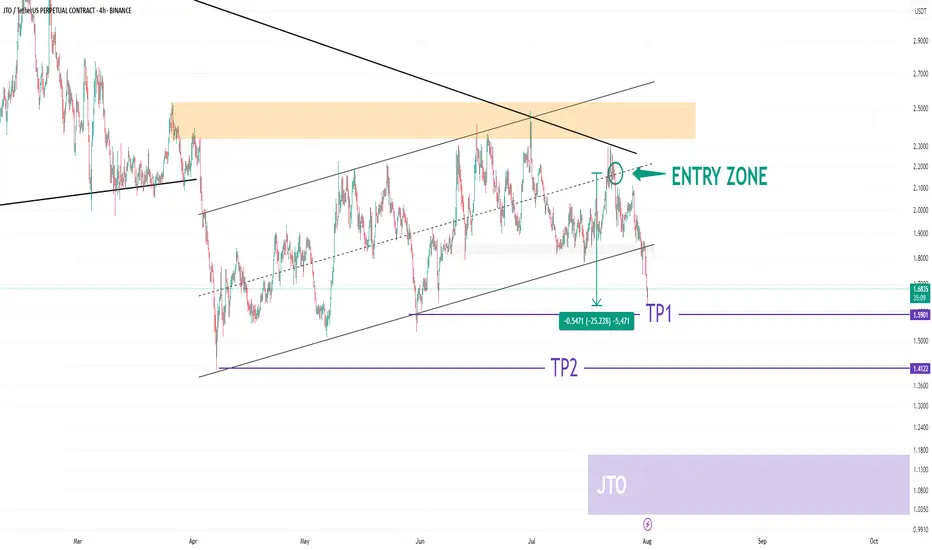
JTO USDT UpdateHELLO 😍
JTO Update
💁♂️ -25% 🔥
I shared this analysis when it was in the entry section. It would be nice to have an update of this analysis.
The JTO cryptocurrency has corrected 25% since the entry zone.
We saw a very good analysis together. What do you think? 😊💖
You can save some profit from the position in this area. 🐱
Please don't forget to like, share, and boost so that I can analyze it for you with more enthusiasm. Thank you. 💖😍
CRVUSDT SHORTI think the CRV has reached the classic target and is in an important area. It could experience a price correction.
TP1: 0.93$ Accessible
TP2: 0.82$ Possible
TP3: 0.73$ Possible

Position Sizing 101: How Not to Blow Up Your Account OvernightWelcome to the trading equivalent of wearing a seatbelt. Not really exciting but entirely recommended for its lifesaving properties. When the market crashes into your stop-loss at 3:47 a.m., you’ll wish you’d taken this lesson seriously.
Let’s talk position sizing — the least flashy but most essential tool in your trading kit. This is your friendly reminder that no matter how perfect your chart setup looks, if you’re risking 50% of your capital on a single trade, you’re not trading. You’re gambling. And also — if you lose 50% of your account, you have to gain 100% to get even.
✋ “Sir, This Isn’t a Casino”
Let’s start with a story.
New trader. Fresh demo account turned real. He sees a clean breakout. He YOLOs half his account into Tesla ( TSLA ). "This is it," he thinks, "the trade that changes everything."
News flash: it did change everything — his $10,000 account turned into $2,147 in 48 hours.
The lesson? Position sizing isn’t just about managing capital. It’s about managing ego. Because the market doesn’t care how convinced you are.
🌊 Risk of Ruin: The More You Know
There’s a lovely concept in trading called “risk of ruin.” Sounds dramatic — and it is. It refers to the likelihood of your account going to zero if you keep trading the way you do.
If you risk 10% of your account on every trade, you only need to be wrong a few times in a row to go from “pro trader” to “Hey, ChatGPT, is trading a scam?”
Risking 1–2% per trade, however? Now we’re talking sustainability. Now you can be wrong ten times in a row and still live to click another chart.
🎯 The Math That Saves You
Let’s illustrate the equation:
Position size = Account size × % risk / (Entry – Stop Loss)
Example: $10,000 account, risking 1%, with a 50-point stop loss on a futures trade.
$10,000 × 0.01 = $100
$100 / 50 = 2 contracts
That’s it. No Fibonacci razzle-dazzle or astrology needed. Just basic arithmetic and a willingness to not be a hero.
🤔 The Myth of Conviction
Every trader has a moment where they say: “I know this is going to work.”
Spoiler alert: You don’t. And the moment you convince yourself otherwise, you start increasing position size based on emotion, not logic. That’s where accounts go to die.
Even the greats keep it tight. Paul Tudor Jones, the legend himself, once said: “Don't focus on making money; focus on protecting what you have.” Translation: size down, cowboy.
🔔 Position Size ≠ Trade Size
A common mistake: confusing position size with trade size.
Trade size is how big your order is. Position size is how much of your total capital is being risked. You could be trading 10 lots — but if your stop loss is tight, your position size might still be conservative.
So yes, trade big. But only if your risk is small. You’ll do better at this once you figure out how asymmetric risk reward works.
🌦️ Losses Happen. Don’t Let Them Compound
Let’s say you lose 5% on a trade. No big deal, right? Until you try to “make it back” by doubling down on the next one. And then again. And suddenly, you’re caught in a death spiral of revenge trading .
This is not theoretical. It’s Tuesday morning for many traders.
Proper position sizing cushions the blow. It turns what would be a catastrophe into a lesson — maybe even a mildly annoying Tuesday.
🌳 It’s Not Just About Risk — It’s About Freedom
Smart sizing gives you flexibility (and a good night’s sleep).
Want to hold through some noise? You can. Want to scale in? You’re allowed. Want to sleep at night without hugging your laptop? Welcome to emotional freedom.
Jesse Livermore, arguably the most successful trader of all time, said it best: “If you can’t sleep at night because of your stock market position, then you have gone too far. If this is the case, then sell your position down to the sleeping level.”
⛳ What the Pros Actually Do
Here’s a dirty little secret: pros rarely go all-in without handling the risk part first (that is, calibrating the position size).
If they’re not allocating small portions of capital across uncorrelated trades, they’ll go big on a trade that has an insanely-well controlled risk level. That way, if the trade turns against them, they’ll only lose what they can afford to lose and stay in the game.
Another great one, Stanley Druckenmiller, who operated one of the best-returning hedge funds (now a family office) said: “I believe the best way to manage risk is to be bullish when you have a compelling risk/reward.”
🏖️ The Summer of FOMO
Let’s address the seasonal vibes.
Summer’s here. Volume’s thin. Liquidity’s weird. Breakouts don’t follow through. Every false move looks like the real deal until it isn’t. And every poolside Instagram story from your trader friend makes you want to hit that buy button harder.
This is where position sizing saves you from yourself. Small trades, wide stops, chill mindset. Or big trades, tight stops, a bit of excitement in your day.
No matter what you choose, make sure to get your dose of daily news every morning, keep your eye on the economic calendar , and stay sharp on any upcoming earnings reports (GameStop NYSE:GME is right around the corner, delivering Tuesday).
☝️ Final Thoughts: The Indicator You Control
In a world of lagging indicators, misleading news headlines, and “experts” selling you dreams, position sizing is one of the few things you have total control over.
And that makes it powerful.
So next time you feel the rush — the urge to go big — take a breath. Remember the math. Remember the odds. And remember: the fastest way to blow up isn’t a bad trade — it’s a good trade sized wrong.
Off to you: How are you handling your trading positions? Are you the type to go all-in and then think about the downside? Or you’re the one to think about the risk first and then the reward? Let us know in the comments!

Trading Mindset
I Am a Software Developer and a Passionate Trader
Over the past five years, I have explored nearly every aspect of trading—technical analysis, intraday trading, MTF, pre-IPO investments, options selling, F&O, hedging, swing trading, long-term investing, and even commodities like gold and crude oil.
Through this journey, I realized that **technical analysis is only about 20% of the equation**. The real game is **psychology and mindset**.
I have distilled my learnings into concise points below—insights that have shaped my approach and will continue to guide me in my version 2.0 of trading. I hope they prove valuable to you as well.
---
### **Position Sizing**
One of the most important aspects of trading is choosing the right position size. Your trade should never be so large that it causes stress or worry. Keep it at a level where you can stay calm, no matter how the market moves.
### **Set Stop-Loss and Target Before Placing a Trade**
Decide in advance when you will exit a trade—both at a loss (**stop-loss**) and at a profit (**target**). This helps maintain emotional balance, preventing extreme excitement or frustration.
### **How to Calculate Position Size**
- Use **technical analysis** to identify your **stop-loss** and **target**.
- Example: If CMP is ₹100 and your stop-loss is at ₹94 (₹6 risk per share), determine your risk tolerance:
- ₹3,000 risk ➝ **500 shares** (₹3,000 ÷ ₹6)
- ₹1,200 risk ➝ **200 shares** (₹1,200 ÷ ₹6)
- Adjust quantity based on how much you're willing to risk.
### **Setting Target Price & Risk-Reward Ratio**
The most important factor in setting a target is the **risk-reward ratio**. If your stop-loss is ₹6, your target should be at least **₹6, ₹9, or ₹12**.
### **Why Is Risk-Reward Important?**
Let’s say you take **10 trades**—5 go in your favor, and 5 go against you. If your risk-reward ratio isn’t favorable, you could end up in a loss.
Example:
- You **lose ₹6** in two trades → ₹12 total loss
- You **gain ₹3** in three trades → ₹9 total profit
- **Net result: -₹3 loss**
To ensure profitability, your **reward should be equal to or greater than your risk**. A **1.5x or 2x risk-reward ratio** is ideal.
### **Flexibility in Targets**
Even when the price reaches **Target 1**, you can **book partial profits** and let the rest run with a **trailing stop-loss**.
---
### **Managing Multiple Trades**
This is **very important**. If you're a beginner, **limit yourself to 2 trades**, and even if you're a pro, **avoid more than 3-5 positions**.
**Example:** If you have **₹2 lakh**, make sure you have **only 2 trades open at a time**. Add a third stock **only when you close another position**.
---
### **How to Deploy Capital**
Patience is key. If you have **₹1 lakh**, **divide it into 4-5 parts** and buy **in small chunks over time**.
**Why?**
The **nature of stocks** is to move in waves—rising, facing profit booking, then breaking previous highs. Instead of investing everything at once, **buy in staggered amounts** to ensure your **average price stays close to CMP**.
---
### **Avoid Market Noise**
When trading, **stay in your zone**.
Social media posts can make you feel **slow compared to others**, but they don't show the full picture. Avoid distractions like:
- Direct stock tips from **news channels**
- P&L snapshots from traders
- Following too many **analysts on social media**
Instead, **listen to expert views**, but stay disciplined with **your own strategy**.
---
### **Stock Selection**
Stock selection has **two elements—technical and fundamental** (I'll write a separate post on this).
Always **buy a stock that you can hold even in your darkest times**.
**Example:**
- Choose **blue-chip stocks** with **high market caps & strong promoter holdings**
- Never **buy a stock just because it’s in momentum**
- If a stock **turns into a forced SIP**, it’s not a good buy
Pick stocks with **a long-term story**—even if you fail to exit at the right time, you should be comfortable holding them.
---
### **Accept That It’s the Market, Not You**
Many traders fail because they **don’t admit that the market is unpredictable**.
Losses happen because of volatility, not necessarily poor strategy. **Example:**
- You lose a trade and **try improving your method** but face another hit
- Some losses **are simply beyond your control**
Most of what happens in the market is **not in your hands**—including stop-loss triggers. **Accept this reality,** and focus on **risk management** instead of revenge trading.
---
### **Keep Separate Trading & Investment Accounts**
Trading and investing **are different**. If you keep them **in the same account**, you’ll:
- **Book small profits** on investments
- **Hold short-term trades in losses**
Having **separate accounts** keeps **your goals clear**.
---
### **Don’t Let the Market Dominate You**
Even full-time traders **shouldn’t obsess over the market**.
Limit your **screen time to 2-3 hours during market hours**.
**Why?**
- You can’t **act on global markets until 9:15 AM IST**
- Even if a **war or tariff issue** arises, **you can’t do anything until market open**
- Overthinking leads to **over-trading**, which drains money
Instead, **invest time in developing new skills**.
---
### **Do What Suits You, Not Others**
If you're good at **swings, stick to swings**. If you're good at **intraday, do intraday**.
Don't follow **what works for a friend—trade based on what suits you**.
---
### **Avoid FOMO**
Don't **stress** if a stock jumps **20% in a day**.
Stock **accumulation zones, demand/supply areas, profit booking**, and **retests** happen **regularly**—opportunities will always come.
Even traders who claim they made **20% in a day** **don’t share how often they got trapped chasing stocks**.
---
### **Stop-Loss Is Your Best Friend**
No, stop-loss is your **best friend for life**.
**Example:**
- Suppose you **enter 10 trades in a month**.
- **6 do well** and you book profits.
- **4 go against you**, but instead of exiting, **you hold** because you believe they’ll recover.
- Next month, you **repeat this cycle**—adding more positions.
Over time, **this builds a portfolio of lagging stocks**, and suddenly, **your losses dominate your portfolio**.
---
Even Experts Face Losses
Even professionals with **advanced research teams lose money**.
Retail traders often **believe they can avoid losses by analyzing a few ratios**, but **losses are part of trading**.
A stop-loss ensures **you stay in the game long-term**—instead of holding onto losing trades indefinitely.
---
Take a Break & Restart
Taking breaks is **crucial**. If everything is going wrong, **don’t hesitate to press the reset button**—step back, analyze, and refine your approach. A fresh mindset leads to better trading decisions. (I’ll write a detailed post on this soon.)

WILL GOLD PUMP AGAIN IN FOMC NEWS ALERT🚨 XAUUSD Market Update! 🚨
Gold is on the move, battling key levels between 3040! Will we see a breakout soon? 🔥
Bearish Watch: If the price drops below this range, we could target 3015 and 3020. ⚠️
Bullish Opportunity: A break above 3042 could signal a buying surge, with targets set at and 3100. 🚀
💬 What’s Your Move? Join the conversation and share your thoughts! Let’s navigate this golden opportunity together and aim for new highs! 💰

LIMIT ORDER - $COTI/USDTLIMIT ORDER - $COTI/USDT
Direction: #Short 🔴
Entry Price: 0.062870
Stop Loss: 0.068793
Target 1: 0.060344
Target 2: 0.057817
Target 3: 0.055291
Target 4: 0.052764
Target 5: 0.050238

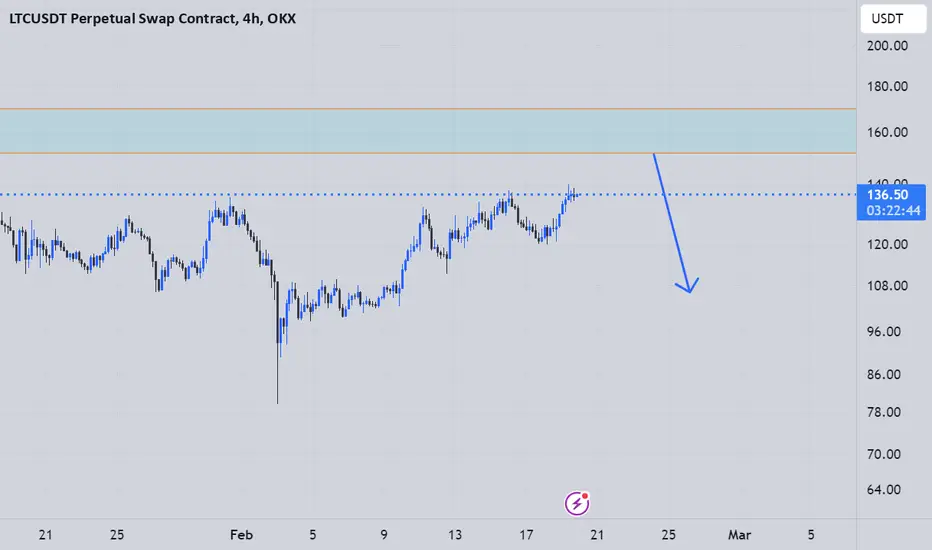
LTC short positionits a smal short position before a good pump
you can use candlestick patterns in lower timeframe for entry
XAU/USD 4H Analysis: Bullish Momentum Towards $2,780?📊 XAU/USD 4H Chart Analysis – Bullish Momentum 🚀💰
📌 Key Observations:
🔹 Current Price: $2,754.16 (+0.19%)
🔹 Support Zone: $2,740 - $2,750 (Previous resistance turned support ✅)
🔹 Resistance Zone: $2,780 (Next potential target 🎯)
🔹 200 EMA: $2,687.43 (Price is above = Bullish signal 📈)
🔹 Breakout Confirmation: Price has broken past a key level and might retest before moving higher 🔄📊
📉 Potential Scenarios:
✅ Bullish Case: If price holds above $2,750, we could see a rally towards $2,780+ 🚀
❌ Bearish Case: If price drops below $2,740, we might see a correction back to $2,720 ⚠️
🔥 Conclusion:
Gold is showing strong bullish momentum and may continue its uptrend towards $2,780+ if it sustains above the breakout level! Keep an eye on support at $2,750 for confirmation. 👀💎
Would you like further indicators or a different timeframe analysis? ⏳📊

TRADE SNX...Hello friends
According to the upward trend, it is expected that the specified range is a good range for buying, the loss limit and the profit limit are also specified.
This analysis is only reviewed from a technical point of view.
Don't forget capital management, friends.

Scenario on USDCAD On this chart, a triangle has formed, which is also part of a larger, larger expanding triangle from the daily timeframe perspective, and all of this is happening near the resistance at the price level of 1.41. In my opinion, the market will try to test this level again. If the price is rejected during this session, I can take it as the conclusion of the entire formation and I will then wait for a potential setup to enter a short.

BTC: 7955 | Oct. 19, 2019 Sat - May 2020 Planthe float is diminishing while stabilizing coins make it cheaper to acquire BTC relative to mining
the road to 100k ++ should be organic post the HALVING when institutions make a SHOUT OUT above 10k levels again

Shopify (SHOP): Preparing for a Long-Term Entry at $49.62Considering Shopify, the situation is unfolding as we anticipated. We expected the beginning of 2024 to potentially mark the peak for Shopify with the completion of Wave (1), indicating a Wave 2 correction. This correction is likely to find support between the 63.8% and 78.6% retracement levels.
Currently, the pattern is showing lower lows and lower highs, suggesting that further price declines may occur, potentially closing existing gaps. Our strategy is still developing, but we plan to place a long-term entry at $49.62 with a stop-loss at $31.

AUDUSD NEXT possible moveWe observe that AUD/USD has reached a very interesting zone. A solid confirmation could allow us to target the LOW.

How I Position Size: sizing positions as an active investorHey, guys. Wanted to cover a brief overview of how I size my positions of late as I think about how to invest/trade a trend. I will plan to mark this video as an analysis video. Middle part of the video will be reviewing my past activity in NASDAQ:RIVN and how that has helped me learn to temper position sizing as much as possible.
After the Eleven Minute mark, I take the opportunity to review $NYSE:NCLH. I talk a little bit about what position sizing might look like there as well. Position sizing is certainly the most important aspect of trading - especially as you are looking at taking part in long term trends. The volatility within a long term trend can be quite significant (which of course can present opportunities in its own right) and you want to put yourself in the best position to take advantage of a great, long term move. To me, this means entering a position with responsible size so that you are not exiting a potentially great trade too early, or, even worse, with a loss.
Anyway, hope you guys enjoy, and best of luck out there!

XRP Price Analysis: Potential 20% Drop Amid Key Support LevelsXRP is currently trading within a box pattern, with a lower high suggesting a higher probability of a downside breakout. If the crucial support level of $0.5213 is lost, there is a 20% potential drop in price, targeting $0.4164. If you are holding XRP, you might consider selling, or alternatively, you could take a short position upon a clear break of the $0.5213 level. Given the importance of this support, a sharp decline is expected if it breaks. Keep an eye on this critical zone for any significant moves.

SUI: Hurst Cycles and Elliott Wave Align for Potential UpsideSUI is following the Hurst cycles quite closely, with the price movement rising and falling in line with these time-based signals. These cycles give us a useful indication of when certain price actions may occur. Given that the peaks have aligned well with the midpoint of previous Hurst cycles, we could see more upside for SUI in the short term.
Additionally, the Elliott Wave pattern (1,2,3,4,5) further supports the idea of potential continued upside. This signals a possible hold for now, as we wait for either a break of the upper trendline, which could lead to higher highs, or a reversal, keeping SUI within its current channel.
Follow for more.

Title: Key Support Levels for Short and Long Positions: CriticalIt seems we have experienced enough upward momentum, and now, with the support level at 66,842, a short position can be considered. However, since this position goes against the main trend, it’s crucial to set a tight stop-loss to manage risk and ensure an early exit with a favorable risk-reward ratio. The next support level for this strategy could be 65,359.8.
On the other hand, if you're planning to open a long position, you might consider entering at 67,898.7, but be cautious with the stop-loss placement. A wider stop-loss would be advisable, possibly below 66,687.4, to allow room for market fluctuations.

HIT TPs on 1m, 5m TFsYOHOOO
HIT our TPs
Check our channel
I'll share another positions with you
good luck

EURCADHi guys,
In this chart i Found a Demand Zone in EURCAD CHART for LONG entry,
Observed these Levels based on price action and Demand & Supply.
*Don't Take any trades based on this Picture.
... because this chart is for educational purpose only not for Buy or Sell Recommendation..
Thank you

Apple (AAPL): Swing Entry on the HorizonLast time, we narrowly missed the entry on Apple by just a few dollars, and after that miss, the stock no longer presented a compelling opportunity, so we decided to wait. However, after observing from the sidelines for a few months, it seems that another chance to secure a profitable swing entry might be approaching.
To increase our confidence in this potential opportunity and secure a better entry point, we need to closely monitor further movements from this tech giant. The current price action strongly suggests that a flat pattern might be forming following the recent drop. If this flat pattern does materialize, it could manifest as either a regular flat or an expanded flat, and this will be crucial in determining our entry target zone. At this stage, the area between $200 and $180 seems the most probable and attractive for a potential entry.
Given the broader market trends and Apple’s recent performance, this zone could offer a favorable risk-reward ratio. We’ll be watching for any developments that confirm this pattern and provide a clearer signal for entry. Stay tuned for further updates as we refine our strategy and prepare for a possible move on Apple.

Long Position on 1000SHIBUSDT / (Volume Projection)BINANCE:1000SHIBUSDT.P
PHEMEX:1000SHIBUSDT.P
SL2 ---> Mid-risk status: 5x-8x Leverage
SL1 ---> Low-risk status: 3x-4x Leverage
👾The setup is active but expect the uncertain phase as well.
⚡️TP:
0.013409
0.013570
0.013720
0.013830
0.013990
0.014190(In Optimistic Scenario)
➡️SL:
0.01268
0.01237
🧐The Alternate scenario:
🔴If the price stabilizes below the trigger zone, the setup will be cancelled.
