GBPCAD: Daily Position TradeWhats up everyone ?
Coming back with a position trade, we are holding since 4 weeks on GBPCAD. The trade was first taken on the 4h timeframe bases, but as we zoomed out our take profit got larger. We are now on a daily timeframe analysis with two correction levels marked in yellow boxes. Our entry was at the top of level 2 correction and is now in profit +350 pips. Expecting another move down, our take profit is at the last low. BTW our system made 5.65% last month. Hear you guys soon!
Position


AUDUSD: Consolidation Before NFPHey guys its Friday, the first of the month.
What does that mean ? Its time for NFP in like one and a half hour. Please be aware that my ideas are only my view of things and do not take them for guaranteed. Everyone has its own view on same charts.
So we are looking at the AUDUSD pair and as i posted weeks ago (link below), its on a trend change mode with a consolidation level 1 on the daily timeframe. The strong trend line was broken and for now its holding 0.61 fib line. We keep in mind that NFP is right in front of us, so a prediction would be that news move AUDUSD out of the consolidation up - meaning that USD would weaken during NFP. But please be aware that this is only my view.. Wishing you success and will keep you updated below!

Short until 3000Iveen shorting forming this triangles . until any of this triangles becomes asending on a 4hr or 12hr chart make no sense to go long for a long period of time(?
I am looking for a short position arround 4700 or 4800 but already on a small low risk lev position from 4360 you can insult me about this here, on twitter or instagram .
(shitposting alert)
twitter.com
www.instagram.com
My opinions are mine.This is not financial advice at ALL DUDE pleaz dont .

Short sell USD/JPY by Ben WrightSELF DEVELOPMENT/METHODOLOGY/PSYCHOLOGY
Possibility shorting selling USD/JPY
FX:USDJPY weekly Prediction
Chart time frame - H4
Timeframe - 1-2 weeks
Actions on -
A – Activating Event
USD will see another bull run this week.
B – Beliefs
Market will be rejected at @114.5 level and move south towards the 113.5 level. This will be a resting/consolidation phase before pushing and breaking the @114.5 level.
Trade Management
Entered @ Still waiting for confirmation
Stop Loss @
Target @
Risk/Reward @
Happy Trading :)


XRP/USD Pullback TargetI'm planning to enter at the possible end of C correction wave. Considering upcoming events XRP should see some attention on the next days. This position is a swing position but I will daytrade if I find nice oppourtunities along the way

What's happened to 'the Gold rush?This is a short screencast showing an excellent entry position. (this is not advice to enter a trade).
The gold market is holding it's breath I think. Keep in mind that generally Gold has an inverse correlation with Stock Markets in troubled times. I suspect that people are watching for a Halloween Effect, or something with the Stock Markets - so they're probably a bit anxious to jump on Gold. If the Halloween effect happens then price of Gold sinks.
But if the stock markets make a conclusive move south, I'm expecting RSIs to go on fire in the north direction. We shall 'have to wait and see' as Mr Trump often says. :))

NZD/USD (Oct 2018) *Upside is coming but be patientThis will be my views of NZD/USD (Oct 2018)
Please make sure to read the "update" comment as there will be changes along the way.
Cheers.
S0nic
Disclaimer:
The information contained in this presentation is solely for educational purposes and does not constitute investment advice. We may or We may not take the trade.
The risk of trading in securities markets can be substantial. You should carefully consider if engaging in such activity is suitable to your own financial situation.
We, Sonicr Mastery dot com is not responsible for any liabilities arising from the result of your market involvement or individual trade activities.
You should be aware of all the risks associated with foreign exchange trading, and seek advice from an independent financial advisor if you have any doubts.

A Possible butterfly NZDCAD W180 cent is a good supply zone as butterfly gonna complete at that exact point, market will reach there might next year.

USDCHF - Position Outlook - W1Looking here at the Swissy, a pair not long added to my watch list, I'm already short USDCHF from the open earlier today. For me the this could perhaps be one of those times where the fundamental analysis and the technical analysis seem to match up rather nicely. IMO the USD will continue to weaken over the coming weeks, and paired with a nice rejection candle from the underside of the 'recently' broken monthly trend line, leads me to be looking for further downside in this pair.
If we continue to see this play out as above, then I'd be looking for targets in and around the area of the yellow/orange horizontal line on the chart. As you can see we broke above the bearish weekly trendline from 2017 once before, and I would like to see another test of this from the other side to see whether or not it holds.
As the trade war evolves as well, the Swiss Franc could benefit from some more risk off type of trading environment. As always lets see how this plays out.

Short positionThe pair is in a triangle continuation pattern. In the event of a downside loss to the specified range, it can continue to decline.

ABEV3 starts position tradeABEV3 after two week of selling, this week superates the max price of last week suggesting enter in a position trade with target by fibonacci.

CESP6 position trade opportunityBMFBOVESPA:CESP6 stock giving a position trade opportunity after three week correction, yesterday was fired the max value from last week.

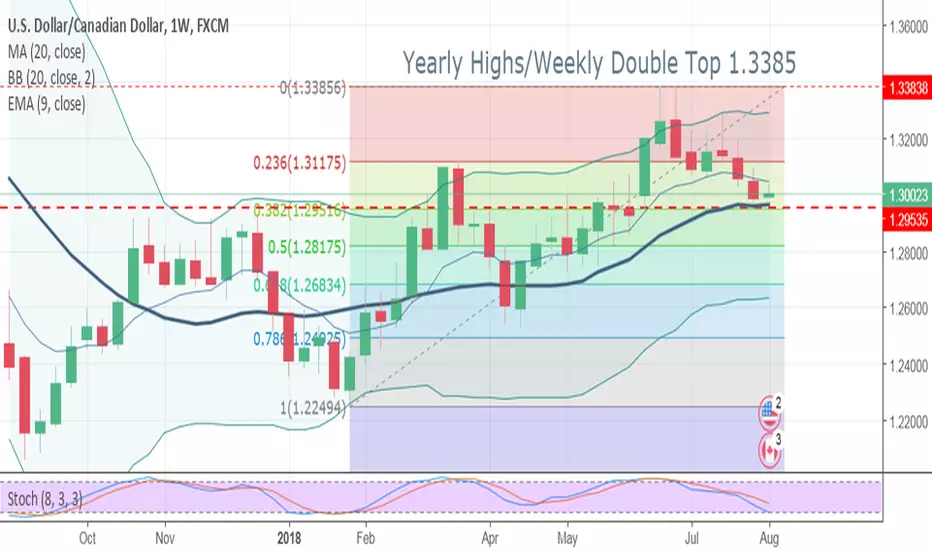
Position Long From Weekly Fibonacci Support USD/CADSince the rally of late-June, the USD/CAD has been consistently falling. BoC tightening and WTI crude values have been primary reasons behind the move. As a result, several key technical support levels are coming into view.
The 38% Fibonacci retracement of the yearly range (1.2950) is a fantastic place to go long in the USD/CAD. This will be a make-or-break area for this market. If it holds, a return to yearly highs are likely in the cards for the fall season.
Here is the trade:
1)Entry: Buy 1.2960
2)Stop Loss: 1.2894
3)Profit Target: 1.3092
4)Risk vs Reward: 1/2
My Current Position in SALT/BTCI was able to pick up SALT at 1501 and set a stop loss in profit. Lets hope we go up from here!

$TAT potential bounce play off of year support levelWe take a look at TAT and see that the bounce off of the year support level of $1.25 is already in progress. We are looking for it to break $1.50 with volume before we consider a position.

AIDCOIN/BITCOINsafe buy zone for this coin is
0.00001500 - 0.00001700
safe sellzone
1.st target
0.00001920 - 0.00002100
2.nd target
0.0000220 - 0.00002400
stoploss
0.00001350

Evening update Bulltrap Bitcoin. H1 H1 Chart got a failure breakthrough bottom which was bought back very quickly. But the flag (bearflag) is still aktiv. So we have to take care with our next turns. Maybe a small position for breakout is possible. If u watch H4 the Bearflag is also forming...
As you can see, we need the double volume for the green flag that for the red flag. thats not really bullish.


EUR/USD, Nice Opportunity for LONG.EUR/USD
Based on the Elliot wave analysis, the expectation on the EUR/USD will be long for following days. In addition, reasonable Risk/Reward ratio can be assigned as the retracement may occurs till 38.2% of fib.

[May 24th /BITMEX] Bitcoin Trend Analysis - 7260/7700 My last analysis was correct and we made huge profit guys! Cheers!
Today, I gonna show how the trend will work.
Let's simplified it.
If the red support wall will break out, Bitcoin 0.57% price can be re-entered 7250/7200 over 70% possibility.
If the red support wall won't break out, it can try to break 7700/7850 resistance wall.
Position (with conservative sight)
Short: 7560/7700/7860 (x 10-25 leverage)
Long: 7340/7260/7100 (x 5-10 leverage)
Open orders: 6700 long, 8148 short (worst case for bull/bear both side)
So far, I would say the red line is more realistic than the green line.
Bulls are trying hard to break out the 7600 wall, but it is still not that powerful.
Lots of people and my friends asked how Bear always win the fight.
I can confirm that one bear whale is equal to three bull whale.
Think about it. Buy 1000 bitcoin 0.57% can push up 200/300 points, otherwise, Sell 1000 bitcoin 0.57% can drop 400/600 points
If I am a whale, I prefer to throw away and buy again and throw it again. Because I can still make a huge profit.
I know someone doesn't like my opinion, but be realistic.
Ants CANNOT beat the whales. We have to follow their way to survive and make a profit.
I hope you guys have a great day.
