EUR/GBP Prepare for longMy honest opinion is that one of the major mistakes globaly is that traders counter trend immidiately once price hits PRZ. Even with DT or DB you need some sort of comformation, at least break of DT/DB and wait for price to retrace back to the V bottom of DT structure or A top of DB. I found out that the best way to get comformation that trade has really changed is break of EMA 123 and break of trend line with at least 3 touches after that we should watch for retracment so 123 on lower timeframe and then trade break of the retracment. Better safe then sorry ;)
Resons are written on the chart!
If you have any question feel free to ask!
Best regards
Position

Descendent channel in GBP/USDWaiting for the price to breakout the channel in an up trend. Till that moment, i don't expect much volatility

Medium Term Target @ $244.73 with Elliott Wave CycleFrom a technical perspective the $230.65 resistance is a critical area for the upward break and any dip under $217.56 support should be watched as a change in momentum... In the medium-term Elliott Wave Cycle and the Fibonacci Retractment suggest that $244.73 can be seen as a Target with a stop loss at $217.56... Any comments or suggestions would be much appreciated...

Ready for $680 rocket.Enough said, we are done with the dump. On the way to $680 , or even the uppermost target of $720 .
Sit tight and watch! Not the time for any shorting... :) Everything's screaming BUY BUY BUY!
Credits: LowPro & LazyBear for the indicators.

Repost of TBT Long Bat PatternThis is a repost of my initial chart due to price having taken a few weeks to get down to the 'D' point area. I would definitely leave some room for any stop losses under that 'XA' leg in case price tries to retest the shelf its been bouncing off.
Again, I'm looking to get long around 61.30s to not miss the move. I would expect a retest of the B point, but I will usually just stick with a 1:2 R/R and move on.
Volume saw increase during ascent of the 'XA' leg and fell off during the decline and maturity of the pattern.
Also there is some noticeable momentum divergences found on both the stochastic oscillator and mac-d histogram for both the daily and weekly charts.
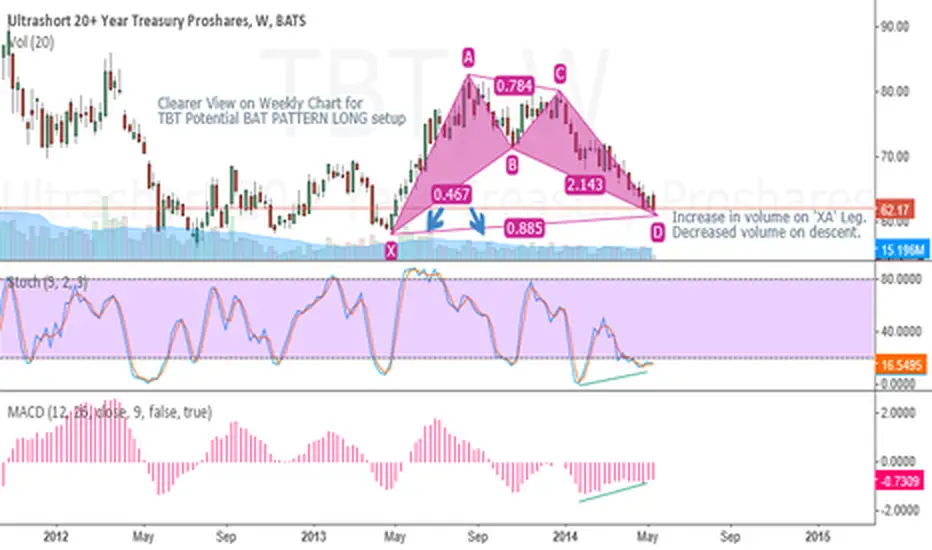
Clearer chart of Potential Bat Pattern for TBT on Weekly ChartI posted the Daily chart a couple days ago; here is the weekly chart which is a bit clearer for people.
Again, I'm looking to get long around 61.30s to not miss the move. I would expect a retest of the B point, but I will usually just stick with a 1:2 R/R and move on.
Volume saw increase during ascent of the 'XA' leg and fell off during the decline and maturity of the pattern.
Also there is some noticeable momentum divergences found on both the stochastic oscillator and mac-d histogram for both the daily and weekly charts.
Entry: 61.30
Stop Loss: 57.97
Profit Target: $67.96

GG broken out of retracment box, Is it still bullish?With the gold miners stocks tend to have a very volatile behavior. They correlate with the equities market as well as physical gold. Hence they tend to gap up and down. That's just its personality. Looking at the long term view, it still looks bullish and the inverse head and shoulder is still intact. Possible morning star reversal forming if it if gaps up tomorrow. (Other miners like GDX, SLW also have the same reversal pattern and have respected the retracement levels). For the miners to be bullish from this point onwards, the equities market and physical gold has to become bullish.( or physical gold has to be more bullish that the equities market, if the recent selling and market correction is to persist. Ignore intra-day volatility and focus on the long term view. Swing/ position trading
