YFII - $2,600 in sight! BTFD!Here we got our inevitable pull back / retest.
Expecting it to resume the uptrend today, no leverage on this trades.
Sell Zones:
$2,100
$2,600
$3,400
$5,600
Stoploss: What you can afford to loose.
Entry: Now
Positivity

btc/usdt by khalid osman btc for nst month beceful if you short in any were in this shit coin put ure stop at 18.6k

Coinbase to delist Bitcoin Cash (BCH) from Coinbase Wallet last chart
Coinbase to delist Bitcoin Cash (BCH), Ethereum Classic (ETC), XRP (XRP), and Stellar (XLM) from Coinbase Wallet!
My price targets:
BCH/USDT short
Entry Range: $108 - 113
Price Target 1: $88
Price Target 2: $79
Price Target 3: $70
Stop Loss: $129


alice/usdt /khalid osman buy in those lince and sell in red taget 2 pac is the best cr7 have an enf did ypu now sad suuuuuu


Colombia slowly but surely on the road to hyperinflationThe inherent weaknesses produced by the pandemic in Latin America have produced the propitious scenario for a new hyperinflation to take place in the region, in this case in Colombia.
This nation that around its history and its abundance of natural resources has been subjected to the old history of the Dutch disease. in such a way that its industrial and technological development sectors have always been depressed. which logically implies that there is a brain drain and a growing commercial imbalance with respect to the United States and now China.
The rulers who are nothing more than a kleptotractic class, who since the beginning of the nation has been bolted to power, have never offered a structural change, also because the legal and structural incentives of the economy prevent political and social change, Consequently, the economic deterioration has been associated with an internal enemy during the more than 50 years of civil conflict and lately the blame has been placed on the immigration of Venezuelans and on Venezuela itself (external enemy).
All these representations already mentioned have implied for the nation a walking on stakes, which cannot produce more than a process of hyperinflation in the medium term. It should be noted that the country's international gold reserves have been depressed by 60% during the pandemic and that the state also assumed new loans that increased the external debt with respect to GDP from 49.5% in 2019 to 54.8% according to the latest report, which implies that in less than 18 months it has increased by a factor of 10.71%.
This aforementioned scenario, logically implies that there are some accused systemic risks within the Colombian economy. It is worth mentioning that the hydrocarbon exploitation and tourism sectors have been depressed for almost a year due to the collapses in the price of crude oil and a significant decrease in tourism due to the pandemic, since these are the most fluid sources of international foreign exchange for the country.
Colombia must take a more serious stance in order to get out of this quagmire, it is not useful for foreign investment or for investor confidence that every two by three they are reformulating trade rules and bureaucracy, the Colombian people will end up going through the gillotine to their rulers sooner or later when there is a depression in the cost of living and a significant decrease in purchasing power as projected in this analysis.
I will finish by explaining the technical part, what we observe in a projection in an equidistant channel; In it, we observe 3 elements, a temporary one that is based on tracing the most significant points of change in the trend or strong movements, in order to postulate a temporary projection of when the next inflationary peak will occur, this is close to the end of 2024, but is can produce sooner. On the other hand, the price is in the upper part of the channel, the only way to reverse this scenario is for the price to correct strongly and touch the lower part of the channel or break it, but it seems that this will not happen. rather it seems that it will look for the technical level of the 3.61 of fibonacci. in less than 3 years. Therefore, it is a bad time to make medium-term investments in the country.
I will end by observing that the country can get out of this scenario, if there is a structural change in the long and medium term in the ways in which the country's economy produces and if the government decides to reduce externalities and make more territorial presence in the country. On the other hand, it is important to have simplified fiscal rules for internal and external investment, under conditions that promote competition between both types of investment, it could be a requirement that such investment must be by mixed law and promote the development and industrialization of the field. ; However, a change in the internal dynamics of drug trafficking and the use of public spending must be fostered. since public spending encourages social immobility, due to the large number of subsidies.
To clarify whether the private sector is encouraged with mixed investment (this is understood as foreign and internal investment, the latter understood as state and private), macroeconomic solutions will be given in the medium term. This will imply a flow of capital and a decrease in structural unemployment, since official data say that there is much less unemployment than in reality, since informality is arbitrarily measured within this standard.
español
las debilidades inherentes producidas por la pandemia en latinoamerica, han producido el escenario propicio para que se produzca una nueva hiperinflacion en la region, en este caso en colombia.
esta nacion que alrededor de su historia y por su abundancia de recursos naturales a estado sometida a la vieja historia de la enfermedad holandesa. de tal manera que sus sectores industriales y de desarrollo tecnologico siempre han estado deprimidos. lo que implica de un modo logico que exista una fuga de cerebros y un desbalance comercial creciente respecto a estados unidos y ahora china.
los gobernantes que no son mas que una clase cleptotractica, que desde los inicios de la nacion ha estado atornillada al poder, nunca han ofrecido un cambio estructural, tambien debido a que los incentivos legales y estructurales de la economia impiden un cambio politico y social, en conseuencia, el deterioro economico ha estado asociado a un enemigo interno durante los masd de 50 años de conflicto civil y ultimamente se le achaca la culpa a la inmigracion de venezolanos y ala propia venezuela(enemigo externo).
todas estas representaciones ya mencionadas, han implicado para la nacion un caminar sobre estacas, que no puede producir mas que un proceso de hiperinflacion a medio plazo. cabe recalcar que las reservas de oro internacionales del pais se han deprimido en un 60% durante la pandemia y que ademas el estado asumio nuevos prestamos que incrementaron la deuda externa con respecto al pib del 49.5% en 2019 a 54.8% segun el ultimo reporte, lo que implica que en menos de 18 meses se ha aumentado en un factor del 10.71%.
este escenario mencionado anteriormente, implica de un modo logico que exista unos riesgos sistemicos acusados, en el seno de la economia colombiana. cabe mencionar que los sectores de la explotacion de hidrocarburos y turismo se han deprimido por casi un año debido a los desplomes en el precio del crudo y una disminucion significativa del turismo debido a la pandemia, pues estas son las fuentes mas fluidas de divisas internacionales para el pais.
colombia debe asumir una postura mas seria para poder salir de este atolladero, no sirve para la inversion extrajera ni para la confianza del inversor que cada dos por tres esten reformulando las reglas comerciales y la burocracia, el pueblo colombiano terminara pasando por la gillotina a sus gobernantes tarde o temprano cuando se produzca una depresion del costo de vida y una disminucion significativa del poder adquisitivo como la proyectada en este analisis.
terminare explicando la parte tecnica, lo que observamos en una proyeccion en un canal equidistante; en la observamos 3 elementos uno temporal que se basa en trazar los puntos mas significativos de cambio de la tendencia o movimientos fuertes, para asi postular una proyeccion temporal de cuando se dara el siguiente pico inflacionario, este esta cerca de finales del 2024, pero se puede producir antes. por otra parte, el precio se encuentra en la parte superior del canal, el unico modo de revertir este escenario es que el precio corrija con fuerza y toque la parte mas inferior del canal o lo rompa, pero parece que no va ocurrir esto. mas bien parece que buscara el nivel tecnico del 3.61 de fibonacci. en menos de 3 años. por lo cual es mal momento para realizar inversiones a medio plazo en el pais.
terminare por observar que el pais puede salir de este escenario, si existe un cambio estructural a largo y medio plazo en los modos en que la economia del pais produce y si el gobierno decide reducir las externalidades y hacer mas presencia territorial en el pais. por otra parte, es importante tener unas reglas fiscales simplificadas para la inversion interna y externa, en condiciones que propicien una competencia entre ambos tipos de inversion, podria ser un requisito que dicha inversion deba ser por ley mixta y propiciar el desarrollo e industrializacion del campo; sin embargo, debe propiciarse un cambio en las dinamicas internas sobre el narcotrafico y el uso del gasto publico. pues el gasto publico propicia una inmovilidad social, debido a la gran cantidad de subsidios.
para aclarar si se incentiva el sector privado con inversion mixta(esto entendido como inversion extrajera y interna esta ultima entendida como estatal y privada), las soluciones macroeconomicas se daran en el medio plazo. lo que implicara un flujo e capitales y disminucion del desempleo estructural, puesto que los datos oficiales dicen que existe un desempleo mucho menor que el que en realidad existe, ya que se mide arbitrariamente la informalidad dentro de este estandar.

ATOM/USDTAtom shows more quickness then other shitcoins but trend still looking in to the hell.
So we got 2 scenarios: upside and downside ( it always been lol)
case of upside depends on the low of 11.5 so bulls need to save that low to prevent structure breakdown then we may see upside
case of hell which looks mmore real to me: bears will ruined the level then MM going to take all that liquiduty( blue lines) he made while we grew and the character of trend makes me to look more at hell scenario, common this lows is too obvious. ISNT?
but one legit thing in hell scenario is corrections around $8-$10 we could see and I could long because the healthy assets doesnt fall in couple bars, you know. MM playing with ATOM like a mf so I want to see good bounces.

CSPR died in January 2021, like RchainHyperinflation during bear market - same marketcap as we had in 20c in August 2021
The team has bad image - team scolding people in Telegram (already deleted), I have screenshot in case people say I am lying
Not listed on any major exchange since listing - hyped up Binance, never came
Still no use case
Slow chain, slow finality - eth2 coming so completely useless
Same team as RChain was also Casper fork - utterly failed
There is heavy selling pressure from validator - in entire bull market it did 10% up maybe then full retrace. I saw it going up by 10-30% many times during autumn 2021, all to retrace. Casperpad was also a scam - but good enough for final double top

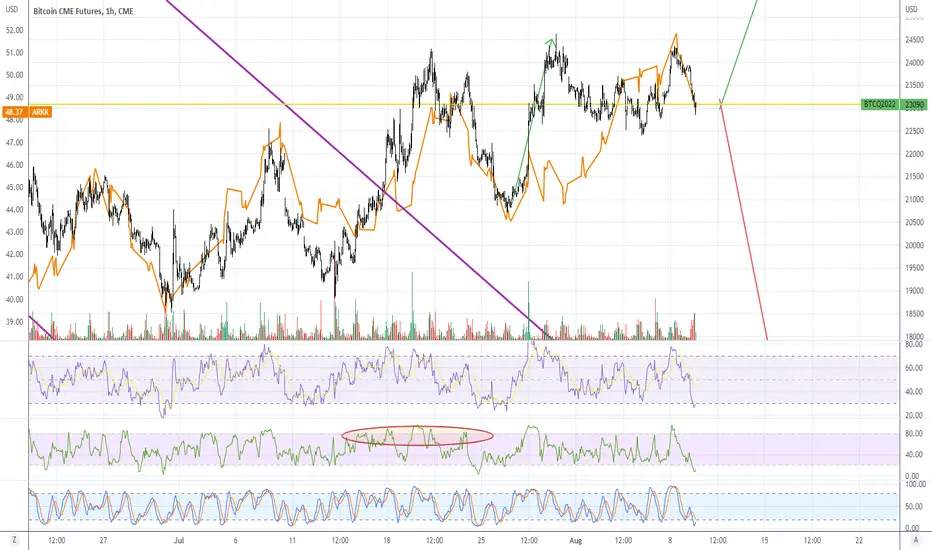
BTC - ARKK OverlayHere's what I mean when I say Bitcoin is tracking garbage stocks, the overlay is ARKK, Cathie Wood's garbage ETF.
This is an hourly chart, that's how close BTC has been tracking garbage.
BTW, Cathie Wood tends to chase after garbage, whatever you do don't buy her fund. You'd be better off randomly picking stocks yourself. Look at her portfolio before you buy that junk. ARKK is a sinking ship, lol.
New BTC OverlayThe best I can tell, BTC is trading in line with garbage stocks like PTON. Obvious short squeeze the last couple of days.
So I lost money trying to short BITO over the weekend and made it back by shorting PTON yesterday, lol.
In any case, probably done playing with BTC for a while, I'll stick to shorting garbage that I'm more familiar with. The way to play BTC is like any garbage stock, short the pumps then flip. Maybe hold just a few put contracts in case it tanks, but don't get greedy.
CPI release tomorrow, so that can tank the market, but I think the numbers will be better than expected this time. No positions, all cash for CPI.

APE/USDHey partner this coin called ape is about to go ape shit. Buy in 6.80 Sell 13.5.
We look for the diamonds, so you don`t have to.

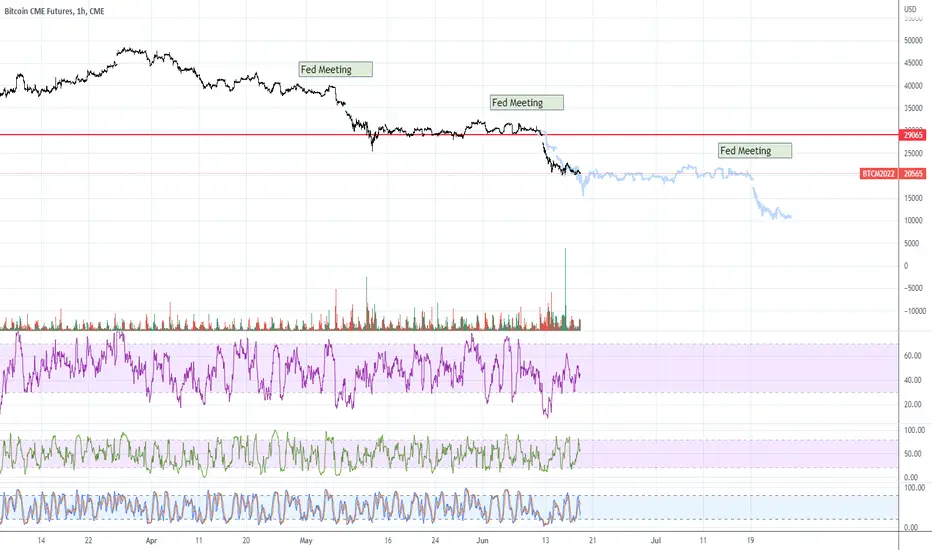
BTC PatternDrops $10k every Fed meeting lol. So probably breaks below $20k over the weekend but rebounds back and drifts sideways until the next Fed meeting.
Idiots were told to wait until after the Fed to buy so a bunch of them did. Didn't bother to read what Powell said, .5 or .75 in July.
The time to buy this garbage is when the Fed stops raising rates. The first meeting where Powell says no increase next meeting this will probably double from wherever it happens to be. Now that could be $10k or $5k, doesn't really matter. Stop looking at price levels and just base timing on the Fed.
KingShiba - time to LIFT OFF! $64KingShiba is a meme-based-coin, but with great potential in the near future. We're almost in the 3rd wave, we can buy from here (I bought from 0.004).
We (will) have NFT, Swap, Play-To-Earn... don't miss out, but, use risk management properly and be patient.
Buying prices:
0.005, 0.09
Target: $1. $30, $64
See you soon.

FIAT IS SHITCOIN !1000 Euro in 2008 = 1600 USD
1000 Euro in 2022 = 1060 USD
And if you bought 1000 Euro of BTC in 2011 now you would have : 689.65 BTC that worth $20,689,655 !
So Dear Mrs LAGARDE what is the reah shitcoin?!

BTC Long Opportunity Setup Coming SOOOON!!!!!!!!!!!!Be Careful Guys ..Don't FOMO!!!!
Be patient, manage your risk and Always don't Leverage Over x3.
Good Luck everyone.

DOGEUSDT ShortHey traders, in today's trading session we are monitoring DOGECOIN for a selling opportunity around 0.16 zone, once we will receive any bearish confirmation the trade will be executed.
Trade safe, Joe.

Sol update: rug pull soonish$Sol has finished its scam to no where, hopefully the next pump will be off of a lot better utility instead of some silly NFT art that are truly worthless compared to their selling prices.
They all sold you the dream here lol
Still under a wave 5 sell off IMO

REEF/USDT Long scoin tradeREEF/USDT conservative long idea at key support level. Bitcoin is looking strong, keep in mind that a correction in the short-term might be possible.
TP1: 0.01514 (0.236 fib level)
TP2: 0.01964 (0.382 fib level)
TP3: 0.02327 (0.500 fib level)
SL: Not cast in stone.

$JASMY - Where next?
This was the original Idea. Now that we have a bit more PA to work for, we can try to establish new targets for this wave structure (which I've highlighted in the box).
I,m still not 100% clear on the waves here, but assuming higher degree wave 3 is already in, we can elaborate maybe an extended 5th to the 3.618 fib range.
Safe trades, don't forget to take profits along the way.

$WIN - The shape of PA indicates the bottom is either in or nearI've marked this move as done, but that is one of two counts. I usually like to see 3 touches on the trend line of 5th ending diagonal. We are in 5 of 5 of C at this point and I'm very excited about this coin's bounce. I might dump a bit into this long term play.
If we zoom out a bit, on the daily, we can see a lot of divergences on many oscillators as well as volume. There is also some convergence on the left side of the chart aligned with the box I'm going to long from:
Safe trades to everyone.


SLP, 1400% gain?People said me 2 months ago that I'm wrong on SLP. It does not matter who is right or wrong right now. Let's look at SLP neutrally even though it's called as "shitcoin". Chart reading and indicator shows that it could go up. Possible max gain would be: 1400% from the red support line. Good luck in trades, buddy.
