Two possibilities in BTC, A OR B?We are at a point where we are seeing lot happening in few days. Some say its good for BTC, some say its bad.
I think there are two possibilities present in market (some will say that's always the case, right! But here me out here)
I think this is a breakout, I also think this will be last breakout in BTC's life on upside, but before BTC completely dies out, its still possible to hit previous all time high.
Possibilities

BTC possible Elliot Wave ScenarioHello all my friends.
i hope you have good days and best things happen to you.
i have a possible idea about BTC moves.
in 1D chart historically we saw the first leg of correction with 5 wave ( I II II IV V )
that i mark it on my chart.
then we saw an extend B wave composed from 3 sub waves (A B C).
now we are in the third and final leg of correction i think , wave C.
we know that wave C typically have 5 sub wave.
and probbably we compelete 3 part of it.
so we can go up to 100% of sub wave 2 for introducing wave 4 (about 24000 to 25000).
after that if we dont see improvement in most countries inflation and
the SEC decision to increse interest rates we should go downward as wave 5 to about 14000 - 16000
and i think this will be happen.
after that BTC can make a bottom and after a while start a huge uptrend.
this proccess may take long time.
so be patience friends.
if you like my opinion plz like it and if you dont agree with me
share me your opinion in comments.
thank you all.
!!!NOTE!!!
MY POSTS ARE NOT TRADING AND INVESTING ADVISE
SO TRADE ON YOUR OWN STRATEGY AND CONSIDER MARKET RISKS.

Ether SleeperI apologize for difficulty to understand.
I hope this helps others see what I see and hopefully it will help someone somehow!
GL!

The Levels that I watch for !Here is my basic levels of value that I look for to place my trades, daily , weekly levels , pocs , and some SR .
Vwap and volume .
Now all its left is ... Place you trades .

i think nifty today sideway or down today nifty down or sideway
break 16600 level and sustain down to short and buy PE / sell CE
or 16600 level make support and go up to don't today trade opportunity because market go sideway.
NSE:NIFTY

USD/ZAR PossibilitiesThe Rand ran it up the past few days, A few doji's before and during the rally are signs of it getting weaker. So Price can either nearly touch descending trend zone, or bounce down & continue. All in all I'll be watching diligently for some solid confirmation in candle play around these zones. What are your thoughts?

$BTC; nearing a breakoutUpdate: $BTC needs to bounce on the support trend line (lower TF) to remain bullish, possibly testing $60k. If we break, $53k is the first big one we'll be testing and anything around $50k is a buy zone for me.


XAUUSD ANALYSISPossible reversal at the 1750 zone once again forming a double bottom but if this zone doesn't hold then i will be looking out for possible reversal between the 1720 to 1680 zones.

EURJPY BULLISH POSSIBILITIESat this zone, I will be looking for possible rejection to the upside. possible head and shoulder pattern to be formed at this zone.

EURUSD BULLISH POSSIBILITIESat the 1.175 zone, will be looking for possible reversal.
expected right shoulder to be formed, if violated, I will be looking for possible entry at the 1.6643 zone.

CAD/CHF SEEMS TO BE IN TRICKY SITUATION !! It seems that this Pair has two possibilities, It can either continue the Bearish Trend and fall to 0.70933 - 0.70425 (70% Chance)
Or It can created Double Bottom and reverse the trend in Bulls' Favor (30% Chance)
Wait and See is Recommended.
If the Price breaks 0.71700 then SHORT AROUND 0.71600 with the Target of 0.70933 - 0.70430
With Stop Loss of 0.72100.
Note: Please do your own research before any trade action.

GBPCHF break a wedge The pair has broken a rising wedge recently and is now trading below the 50 sma in h4 chart and is in the bearish mood, we can clearly see the important divergence from the rsi to the price action; price will be pushed down towards the red line which highlights the first important support, if you decide to open a sell trade pay attention to the moving average and place a stop loss above it. Keep in mind that the pound is fundamentally not weak yet because due to its good GDP DATA and INFLATION is stillstrong in the long term but now we can try to cath a short term move.
Francesco

BITCOIN Possibility is ___ % BITCOIN Possibilities is ___ %
What in the world is this, well basically this is getting the hell out of BTC and maybe going short, on the B.T.C.
That's right. Bold predictions for you elegant trolls.
I firmly believe Tradingview has one of the if not the best troll community on the internet.
But that's not stating a lot.
BTW why does Tradingview have better trolls than Twitter, YouTube and Reddit?
Twitter trolls, not so witty
YouTube trolls, depraved and vulgar
Reddit has it's moments
I've answered my own question neglect that last question, thank you.
If your still reading this GREAT lets keep going!
Regarding my TA this is my prediction.
I've hidden all Indicators and most tools, I've only left Elliott wave ABC countdown and ABCDE. These waves might play out accordingly. If this happens correctly I guess I won't be a noob. OK I'll still be a noob but not as much. I don't want to be too different from you elegant trolls.
BTW, Have I mention how beautiful all of you are?
Let me tell you, you are beautiful! I mean it!
I believe BTC is coming down to my price targets and dates. I think the price targets are realistic and most are modest. Sometimes I can be shy and some days I tell death NOT TODAY! Maybe it's time to embarrass myself though we'll have to wait and see.
I think the dates might be on point or maybe I'll be wrong by a week later or sooner.
Time is precious and BTC is becoming more valuable.
Valuable as in BTC is worth a great deal of money? NO
Valuable as in overbought. BTC is on a level above its intrinsic or fair value.
If you don't agree than just smash that like bottom.
As Joey B would say,
"anything is possibilities, I mean anything is awww common man!"

Possibilities ready for buy at every deep.NSE:RELIANCE
Possibilities ready for buy at every deep.
Investment Pick.
Disclaimer: I am not a SEBI register person please contact your financial advisor for advice

Daily possiblitiesIts horrible ...
Wedge patter in market or divergence in rsi and ma strategy?
We have different signs here ... they are strong signs in each side.
Personally I think we are going down because we have more possibilities for short here ...
Lemme tell you them:
1_ Rsi divergence
2_ Fail in breaking local resistance(10k and 10500)
3_ Ma strategy(we lost support of ma 50 and it means there is potential to touch ma 200)
4_ Short sign by cmf strategy
There is some chance for up trend too:
1_ Up trend wedge pattern
2_ A chance to break ichimoko cloud(We are in the cloud for now ...)
3_ Some fractal ideas because of staying above 9k
4_ Candle engulfing
I didnt found any thing yet ...
If you liked it, please hit the like button, share and write your comments and follow me, thanks for reading.
Take care, trade safe

Daily is still dangerous to long ...
Ok guys as you can see rsi is in divergence mode and it has a support line, breaking the line means we will see 7k~8k soon as possible.
By ichimoko we have to confirm the bottom line of channel and the first target for confirmation is 9100, breaking this support means we will see 8800 again.
By ma's if we lost ma 50 and 20 as dynamic support it means we will test ma 120 and 200 as dynamic resistance and target will be in 7800 ~ 8k.
If you liked it, please hit the like button, share and write your comments and follow me, thanks for reading.
Take care, trade safe

Danger zone ?Alright, we are here again ... danger ZONE :|
Yesterday btc movements supersized me :| and I got failed after a week in my journal ...
BTW, lets see
We have support line in rsi and new resistance line here, CMF shows the potential and support of macd ...
Cross overs of ma's and also price is more than ichimoko cloud.
There is only one thing which is really scary ...
Local resistance is high time frame ... (Im worry about bulls related idea)
But there is a support line here too ... (My only hope for 10k)
What is my suggestion? I recommend you to wait for the confirmation in 1h for a little trend, breaking the resistance line in rsi means 9900, and breaking the support line means 9400.
If you liked it, please hit the like button, share and write your comments and follow me, thanks for reading.
Take care, trade safe and good luck.

4h is getting more complicated...Lets see what do we have here ...
Bears:
Possible inverse cup and handle, possible inverse H&S in rsi, rsi divergence, cmf divergence, macd is less than axis line and its gonna make red ones.
Bulls:
Bull flag, candle engulfing(While cmf was more than 0), rsi support on 50
Which one is the winner? what do you think ?
Im in bear side ... because of older ideas I've published, and also these signs ...
Lets see what will happen.
If you liked it, please hit the like button, share and write your comments and follow me, thanks for reading.
Take care, trade safe

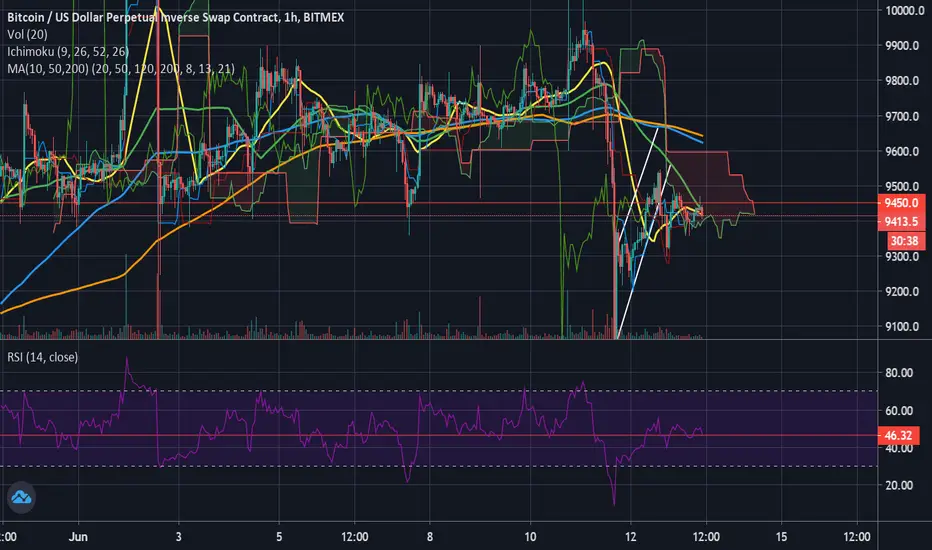
Possible pullback to 9700Price went into ichimoko cloud, rsi and macd are in range now, ma 50 acting like dynamic support, and ma 100 and 200 showing the potential of 9600 ~9700 area.
Personally im in short because of ma cross under, bear flag and descending symmetrical triangle and also some fractal ideas which people talked about.
Such as :
But yesterday we had a big downtrend to 9k and we can confirm that our channel changed to 9k ~ 9450 for now, but price should confirm the resistance ! which would around 9700.
So in my opinion if you didn't enter trade for now, wait a few hours for more info and confirmation of indicators.
If you liked it, please hit the like button, share and write your comments and follow me, thanks for reading.
Take care, trade safe
Longing GBPCAD after the D Leg completionWell there are multiple possibilities here. Personally I would set buy limits at the D points.


NZDCAD LONGING AFTER COMPLETION OF D'sIt gonna be short for now till either of the D completion. Got a Bat and a butterfly pattern possibility. Let's see what completes first.
