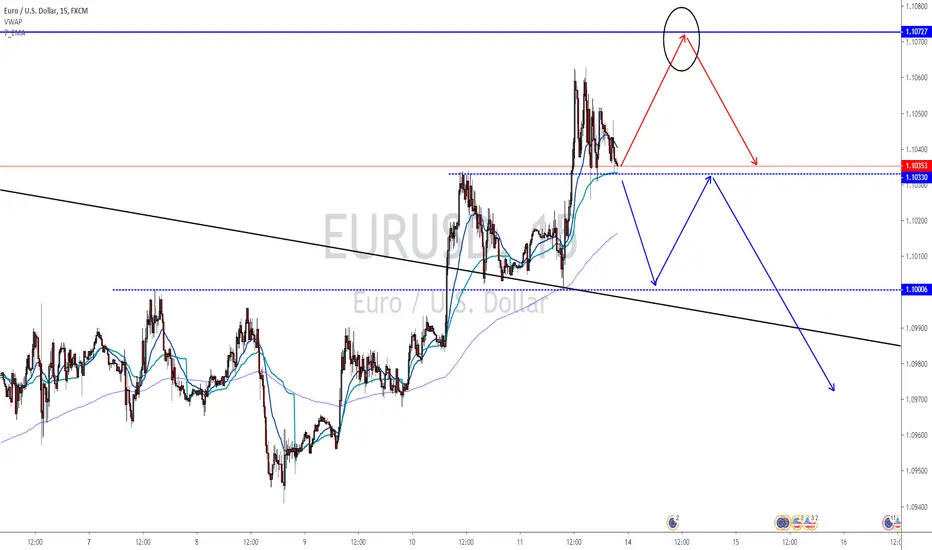
EURUSD IS BACK?! Price has came back to the same level as previous chart that i have attached.
Last week, price came to this level and bounced up with more than 120 pips.
Followed by another 120 pips drop too.
So there is an possiblitiy that price will bounce up again BUT there is also possiblity that it is an TRAP move to inicite buyers to jump in only to get stopped out.
I will wait for the price to BREAK the support for the confirmation of a trap move.
But then again, you will have seen exactly same thing for GBPUSD also.
There are simiarlity to those pairs.
Potentialreversalzone

KHC, Kraft Heinz Co. - Potential Breakout on H&SNASDAQ:KHC
One of the best set ups.
Currently on Kraft Heinz is developing a classic reversing head and shoulders.
It is also one of the companies in the portfolio of the world's largest investor, Warren Buffett.
If we think about the potential recovery on the stock value, the Risk Reward becomes remarkable and the % of trade realization at profit remains as usual around 45%.
So we've set the alerts and we're waiting for a neckline breakout.
Stay Tuned!


Cardano trying to brake the BEARMARKET and start new BULLTREND!The longer i look at chart ADA to BTC the more i have to think about potential breakout out of correction and probably finally chance to start a new trend. We saw big dump / recession which lasted almost 2 years , now we can see a slow consolidation / accumulation at the bottom of the charts for few months and contiuously gaining buy volume out of BULLS . Pump - Dump - Consolidation should be the end of the big market cycle. Are we ready for another bulltrend ?
At the 3D chart we see great falling wedge pattern which is known as BULLISH for 70% of cases and mostly works like reversal pattern in bearmarket . After 1 and half year Cardano broke up the big downtrend resistance trendline a continuously gaining buy volume for 20 Days in a row . That volume is not so enormous but may be a good indicator of the reversal idea .
At 1D chart we see the interest of ADA to breakout the symetric triangle at the bottom of the trend and strong accumulation zone PoC , and also the breakout happened through the resistance trendline of the great Falling Wedge in one time , so the timing was perfect. Just the volume was not so extreme.
Here is the 1D chart :
Also i connect 4H chart to see ADA come to confirm the trendlines as a support and continue with the actual uptrend.
4H chart :

BNBBTC Strong BullishBNB made Bullish reaction in Potential reversal Zone! We are going to our first target of Bullish Gartley Pattern! + In chart you can see Bullish BK Cross. Everything in this chart is bullish guys :) Buy it if you can. I wish you at least +30% profit ;)

EURUSD #Forex #ForexTrader #ForexTrading #ForexChartForecast for my 15min TF strategy.
Very bearish on the daily TF but gaining strong momentum on the 4 hour and hourly TF
Will be waiting to see how price reacts around the current level, but with the US/China trade war seeming to have positive talks, could see some dollar strength and push the EURO lower
Any questions feel free to ask, by dropping a comment or a message im happy to help
Ben
#PipGainFX
ONT Bullish Cypher PatternONT forms Bullish Cypher Pattern but in this moment we are waiting for bullish momentum. Stop Loss, Take profits, PRZ in chart ;)

ONE Bullish Shark PatternSame like THETA. ONE/BTC forms Bullish Shark Pattern but we are waiting for bullish momentum from PRZ. Now we are in PRZ, so it is good opportunity to buy some tokens ;) Keeps wathing this coin, Targets, Stop Loss, Buy zone in chart.

THETA Bullish BAT PatternTHETA/BTC forms Bullish BAT Pattern on 4H Time Frames! We are still waiting for bullish momentum in our PRZ. Buy zone, Targets, Stop Loss in chart. Keep watching this coin ! :)

HT Bullish Alternative BAT PatternWho likes to trade on Huobi Exchange should watch this Bullish Alternative BAT Pattern ! HT Already hit first target, but this coin is having high buy volume. Don´t worry jump into this trade and try to get some %%%. Reaction in PRZ was great. Targets, Stop Loss in chart :)

QTUM Bullish Crab PatternQTUM is forming Bullish Crab Pattern, which already hit first target. If you wanna trade this Pattern again, try to catch retrace of first impulsive wave like you can see in chart. Targets, StopLoss, buy zone is written in chart. This Cryb pattern is precise and price action in PRZ was excellent :)

Nikkei 225 index formed bullish Shark | A good long opportunityPriceline of Nikkei 225 index has formed a bullish shark and entered in potential reversal zone.
I have defined the targets using Fibonacci sequence as below:
Buy between: 20094.62 to 20460.02
Sell between: 20779.31 to 21503.43
Regards,
Atif Akbar (moon333)

WAN Bullish Bat PatternWAN maybe forms Bullish BAT Pattrn on 1H time frames. All important values, rezistence, PRZ, take profit you can see in chart :)

BTC bearish BAT PatternI´m looking for this bearish BAT pattern on BTC. PRZ is in zone 11 100$ - 11 300. Target Fib. retracement 382 and 618.
What do you think about this set up? Let me know in comments bellow.

NIO - NEUTRAL - Patential support 2.50Potential support for NIO at 2.50. I will update NIO welcome to follow the big potential
Don't try to cath a falling knife. No forcast, nor exitement as it still on a pretty steep slope down...


Inversiones AguasChilean Stocks.
Pure Technical Projection.
Shark + Gartley
Wait for entry between 930 and 940.
First target at 7% = around 990.

Cypher & Double-Top! Sell if we Break back into Channel!Hey tradomaniacs,
welcome to another possible scnario with great potential!
Type: Swing-Swingtrade
Sell-Limit @ 1.294 (After break through ex-Trendline)
Stop-Loss @ 1.30673
Target 1 @ 1.28832
Target 2 @ 1.27850
The SELL-Price can vary! This is up to the time we breakout and retest the recent support, which is the recent trendline!
WAIT FOR THE BREAKOUT! :-)
Peace and good trades
Irasor
Trading2ez
Wanna see more? Don`t forget to follow me!
Any questions? PM me. :-)

Daily Chart-EURUSD Potential Bullish Cypher Pattern FormingFX:EURUSD
If current support level doesn't hold. We could see potential move to point D to complete the Bullish Cypher Pattern.
Enter Long at Point D : 1.13950
TP1: 1.15547
TP2: 1.16533
SL: 1.13000

BTC Fib ZonesMore detailed chart. I enter the fib values manually to ensure theyre precise. BTC likes to bounce in this .886 - 1.13 zone. 1.27 lining up with trendline is likely target if 1.13 fails to hold. Secondary fibs lining up with 1.27 and 1.41. Notice the price action how the candle wick slap the fib on the first day of contact almost every time. This is where i have my orders at.

BTC Case for BullsBTC is currently resting on pitchfork 1.75 fib support. I don't imagine it holds, as there is almost zero historic price action in this range. The full extension of the pitchfork is confluent with the .618 fib retracement level, which to me makes perfect sense for a bounce. If this holds, we validate the bullish case for a potential reverse in market sentiment => establishing a higher low which hasn't happened during this bear market. Watching this VERY closely.
Target Long entry would be between 6720 and 6850. 6720 is bottom of golden pocket (.65 fib retracement) and has a lot of historic price action. Also it is a fake-out break-out from the pitchfork.
I'm afraid that if 6675-6700 doesn't hold, we set up a scenario that most likely re-tests the April lows (6400), then June lows (5800). 5800 has been tested 3 times, so likelihood of it holding is not very likely. Pray for a bounce here...

Potential Head and Shoulders Fakeout into 200 MA then breakdown Bulls have tested 6800 area 6 times since June 18th, I think if we head back up there and the head and shoulders pattern plays out then we will break up towards 7000 area. Maybe consolidate around then and move up giving the resistance time to come down. The 200 MA is moving down and we fell out of the sky last time we touched 200 MA, also the 30 week MA is heading down at an accelerated rate it would be a great setup to get everyone bullish and then wreck them. The ultimate last chance to short!

STORM/BITCOIN PROFIT POTENTAIL 38+% buy now or wait if price drop to 270sat
hold this coin 1month
good luck
