Potential for Almost 800 Pips on the GBPUSDHere on the GBPUSD there is a potential long setup for close to 800 pips of profit. If we see price break down impulsively idea will most likely be invalidated. Price action on the daily timeframe is supporting this trade idea. Trade with caution and good luck.
Potentialreversalzone

BTC Down Trend Channel and Potential Support Area with ReversalGoing to keep this idea simple and short.
1) BTC has been stuck in this immediate downtrend channel since the 24th of March, as indicated by the white trend lines.
2) There have been identifiable Elliot waves that seem to support the idea of BTC trading in this range.
3) The bottom long green rising trend line has been previous support for BTC on more than once occasion.
So what I predict:
BTC will follow along the channel in the predicted wave pattern, move to 7900, back down to test the rising green support at 7700. At which, I believe the bulls will have enough push to move the price outside this downtrend channel and to at least 7900. Beyond that, I'm not sure what could happen. Perhaps 8k will seem monumental. If the bullish momentum follows through, that may very well end the down trend and thus begin a new trend. Hopefully that trend is upward, and not another downtrend channel.
*I Just have to mention this disclaimer, everything you have read here is not trading advice or a suggestion to purchase anything and was created purely for my entertainment. Any trade you embark on is 100% your responsibility, in other words, you reap all the risk and at the same time all the reward. Do your own research first and only trade what you can afford to lose!
Good Luck everyone and may BTC reach Mars before Elon Musk,
-Gendark2

TNB - News? Time New Bank BITFINEX:TNBUSD is going up and looking to cross on RSI and MACD, also if it can break the resistance level at around 0.033, we could expect more up.
This project by itself has potential, it it just a bit weird for it to go up right now since BTC is consolidating at around 9500-8700 and is more likely to go down.
The reason for this potential up is because of launching of the first time trading platform - mitfund.io
Also, here you can find the news - twitter.com
Let's be careful and see how this trade will develop.

NEOUSD analysis, back to the top or incoming crash?NEO is close to strong resistance. If a candle closes above resistance, it will confirm a buy signal towards the top again at 100% of the fibonacci pattern. If it bounces off resistance, it will likely visit 125$. This may make it bounce to 158$ again, or break through to 106$. The ideal entry is 106$, as a bounce from that price is very likely with a high reward potential. However, one must consider that the entry point may not be reached again, since it may already bounce off 125$. Therefore, make a decision beforehand to prevent being influenced by FUD. If option 2 happens, I suggest buying with 50% of your NEO-investment-funds. If it moves up, you can use the 50% remainder to invest in other coins: don't let the FOMO get to you. If it moves down, you can cost-average it by buying with the remaining 50% at the ideal entry point.
Remember to set your stoplosses when you enter: markets can sometimes be irrational.
If I made you money, please consider buying me a beer to make my day:
LTC: LfbKuDHZaDTRUV9pXJuWCUcG14XLrGtBcs
ADA: DdzFFzCqrhsfoyxqADKYK7mMAMpoMUqjuNeN39aJZx6v2ZHnBxuC79p8QJWJ713mAmRHxF9hS87YKMkD4JLF1rdxLU7ugzRtViBETfWa
Feel free to ask me questions or to ask me to perform my analysis on a coin of your choice.
Happy trading!

It should be watchedIf it breaks the neckline, 0,618 retrechment can be possible. It should be watched, if it doesn't break the neckline the chart can be a flag, and a continuation will be watchable

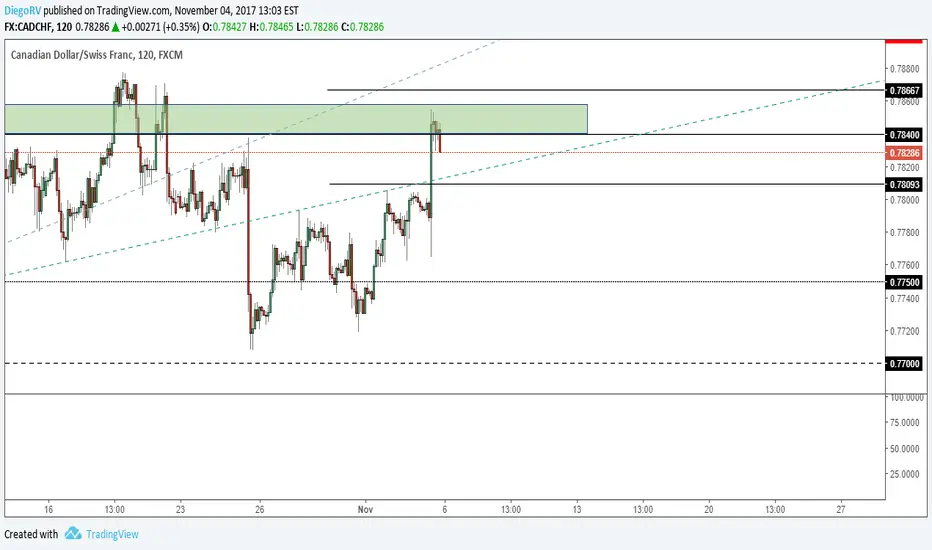
CADCHF - Price rejected from potential reversal zonePrice has been rejected from potential reversal zone. Key levels on chart in case of bearish trend continuation.
BTCUSD Update: Very Important LevelBITFINEX:BTCUSD hit our first top projection at 6200 level, but we still see room for a new high, so we have to be very careful arround those levels! We believe that Bitcoin is in minor three wave correction of red wave (IV) with strong support arround 5000-5200 level and 38,2% Fibo. retracement. Keep in mind that 4th waves can be very complex, for example: flat corrections, triangle patterns or even more complex corrections. If Bitcoin goes straight to new highs, be aware of 5th wave, our second top projection arround 6400. But if Bitcoin from any reason declines and breaks lower our strong support at 5000, then we could face even bigger and much sharper decline back to arround 3000, where we see next potential support!
Have a nice weekend!

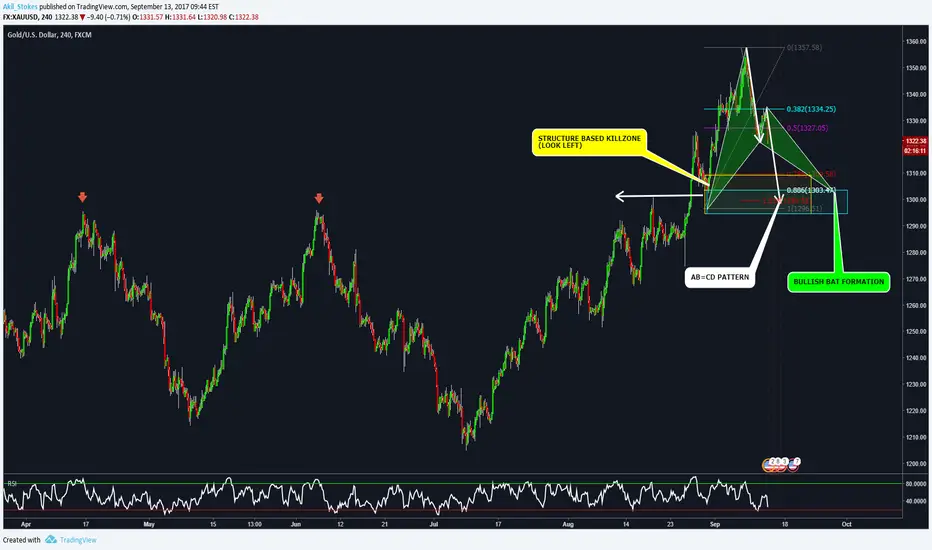
GOLD - Bat Pattern & Ab=CD PullbackJust took a look at this with our live room members, but we have a potential bullish bat formation lining up with an ab=cd pattern coming right into a killzone that we had drawn out from the higher timeframe. I'm not expecting a continuation trade out of this one due to where price is located, but i would expect to see some sort of reaction at that level.
Akil
Happy Champions League Match Day
SNAP PRZ Stabilizing < 15SNAP turning bullish today after test < 15.
RSI stabilizing on daily chart.
SNAP HERE!

USDCAD - Down Trend - Its unlikely that Resistance Break Potential Dip Sell - Wait two candles to exclude a breakout!


Potential set up EURGBPPrice has been in a consistent short-medium term downtrend. All signals are pointing to continued bearish momentum on this pair. My next zone of interest is the PRZ as shown on the chart. If price follows the rules of the Harmonic pattern in place, then there should be a very good potential setup for a bullish run.

Bullish BAT Pattern - CADCHF (240 Mins)Hello Traders,
I have observed a potential bullish bat pattern on CADCHF 4 hours chart. Here, PRZ is made of 0.886XA, 1.27AB=CD, and 1.618BC Fibonacci ratio confluence. This potential trade has a risk/reward ratio of 1:.1.4 for Target-1 and 1:2.2 for Target-2.
Happy Trading!!!

Bullish Harmonic - GBPAUD (60 Mins)Hello Traders,
We have a potential bullish bat pattern setting up on GBPAUD hourly chart. If pattern completes, we expect price to resist in PRZ and set us up for long opportunity. Here, PRZ is made of 1.27AB=CD, 2BC and 0.886XA Fibonacci ratio confluence. This potential trade setup has a risk/reward ratio of 1:1.4 for target1 and 1:2.2 for target2.
Happy Trading!!!

Bullish Gartley - USDCHF (240 Mins)Hello Traders,
I have observed potential bullish gartley on USDCHF 4 hours chart. I am expecting price to resist in potential reversal zone and reverse. Here, PRZ is made of 0.786XA, 1.27AB, 2BC, and AB=CD Fibonacci ratio confluence. This potential trade has a risk/reward ratio of 1:1 for Target-1 and 1:1.7 for Target-2.
Happy Trading!!!

Bullish Gartley - AUDCAD (60Mins)Hello Traders,
I have spotted Bullish Gartley Pattern on AUDCAD hourly chart. Here, PRZ is made of 0.786XA, 1.27AB and AB=CD Fibonacci ratio confluence. This potential trade has a risk/reward ratio of 1:1 for Target-1 and 1:1.6 for Target-2.
Happy Trading!!!

Bearish BAT - CADCHF (60 Mins)Hello Trades,
I have observed bearish bat pattern on CADCHF hourly chart. I am expecting price to resist in potential reversal zone and reverse. Here, PRZ is made of 0.886XA, 1.27AB=CD and 2.618BC Fibonacci ratio confluence. This potential trade has a risk/reward ratio of 1:1.4 for Target-1 and 1:2.2 for Target-2.
Follow this idea for further updates.
Happy Trading!

Alternate BAT Pattern - GBPUSD (60Mins)Hello Traders,
I have spotted alternate bat pattern on GBPUSD hourly chart. Potential Reversal Zone (PRZ) overlaps with previous structure support. It looks like a high probable area for reversal. This potential set-up has a risk/reward ratio of 1:1.4 for Target-1 and 1:2.2 for Target-2.
Follow this idea for further updates.
Happy Trading.

Bullish BAT - AUDUSD (60Mins)Hello Traders,
I have observed Bullish BAT pattern on AUDUSD hourly chart. Potential Reversal Zone (PRZ) is highlighted for BUY entry. This harmonic trade set-up has a risk/reward ration of 1:1.5 for Target-1 and 1:2.4 for Target-2.
Follow this idea for further updates.
Happy Trading!!

USD/JPY Shark Bullish Setup 111.200USD/JPY
-potential long opportunity at the D leg completion of bullish Shark setup.
Stop loss would be 20-30 pips of D
Target 1 - 112.856
Target 2 - 113.651

Potential Bearish Harmonic - NZDCHF (4Hr)Hello Traders,
I have observed potential Bearish Bat Pattern on NZDCHF 4 hour chart. Potential Reversal Zone (PRZ) is highlighted for short entry. Here, PRZ is made of 1.27AB=CD, 2.24BC and 0.886XA Fibonacci ratio confluence. This potential set up has a risk/reward of 1:1.4 for Target-1 and 1:2.2 for Target-2.
Follow this idea for further updates.
Happy Trading!

Bullish Bat - AUDCAD (4Hrs)Hello Traders,
I have observed Bullish Bat Pattern on AUDCAD. I have highlighted Potential Reversal Zone (PRZ) for short entry. Here, PRZ is made of 0.886XA, 1.27AB=CD and 1.618BC Fibonacci ratio confluence. This potential trade has a risk/reward ratio of 1:1.4 for Target-1 and 1:2.4 for Target-2.
Follow this idea for further updates.
Happy Trading!

Bearish Harmonic near structure - EURNZD (60mins)Hello Traders,
I have spotted Bearish Butterfly Pattern on EURNZD. I have highlighted Potential Reversal Zone (PRZ) for short entry. Here, PRZ is made of 1.27XA, AB=CD, 2BC and 2.24BC Fibonacci ratio confluence. I am expecting that price will resist in this area and reverse.
Follow this idea for further updates.
Happy Trading!
