GBP ... looking for scalping ?hello dear trader
this price action look like roadmap for trading
Maybe I couldn't get my point across in voice
but the levels are completely clear
stop loss need for any position
good luck 🍀
Pound

✨ NEW: GBPUSD ✨ POST USD NEWS ✨TP3 @ 1.3970
TP2 @ 1.3570
TP1 @ 1.2840
BSO @ 1.2540 ⏳
BLO @ 1.2455 ⏳
00:00 US Dollar Index Analysis
01:15 GBPUSD Curve Analysis
01:44 Entries and Targets
02:16 Sell Order (Pending)
002:53 Boost, Follow, Comment, Join

GBPUSD Daily AnalysisSharp bearish leg after being range for a while, sign of STOP HUNTING zone. Now we expect more falling, after bullish retrace.

GBPUSD about to make a big move down?I've been closely monitoring current LTF price action and about to go short on this pair. We've retested last weeks broken dynamic support, and running out of steam right now.
I'm seeing DXY continuing to grow, to at least 105 in the coming week or so. BoE hawkish sentiment, failure to get inflation under control, despite hikes gives the mark no confidence, and therefor a risk off mentality.
My ultimate target is 1.185 area, but will be taking partials on the way down.
Happy trading!

GBPJPY SELL SETUPGBPJPY is approaching a solid confluence area in the neighborhood of our R1 Pivot. The target will be 167.75 for a 5R trade. Good luck!
~ Happy Trading, Cheers! 💰

EUR-GBP Will Go Down! Sell!
Hello,Traders!
EUR-GBP was trading along
The rising support line
But then broke the support
Cluster which is now a resistance
And went up to retest it
Recently so this week I will
Be expecting a move down
Sell!
Like, comment and subscribe to help us grow!
Check out other forecasts below too!

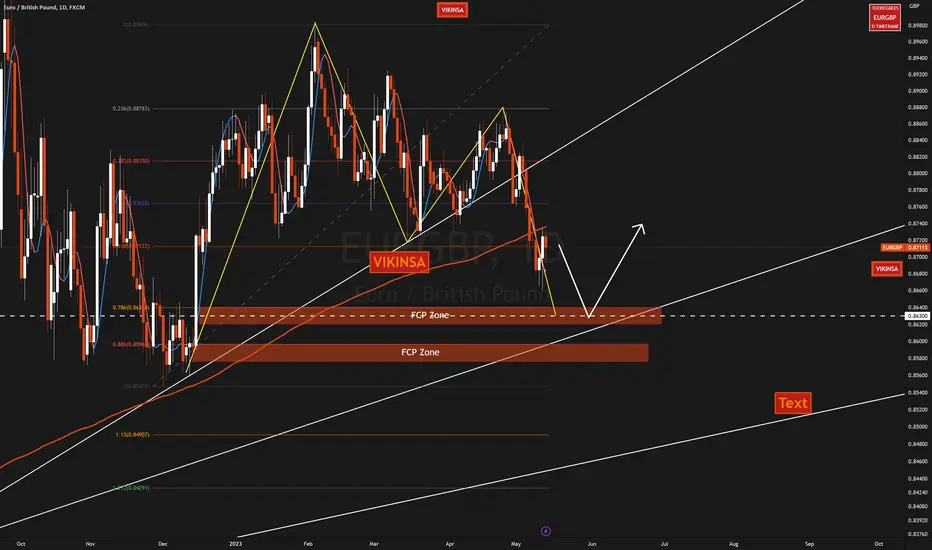
$EURGBP Can Fall Down Further Before Rising Up #EURGBPTraders, EURGBP last week showed a rejection from the 200 sma. It fell a bit from there. We have a potential M pattern forming on the daily time frame. So it can continue to fall until it reaches one of the FCP zones where it can bounce upward again.
Please support this analysis by liking and sharing. 👍🙂
Rules:
1. Never trade too much
2. Never trade without a confirmation
3. Never rely on signals, do your own analysis and research too
✅ If you found this idea useful, hit the like button, subscribe and share it in other trading forums.
✅ Follow me for future ideas, trade setups, and updates on this analysis
✅ Don't hesitate to share your ideas, comments, opinions, and questions.
Take care and trade well
-Vik
____________________________________________________
📌 DISCLAIMER
The content of this analysis is subject to change at any time without notice and is provided for the sole purpose of education only.
Not financial advice or signal. Please make your own independent investment decisions.
____________________________________________________
Potential reversal Outlook on GBPUSD:
last week we managed to catch the drop of the pair two times exceeding 150 points.
looking at the pair we se that it has not managed to break above the resistance line. Now we see a reversal pattern rebounding off a key supply zone. Our view is still bearish but we will wait further confirmation before entering any trade.
If price closes below 1.26238 , we will look to enter a short position targeting 1.256. Closing below it could take us to test the demand area between 1.24373 and 1.24489.

✅EUR_GBP MOVE DOWN AHEAD|SHORT🔥
✅EUR_GBP broke the key
Horizontal level of 0.874
Which is now a resistance
Then went down and is now
Retesting it so as we are
Bearish biased after the
Breakout I think that we will
See a move dow to retest
The target level of 0.867
SHORT🔥
✅Like and subscribe to never miss a new idea!✅

✅GBP_JPY LONG FROM SUPPORT CLUSTER🚀
✅GBP_JPY is trading in an
Uptrend abd the pair made
A rebound from the support
Cluster of the horizontal and
Rising support lines at 168.00
So I am locally bullish biased
And I think that we will see
The retest of the target at 170.00
LONG🚀
✅Like and subscribe to never miss a new idea!✅

GJStill breathing with no shame. Good Job. Now we know we were right, we were just too early. So now we wait before re-entering, should have been taken out by your SL

GJI don't have to spell it out. Pullback channel (reversal), in a down trend, impulsive candles down. That's enough for me to enter and rife it but because it's Friday I won't hold for long. Not a fan of holding trades over a weekend.

GBPZAR UPDATE Still on the way to R25.00 to the poundThe charts never lie!
I posted this trade alert in October 2022 with the massive Falling Wedge on the Weekly.
It broke above the R20.35 and it showed the next strong resistance at R25.00.
target will be R25.00.
I called it a long term analysis but changing it to a MEDIUM term analysis because of how quickly it's accelerated.
I guess we can only wait for the target to reach until the next trade alert is given.
Poor Sout Africa and those holding rands (Including myself).

EURGBP: Bearish Wave is Coming 🇪🇺🇬🇧
After the yesterday's pullback, EURGBP reached a wide horizontal zone of supply.
0.873 - 0.8765 is the area from where the next bearish move will most likely initiate.
The next goal for the sellers will be 0.866
Because the underlined area is quite wide, look for an intraday confirmation before you sell.
❤️Please, support my work with like, thank you!❤️

GBP/USD -11/5/2023-• Despite hawkish message delivered by the BOE today, recent USD strength is putting pressure on the pound and all the majors
• We have a couple of Dojis in the recent past sessions which showed a slowing bullish momentum followed by a big bearish candlestick today
• Bears are testing the 20 SMA which has been supporting the prices for a while
• While there is a weakness prevailing, longer term trend is still bullish as long as the Pound is trading above the ascending trend line
• One critical support level is very important for the bulls to defend which is in the mid 1.24s (1.2450-1.2460) which is the previous December 2022 - January 2023 resistance and the trend line support
• Bears will do their best to secure several daily closes below the 20 SMA and the supporting trend line
• From a risk reward perspective, bulls might wait for a re-test of the trend line before getting in the market again
Traders, if you like this idea please comment and like ✅
Here to answer all your questions,
Good luck


GBP-USD Risky Long From The Rising Support! Buy!
Hello,Traders!
GBP-USD make a pullback
From the strong horizontal
Resistance of 1.2677 just
As I predicted but now
The pair is about to
Retest a rising support
And despite my bearish
Bias I think that we will
See a local bullish
Rebound from the support
Buy!
Like, comment and subscribe to help us grow!
Check out other forecasts below too!

EURGBP: Pullback Trade Explained 🇪🇺🇬🇧
EURGBP formed a bullish harmonic abcd pattern on a daily.
Approaching its completion point, the price bounced and broke a resistance line of a falling wedge pattern on 1H time frame.
I expect a pullback to 0.871 / 0.8727
❤️Please, support my work with like, thank you!❤️

GBP is BossBullish Setup
The next HH HL is the sinal of the Bullish Trend start
Here’s the 4hr Elliott wave Chart from the 4/14/2022 New York update. In which, the rally to 1.6866 high ended 5 waves from the 2/10/2023 low in wave (1) & made a pullback in wave (2). The internals of that pullback unfolded as Elliott wave double three correction where wave W ended at 1.6579 low. Then a bounce to 1.6835 high-ended wave X & started the next leg lower in wave Y towards 1.6547-1.6369 blue box area. From there, buyers were expected to appear looking for new highs ideally or for a 3-wave bounce minimum.
GBP Funamentals
The GBP has experienced a notable rally in recent weeks, positioning it as the top-performing currency among the G10 nations this year. The unexpected success story of the GBP, now dubbed the "King of G10 FX," can be attributed to several factors.
Firstly, the rebound can be attributed to a series of positive UK data releases in recent months, which were influenced by the significant decline in European energy prices and subsequent improvements in commodity terms of trade. Additionally, the persistent UK inflation, combined with reduced post-Brexit tensions between the UK and the EU, as well as diminished risks of another independence referendum, have enhanced the attractiveness of GBP-denominated assets.
Asia overnight
The sentiment was mixed during Asian trading as investors grappled with concerns surrounding the US debt ceiling. However, their optimism was boosted by China's better-than-expected exports data.
Fig1: China headline news from 09/05/2023
There were also reports from newswires suggesting that Chinese authorities might announce additional measures to bolster the economy.
Currently, Asian markets were trading with a mixed performance, while S&P500 futures showed a slight decline.
In the G10 foreign exchange market, trading remained within narrow ranges, with the Norwegian krone (NOK) and Euro (EUR) underperforming, while the US dollar (USD) and Japanese yen (JPY) outperformed.
Kazuo Ueda, the Governor of the Bank of Japan (BoJ), stated that the central bank would discontinue its Yield Curve Control (YCC) policy once inflation consistently reaches 2%. However, this statement didn't come as a surprise and maintained investors' view of the new BoJ Governor as dovish. In March, Japan's wage growth continued to be lacklustre, with real wages experiencing a YoY decline of -2.9%. This data is unlikely to prompt any policy changes by the BoJ.
USD: Debt ceiling, regional banks, and the Fed
The short-term outlook for the USD is heavily influenced by the ongoing drama surrounding the US debt ceiling in Congress and the outlook for regional banks in the United States. Market concerns regarding the prospects of regional lenders are unlikely to ease following the recent release of the Senior Loan Officers Survey. Additionally, the political deadlock over the US debt ceiling is expected to continue negatively impacting the USD.
During the day, foreign exchange (FX) investors will closely monitor the high-level meeting between President Joe Biden and US congressional leaders, which aims to resolve the impasse over the debt ceiling. In terms of its impact on the FX market, any signs of progress between Democrats and Republicans towards a potential bipartisan solution, such as a short-term extension of the debt ceiling, could help the USD regain strength across the board. Conversely, indications that the political impasse has worsened may dampen the appeal of USD-denominated assets.

GJI've been quiet in that I haven't posted in a while but I have been monitoring the charts. So now I would like to firstly apologise to myself for not committing and doubting the work needed to be done. Secondly, I would like to apologise to anyone that does follow me and gets any value from what I do.
This is my current vision of what I see and where I believe GJ is going. We are in the correction phase of a channel, so I will wait for a break (Violent one) downwards, a retest, candle confirmation and then enter and ride it the whole way down.
I am challenging myself to post everyday even if it is just comments and not a forecast.

GBPUSDGBPUSD at resistance if can't break can drop to support area's 1.25468 - 1.24428 if can break resistance can rise to next resistance at 1.27002 - 1.29884

GBPUSDGBPUSD at resistance if can't break can drop to support area's 1.25468 - 1.24428
if can break resistance can rise to next resistance at 1.27002 - 1.29884

GBPNZD: Multiple Time Frame Analysis & Trading Plan 🇬🇧🇳🇿
GBPNZD is trading in a bullish trend.
After the price set a new higher high on a daily, it retraced to a rising trend line.
Approaching that, the pair formed an inverted h&s pattern on 1H time frame.
Its neckline was broken then.
I expect a bullish continuation.
Goals: 2.1045 / 2.02
❤️Please, support my work with like, thank you!❤️
