GBP/JPY: Recent Bullish Move Fails to Break the 192.00 Level Since February 11, the British pound has gained more than 2.5% against the Japanese yen. However, the recent bullish momentum has struggled to break through the key resistance level, and now a new correction in favor of the yen appears to be underway.
Central Bank Policies Remain Crucial
The ongoing monetary policy divergence between the Bank of England (BoE) and the Bank of Japan (BoJ) is a crucial factor in this market scenario.
On February 6, the Bank of England decided to keep its interest rate steady at 4.5%. However, it remains unclear whether the BoE will maintain this policy in future decisions.
On the other hand, Japan's monetary stance has become increasingly aggressive. In January 2025, the Bank of Japan raised its interest rate to 0.5% , the highest level since 2008 and the BoJ has signaled a more aggressive tightening approach, aiming to strengthen the yen and make it more competitive against its peers.
In the long run, Japan’s new aggressive policy stance has played a key role in the recent downward movements in GBP/JPY.
Higher returns in a traditionally safe market like Japan attract greater demand for the yen, reducing the appeal of the pound.
As long as Japan maintains this hawkish policy and uncertainty persists regarding the BoE’s future rate outlook, it is likely that yen demand will continue to grow, this could reinforce downward pressure on GBP/JPY.
Consistent Downtrend:
Since July 2024, the GBP/JPY pair has followed a sustained downtrend, which at some points has turned into a sideways movement between the 192.427 resistance level and the 187.328 support level.
The current bearish bias has been strong enough to produce lower highs, keeping the price within a long-term downtrend in the short term.
However, if the price moves back toward the 194.323 zone, where the 100-period and 50-period moving averages converge along with the downtrend line, it could signal a threat to the ongoing bearish trend. If buyers manage to push the price back to this level, it could be a important warning sign.
ADX Indicator:
The ADX line is oscillating near the neutral 20 level, indicating that the last 14 periods lack a strong directional trend.
This can be explained by the recent bullish rebound, which failed to break through resistance.
If the ADX remains at this level, the price may continue in a prolonged sideways trend over the next few trading sessions.
RSI Indicator:
A similar scenario is unfolding in the RSI, where the line is hovering around the neutral 50 level.
This indicates that bullish and bearish impulses from the last 14 periods are in balance.
This could reinforce a lack of clear direction for GBP/JPY in the 190.00 zone in the near term.
Key Levels to Watch:
192.427 – Near-Term Resistance:
This level represents the most significant neutral area in recent months and aligns with the 38.2% Fibonacci retracement level.
If price reaches this level again, it may struggle to break through due to strong resistance at both 192.427 and 194.323, where several technical indicators converge.
That said, a breakout above this entire zone could trigger a major bullish move in the long term.
187.328 – Key Support:
This level marks the lows recorded since July 2024.
A bearish breakout below this level could lead to new lows in the short term and reinforce the bearish bias established since December.
198.525 – Long-Term Resistance:
This distant resistance level aligns with the 61.8% Fibonacci retracement.
If price eventually rallies to this level, it would completely invalidate the ongoing downtrend in GBP/JPY.
By Julian Pineda, CFA – Market Analyst
Pound

GBP/USD: Bank of England's Cautious Tone Sparks DeclineThe British pound has retreated from its recent gains, succumbing to downward pressure as Bank of England (BoE) Governor Andrew Bailey voiced his apprehensions regarding the economic outlook. This cautious stance from the BoE's leadership has cast a shadow over the currency, prompting investors to reassess their positions.
From a technical analysis perspective, the GBP/USD pair is currently navigating a critical zone, characterized by a supply area that has historically acted as a barrier to upward movement. Notably, the latest Commitments of Traders (COT) report reveals that retail traders are predominantly positioned on the bullish side of the market, suggesting a potential mismatch between market sentiment and the underlying fundamentals.
Furthermore, seasonal patterns indicate that the pound may be on the cusp of a bearish momentum shift. This confluence of technical and seasonal factors has created a high-probability setup for a potential reversal, with the price action poised to challenge the recent uptrend.
In light of these developments, we are actively seeking a short setup, anticipating that the pound's decline may gain momentum in the near term. The alignment of technical, fundamental, and seasonal forces suggests that the GBP/USD pair may be vulnerable to a corrective move, presenting an opportunity for traders to capitalize on the potential downturn. As the market continues to evolve, careful monitoring of the price action and trading sentiment will be crucial in determining the optimal entry and exit points for this potential short trade.
✅ Please share your thoughts about GBP/USD in the comments section below and HIT LIKE if you appreciate my analysis. Don't forget to FOLLOW ME; you will help us a lot with this small contribution.

GBP/USD Rises on Strong UK GDPGBP/USD climbed to 1.2595 in early Asian trading on Sunday, driven by strong UK GDP data and weaker US retail sales. January retail sales dropped 0.9%, the steepest decline in nearly two years, after a revised 0.7% rise in December, far below the expected 0.1% dip. However, year-over-year sales grew by 4.2%. Meanwhile, the UK economy expanded by 0.1% in Q4 2024, beating forecasts and strengthening the Pound.
Key resistance is at 1.2600, with further levels at 1.2650 and 1.2700. Support stands at 1.2340, followed by 1.2265 and 1.2100.

SHORT ON GBP/USDGreat setup on GU
Price is falling from a major supply zone.
I will be selling GU to the next level of Demand.

GBP.USD Longs from 1.25600 back upI expect GBP/USD to continue its bullish momentum and push higher. Following the previous break of structure, I am looking for price to mitigate the 2-hour demand zone to maintain this upward trend. If price does not react from this level, I have also identified a 3-hour demand zone as a secondary point of interest.
If price reacts bullishly from either of these zones, my next selling opportunity will be at the refined 1-hour supply zone around 1.26600. Once price reaches this level, I will look for signs of distribution to confirm a potential short setup.
Confluences for GU Buys:
- For price to continue higher, it must mitigate a strong demand zone to gain momentum.
- Liquidity remains above, providing a natural target for price.
- The higher time frame trend is still bullish.
- Clean 2-hour, 3-hour, and 11-hour demand zones are in close proximity.
- DXY has been bearish, which aligns with this bullish GU outlook.
P.S. If price drops instead, I have an extreme discounted zone marked at the 11-hour demand zone at the bottom as a potential long entry.

SHORT ON GBP/CHFNice Market structure change from up to down on GBP/CHF
I am selling to the next level of support.

GBP/USD Up on Positive Growth DataThe British pound climbed to $1.2560 after preliminary data showed the UK economy grew by 0.1% in the final quarter of 2024, defying expectations of a 0.1% contraction and outperforming the Bank of England’s forecasts. This puts the economy slightly ahead of where it was when Labour took office in July, offering some relief to the government.
However, challenges remain as the Office for Budget Responsibility is set to release an updated economic and fiscal outlook on March 26, with reports indicating a lowered growth forecast. Meanwhile, the Bank of England cut interest rates by 25bps to 4.5% last week, its third reduction since beginning its easing cycle in August 2024, while also downgrading its 2025 GDP growth forecast to 0.7%.
1.2600 is the first resistance level, with further targets at 1.2650 and 1.2700 if the pair moves higher. On the downside, 1.2340 serves as the first support level, followed by 1.2265 and 1.2100 if selling pressure intensifies.

GBP/USD Supported by Peace Deal HopesThe GBP/USD traded at $1.246, holding steady with global market optimism. The pound found support from peace deal hopes between Ukraine and Russia but struggled against a stronger U.S. dollar, supported by rising Treasury yields and recent inflation data. The Federal Reserve’s cautious approach to rate cuts has kept the dollar firm, while UK economic concerns, including a potential GDP contraction, weigh on the pound. With upcoming U.S. PPI data, GBP/USD could face further pressure.
The first resistance level for the pair will be 1.2500. In the event of this level's breach, the next levels to watch would be 1.2600 and 1.2650. On the downside 1.2340 will be the first support level. 1.2265 and 1.2100 are the next levels to monitor if the first support level is breached.

GBP/USD Rises as Traders Scale Back Aggressive BoE Easing BetsThe British pound rose to $1.2440, rebounding from a three-week low as traders adjusted rate cut expectations after BoE policymaker Catherine Mann’s comments. Although she voted for a 50bps cut, she clarified it wasn’t a signal for aggressive easing but aimed to improve market communication. She emphasized the need to maintain monetary restrictions due to structural challenges in returning inflation to 2%, leading traders to lower 2025 rate cut expectations to 62bps. Focus now shifts to upcoming GDP estimates, Q4 figures, and December’s industrial and manufacturing output.
The first resistance level for the pair will be 1.2500. In the event of this level's breach, the next levels to watch would be 1.2600 and 1.2650. On the downside 1.2340 will be the first support level. 1.2265 and 1.2100 are the next levels to monitor if the first support level is breached.

LONG ON GBP/JPYNice Double Bottom at a Key Demand Level
Jpy index is also Falling from a major resistance area.
I am taking GJ long

Pound Hits Three-Week High as Markets Await BoE CutThe British pound rose above $1.25, its highest since January 7, as the US dollar weakened and the focus shifted to the Bank of England’s Thursday decision. Policymakers are expected to cut rates by 25bps to 4.5%, reflecting slowing growth and easing services inflation. Market sentiment remained cautious over US tariffs, with concerns about a US-China trade conflict impacting global stability. Meanwhile, UK input price inflation hit an 18-month high in January, according to the latest PMI report.
The first resistance level for the pair will be 1.2500. In the event of this level's breach, the next levels to watch would be 1.2600 and 1.2650. On the downside 1.2340 will be the first support level. 1.2265 and 1.2100 are the next levels to monitor if the first support level is breached.

GBP/USD Stuck Between Fed Policy and BoE DecisionThe USD Index (DXY) remains near its weekly low as expectations grow for further Fed monetary easing. Tuesday’s JOLTS report signaled a cooling US labor market, increasing speculation of rate cuts despite inflation concerns.
Global sentiment is positive after President Trump delayed tariffs on Canadian and Mexican imports, easing trade war fears. This risk-on mood weakens the USD’s safe-haven appeal while supporting GBP/USD. However, lingering US-China trade tensions and the Fed’s hawkish stance limit USD losses, keeping GBP/USD gains in check.
Traders await Thursday’s BoE policy meeting with key resistance levels at 1.2500, 1.2600, and 1.2650. Support stands at 1.2340, followed by 1.2265 and 1.2100.

GBP/USD Analysis by zForex Research TeamGBP/USD Recovers as Trump Pauses Tariffs, But Risks Persist
The British pound rebounded above $1.24 after falling to $1.225, following Trump’s deal with Mexico’s President Sheinbaum to pause tariffs for a month. Uncertainty remains as Trump imposed 25% tariffs on Canada and Mexico, 10% on China, and threatened the EU and UK. Growing trade tensions have fueled expectations of Bank of England rate cuts, with markets pricing in 81bps of cuts by December and a 95% chance of a 25bps cut to 4.5% this Thursday.
The first resistance level for the pair will be 1.2450. In the event of this level's breach, the next levels to watch would be 1.2500 and 1.2600. On the downside 1.2265 will be the first support level. 1.2100 and 1.1900 are the next levels to monitor if the first support level is breached.

GBPJPYThe GBP/JPY chart shows a descending trendline broken near a support zone, indicating a potential bullish reversal. The green circle highlights the breakout, with price targeting the blue shaded area above.

Recession concerns have provoked the BoE’s will to cut rates
Concerns about a UK recession are intensifying, making a BoE rate cut next month likely. The recent December retail sales data from the ONS reveals a decrease of 0.3% compared to the previous month, a stark contrast to the market's expectation of a 0.4% increase. This clearly indicates that consumer apprehension regarding the economic downturn is escalating rapidly. The market firmly anticipates that the BoE will reduce interest rates by an additional 25bp during the monetary policy meeting on February 6. Furthermore, many analysts assert that, given the current state of the UK economy, the BoE is poised to execute four interest rate cuts this year.
After breaking out of the ascending channel, GBPUSD trades sideways around 1.2450. However, the price holds above EMA21, indicating a potential for an extension of bullish momentum. If GBPUSD reenters the channel, the price could gain upward momentum toward the 1.2500 threshold. Conversely, if GBPUSD fails to hold above EMA21, the price could fall further to the support at 1.2350, where EMA78 coincides.

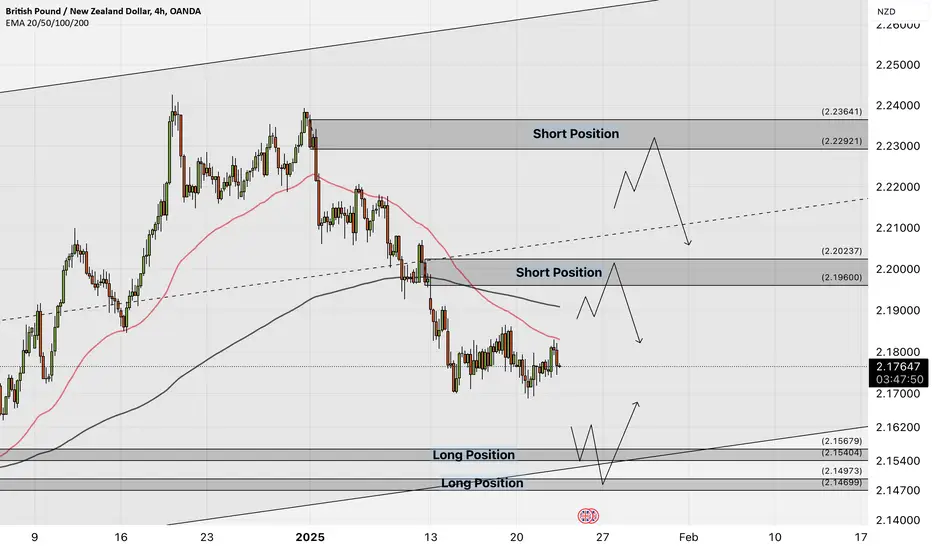
GBPNZD SHORTSGBPNZD have been on a down trend and will continue doing so for a while. I expect a contact with the trend line that will initiate the fall to 2.16912 and then 2.14900.

GBPNZD - The pound, at peace?!The GBPNZD currency pair is below the EMA200 and EMA50 in the 4-hour timeframe and is trading in its ascending channel. If the downward trend continues, we can see the demand zone and buy this currency pair in that zone with the appropriate risk reward. The upward correction of this currency pair will provide us with the opportunity to sell it again.
According to Bloomberg, in response to rising borrowing costs, the UK bond market has requested that the government reduce the issuance of long-term bonds next year. During annual consultation meetings held on Monday, traders strongly advocated for a reduction in the maturity of bonds issued for the fiscal year 2025-2026 compared to current levels.
The majority of investors favor increasing the issuance of short-term bonds due to declining demand for long-term bonds from pension funds. The Debt Management Office mentioned in its meeting minutes that the market requires greater flexibility due to “uncertainty.”
The recent rise in UK bond yields has posed new challenges for the government, and these proposals could help the government adapt to the shifts in demand.
As reported by the Financial Times, UK Treasury Minister Rachel Reeves has expressed support for regulatory plans aimed at reducing restrictions on mortgage lending.These plans, which are being reviewed by the Financial Conduct Authority (FCA), aim to allow banks to take on more risk with mortgage loans, enabling more people to become homeowners.
In an interview with the Financial Times, Reeves stated her willingness to consider the FCA’s proposals for easing mortgage restrictions. She said, “I am fully prepared to explore ideas that can help working families achieve homeownership.”
This week, Reeves traveled to Davos to participate in the World Economic Forum and promote the UK as a prime destination for investment. This effort is part of the Labour government’s strategy to stimulate economic growth, as the UK experienced a recession in the second half of last year.
Given the stringent fiscal rules Reeves has imposed on herself and the decline in business confidence following her decision to raise employer national insurance contributions in the October budget, the Treasury Minister has faced significant political pressure since the start of the year. The Treasury is at the forefront of the government’s efforts to push regulators to introduce growth-enhancing measures. Last week, Reeves met with several UK regulatory officials to gather their ideas on this matter.
Data from the Office for National Statistics (ONS) revealed that the number of job vacancies in the UK decreased to 812,000 in the quarter ending December. Additionally, the economic inactivity rate dropped to 21.6% in the three months ending November.
Traders have increased their bets on an interest rate cut by the Bank of England, expecting a reduction of 64 basis points this year.
Moreover, December data indicates that the UK’s public sector net debt (excluding banking groups) rose to £17.8 billion, up from the previous figure of £11.2 billion. Public sector tax receipts increased to £19.9 billion, a notable rise compared to the previous £13.0 billion. Similarly, central government net debt climbed to £19.9 billion, up from £16.3 billion previously.
Meanwhile, in the latest Global Dairy Trade (GDT) auction in New Zealand, the GDT price index increased by 1.4%, while whole milk powder prices rose by 5%.
Fundamental Market Analysis for January 22, 2025 GBPUSDThe Pound saw mixed results from UK labour data, but the UK's own Labour Department is taking the figures as a grain of salt. On the US side, US President Donald Trump brushed aside his campaign promises of sweeping tariffs against all US trading partners, focusing on new, more subtle tariff threats against US North American trading partners Canada and Mexico.
Markets shuddered as investors tried to keep up with the new headline generator - President Trump. Investors were betting big that the newly minted US president would not impose tariffs on day one, as he has long threatened to do, but a new round of renewed trade rhetoric has market sentiment fluctuating in the mid-range.
With only little significant data scheduled for Wednesday, pairs traders will focus on the headlines likely to be released during US trading hours. Pound traders will be keeping an eye on Friday's Purchasing Managers' Index (PMI) data from S&P Global, which is due out on both sides of the Atlantic.
Trading recommendation: Watch the level of 1.2280, when fixing below consider Sell positions, when rebounding consider Buy positions.

Trump Bullish for USD! Farage Next for GBP?!With the way the media is promoting Nigel Farage more day by day & getting his face out there, I’m starting to think his been ‘selected’ as the next U.K. Prime Minister. They’re drip feeding the idea into the publics head.
Also, with the way the media is releasing more & more race hate content & dividing people, it’ll be ‘completely normal’ when a far right politician into power, as no one will question it or even think to say he had no support behind him. With all the race hate & division content being promoted by the media, we’ll see a lot more aggro against coloured people & immigrants. This’ll be the main factor used to make the public believe Nigel Farage was put into power by the public.
This is just my theory. Let’s see how it pans out!

GBPUSDHello Traders! 👋
What are your thoughts on GBPUSD?
This currency pair has found support upon reaching the bottom of the channel and a key support zone. A bullish move is anticipated from this level, with the price expected to rise at least to the top of the channel and the specified resistance area.
Don’t forget to like and share your thoughts in the comments! ❤️

LONG ON GBP/JPYGJ Has giving us a beautiful setup with a falling channel at a major demand zone.
Nice breakout and retest. Its time for it to fly.
The jpy index is also at a major resistance zone and looks like it will fall.
All the xxx/jpy pairs will rise this week coming.
Take advantage!

Pound Down Under: Will the FVG Hold or Flip? - GBPAUDThe GBPAUD chart showcases intriguing price action with a potential bearish setup. Following the raid on higher time frame (HTF) buyside liquidity (weekly), price has displaced lower, signaling a short-term bearish bias.
On the daily timeframe, price has formed a high-probability FVG after raiding a short-term low. This FVG becomes a key level to watch:
-Scenario 1: If price respects the FVG, expect continuation to the downside, targeting sell-side liquidity levels at 1.98994 and 1.97929.
-Scenario 2: If the FVG is disrespected and used as an Inverse Fair Value Gap (IFVG), anticipate a bullish reversal, potentially pushing price higher.
Conclusion:
Short-term bearish bias targeting sell-side liquidity zones.
Monitor the FVG closely for confirmation or invalidation.
DYOR!

GBP/JPY H4 | Potential bearish breakoutGBP/JPY is falling towards a potential breakout level and it could drop lower from here.
Sell entry is at 190.19 which is a potential breakout level.
Stop loss is at 191.97 which is a level that sits above an overlap resistance, the 61.8% Fibonacci retracement and beyond a descending trendline.
Take profit is at 188.46 which is a multi-swing-low support that aligns close to the 161.8% Fibonacci extension.
High Risk Investment Warning
Trading Forex/CFDs on margin carries a high level of risk and may not be suitable for all investors. Leverage can work against you.
Stratos Markets Limited (www.fxcm.com):
CFDs are complex instruments and come with a high risk of losing money rapidly due to leverage. 64% of retail investor accounts lose money when trading CFDs with this provider. You should consider whether you understand how CFDs work and whether you can afford to take the high risk of losing your money.
Stratos Europe Ltd (www.fxcm.com):
CFDs are complex instruments and come with a high risk of losing money rapidly due to leverage. 66% of retail investor accounts lose money when trading CFDs with this provider. You should consider whether you understand how CFDs work and whether you can afford to take the high risk of losing your money.
Stratos Trading Pty. Limited (www.fxcm.com):
Trading FX/CFDs carries significant risks. FXCM AU (AFSL 309763), please read the Financial Services Guide, Product Disclosure Statement, Target Market Determination and Terms of Business at www.fxcm.com
Stratos Global LLC (www.fxcm.com):
Losses can exceed deposits.
Please be advised that the information presented on TradingView is provided to FXCM (‘Company’, ‘we’) by a third-party provider (‘TFA Global Pte Ltd’). Please be reminded that you are solely responsible for the trading decisions on your account. There is a very high degree of risk involved in trading. Any information and/or content is intended entirely for research, educational and informational purposes only and does not constitute investment or consultation advice or investment strategy. The information is not tailored to the investment needs of any specific person and therefore does not involve a consideration of any of the investment objectives, financial situation or needs of any viewer that may receive it. Kindly also note that past performance is not a reliable indicator of future results. Actual results may differ materially from those anticipated in forward-looking or past performance statements. We assume no liability as to the accuracy or completeness of any of the information and/or content provided herein and the Company cannot be held responsible for any omission, mistake nor for any loss or damage including without limitation to any loss of profit which may arise from reliance on any information supplied by TFA Global Pte Ltd.
The speaker(s) is neither an employee, agent nor representative of FXCM and is therefore acting independently. The opinions given are their own, constitute general market commentary, and do not constitute the opinion or advice of FXCM or any form of personal or investment advice. FXCM neither endorses nor guarantees offerings of third-party speakers, nor is FXCM responsible for the content, veracity or opinions of third-party speakers, presenters or participants.
