Pound Sterling Near SupportAlthough the pound is still in a downtrend, this past Friday we starting to see some buying pressure as it gets near the support level. We should see whether the momentum continues higher next week, or if it continues lower to 1.29 level.
Pounddollar
gbpusd - shortmain reason why i took this trade, reasoning was after looking at yields, bonds, and also what happned at the Merc in the USA on monday. and the fact that later on today there is a CPI report coming out, took a position for a short


gbpusd - buy signals and reasonsthe markets been shook by political news, the instatutional traders would have been taking longs into the retail traders reactions to the UK's May's media output last night

Potential 100 pip trades aheadPound has been moving strong but without any real long-term direction. We are approaching another key lever which is around 1.3175, it is also a 61.8 fib retracement level from previous bull run and the one before, seems like everything is lining up for a bullish run through the resistance we have touched yesterday. But also if we go below this level, we could see bears taking over and smashing the support 1.3050,... Ok, let's take it easy 1.3050 support is holding very strong with weekly confluences as well but if the 1.3150-1.3175 level wont hold we can expect at least a touch of 1.3050. Just wanted to give you guys a quick recap of what is happening, we don't have a trade yet, price action will determine nice entries but first, as said before lets see what price does around 1.3175.

GBP/USDSo basically, the way I have it drawn up as it did a 5 wave from the top, wave 5 being in the form of an ending diagonal. So, at this point, I would watch that 200 on 4hr to possibly give a buy setup in the form of flag. I circled where buy should have been from. I don't really feel like we can predict exact structure considering where we are at, but I drew up what I see as potential pattern. I consider it to be a buy setup and would think it would test that zone at least with a possibility of making some kind of flat pattern. Safest thing... Watch the 200 on 4hr, see if you get a smaller correction there. It can just break out, but watch out for a larger W-X-Y pattern to form. (That's the flat scenario I am showing). It's bout strategy.

GBP/USD forecast based on head and shoulders in 1DBest entry - wait for break up and retest of trend line. Once rejected, go long


GBPUSD short triggered based on Politics, Fibs, ResistanceGU short in play.
Several Brexit ministers just resigned.
PM May's future is in serious trouble, per many in the know.
Brexit Blues just might make a come back here soon.
So this a scalp to start, looking for the 4.25 extension of initial move down from the news.
The 4.25 extension also aligns with previously established Fib Zone (grey).
So my first TP will be just short of the zone and the 4.25.
Depending on how things progress (assuming towards TP) I might let some ride for a longer downturn if Political uncertainly in UK remains or increases.

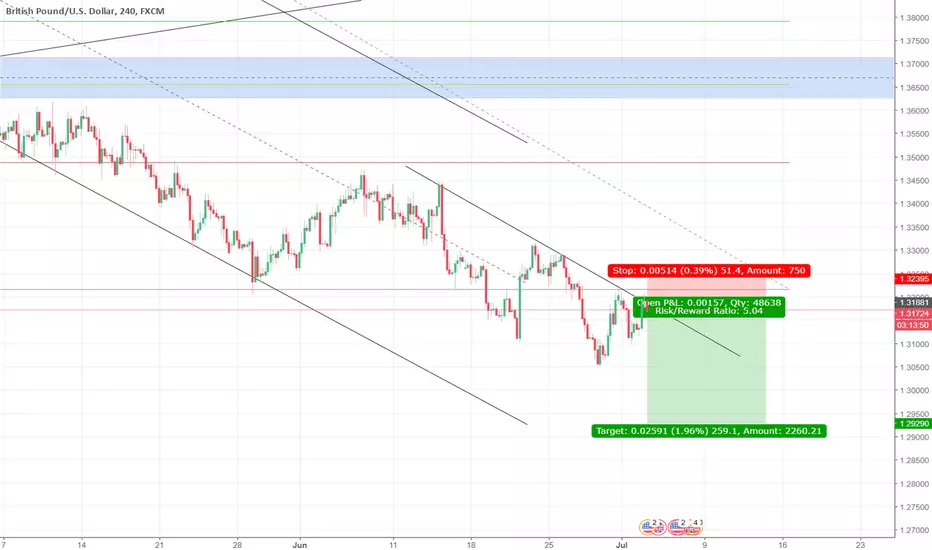
GBPUSD H4With similarities to Aussie on the weekly time-frame we saw price form a bullish retracement to retest the downtrend at the back-end of last week. This was off the back of positive fundamentals and price seems to have formed it's lower high, rejecting the trend which is also in line with the refined Fibonacci region. Price has already broken the simple moving average and is testing the exponential moving average as support. Given the overall trend we remain bearish on this pair but we'd require a break back through this area of dynamic support before confirming our next leg to the downside targets at 1.3100, 1.3075 and 1.300. Should price hold at this level we'd require a break of the downward trend and moving average crossover to confirm bullish advancements. There are multiple resistance barriers for price to break through in confluence here so while possible I can't see the upside as a likely scenario.

Falling Wedge - Long setupGBPUSD has just finished its last wave in the falling wedge. Buy the breakout.
Cheers!

gbpusd shortwon off this similiar trade two weeks ago. 4 touched of a major resistance with rejectiong, and im expecting trend to continue with bearish momentum

GBPUSD - DAILY - SHORTS IN PLAYGbpusd - daily chart - Short setup - I see further downside for this pair due to past weeks candle closure.. I am selling this pair down to 1.2960 where i see a good buying opportunity.

Horizontal line near 1.32000 works?It seems that it responded to a horizontal line near 1.32000(In my chart,1.32108). The movement is similar to eurusd, but will it respond cleanly?
1) The horizontal line functions as a resistance
I choose short aim to before.MPP 1.30760
2) The horizontal line does not function as a resistance
I want to consider the long if it goes above the horizontal line and functions as a support, but since it is a phase where the trend seems to be going down, let's observe carefully.
------------------------- --------------------------
Brown thick line: Yearly Pivot Points (YPP in the text)
Light blue thick line: Monthly Pivot Points (MPP in the text)
Green thin line: Weekly Pivot Points (WePP in the text)
Indigo thickLine: Horizontal line or Trend line seen by weekly or monthly
Indigo thin line: Horizontal line or Trend line seen by 4hourly or daily
Indigo dotted line: outstanding double zero
Red curve: EMA 20 close
Indigo curve: EMA 200 close
Green curve: EMA 800 close
Black curve: EMA 1600 close
x mark: Line which may not function
------------------------- --------------------------

bearish GBPUSD falls to bottom of channelGBPUSD is currently on a weak trendline and could go either way, but i believe with the dollar's recent strength to close out the week the pound is going to continue to drop. Look for a bullish engulfing candle to confirm short and then sell this pair, FOR SUREEEEEE

GBP / USD - Sell traps for Cable - SHORT Over the next few day's we have various reports coming out for this pair, and we have the Brexit negotiations going on which, will almost certainly have a negative impact on Sterling. Interestingly, both economies are performing well when viewed through the prism of reporting metrics but compared with the US$, Sterling is still going to be the underdog, but while the DXY is moving sideways gathering strength to break 94, the Pound may pull ahead for a short while, falling into our sell traps, unless of course Tues 5th US PMI's come up strong, in which case we could be going straight to the Profit zone.
We're currently rising on the weekly trend line and we have two sell traps above to be a Bear on this pair. The first and I think primary sell zone is just above 1.35 and below the 200 days EMA and a previous Point of Control, there will be a great deal of resistance at this zone unless various metrics are sufficient to blast straight through to sell zone number two, between 1.36 - 1.37.

GBPUSD formation and target price on daily chart - SHORTFormation done and broken down.
The price can be expected to decrease by the size of the bar.
Price is at the support line (blue line) now. It can come down again with a small exit.
***This information is not a recommendation to buy or sell. It is to be used for educational purposes only.***
PS make sure you give me a like, If you like this analysis ....

GBPUSD "neighbour dog"Here is something interesting on charts!
The pair is leaving uptrend channel so my fast prediction is SELL after breakdown.
Check also my another D'range trading ideas and plans.
for additional question >> PM

GBPUSD - DAILY - LONGS IN PLAYGbpusd - Daily - expecting a relief rally to 1.3750 and possibly 1.3950 before going short again if 1.3950 resistance holds

GBPUSD was strongly Bearish the past few weeksThe Pound GBPUSD was strongly Bearish these past few weeks, now could be time for a rally/pull back to let some of us join in the downhill. Buying now at the breakout could work but for a short period until the second resistance converging with the 38,2 percent Fib level, whereby we would be looking to sell again...
Weekly analysis. GBPUSD
Happy trading and good luck for the week.

GBPUSD - Is It Ready For A New Rally?!Good evening Traders,
Now, after all the FOMC jazz, let’s have a look at the sterling-dollar.
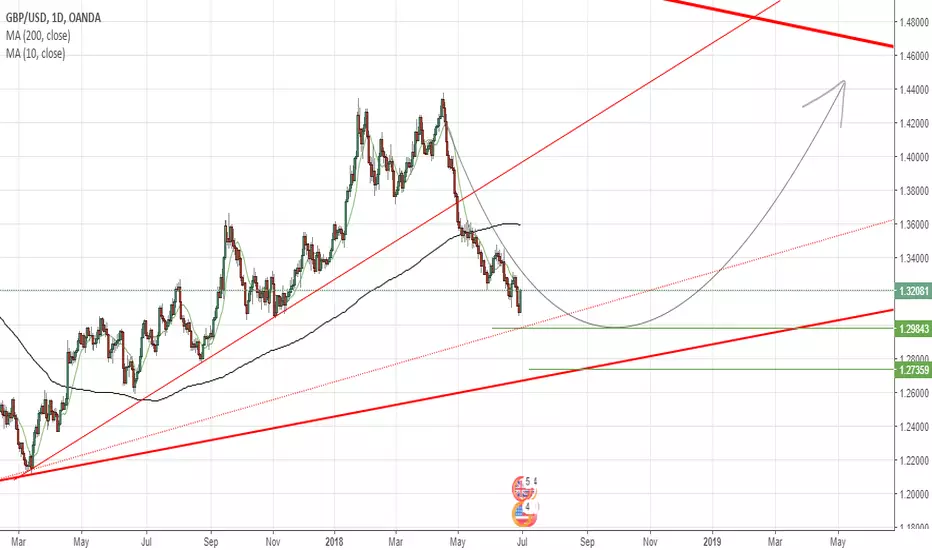
GBPUSD is in an intact uptrend from the 2017 lows making higher highs and higher lows. Which is an indication of a bullish trend. However, don’t get fooled. In the weekly chart, the GBPUSD is bearish and every up move you can see in the daily is just a correction.
Now, I identified for you 2 very important things.
Let's start with the first observation.
1.) First of all the GBPUSD was testing the resistance now acting as new support at around 1.35941. VERY IMPORTANT!! We had a daily close below it which makes it now a little bit complicated because the down move can be a part of a bigger correction lower where the recent move lower was just the first leg followed by a correction higher and another similar leg lower. Obviously, that is a little bit far away to forecast but yes it is a possibility.
2.) The second very important observation is the 200 day moving average. The last time the GBPUSD tested the 200 moving day average was at 2017-06-21. You can see that on that date the GBPUSD retested in a pullback the 200 day moving average bevor a massive rally occurred which took us about 91 days. First of all, I need to mention to you that I am not expecting a similar rally like we had a year ago. However, I am expecting a pullback to the upside in the GBPUSD but it can also be a part of a new rally, which can take us time wise about 91 days if the history repeats itself. I will watch the weekly close this week to evaluate the situation.
With NFPs coming on Friday, it could be a catalyst for the dollar to get weak again. Let’s see.
I hope you enjoyed this view.
Disclaimer: Trading is about going with the highest probability, nobody is 100% right and we need to protect ourself in case we are wrong. That is why we need to always use a stop-loss when trading. Trade with care. This my current view, and any view presented is not any trading recommendation, just personal view.

GBP/USDThat is my positioning on GU. It didn't quite hit the 1.618 extension so I would allow it to break the low to that level. My stop under the quarters hesitation zone. We will either get a flag probably 23-38% for another sell, or, being GU, it could just keep chopping up to 62-78% collecting buys and taking them out. I will TP 1 at 23% andjust let the rest ride and be looking for the next sell.
