Power
Power Trading Idea #Power Is on strong support right now. Possibly #Power will stay here for next #LegUp. 0.000050 sat can be a safe buying but If you would like to wait a bit for better position that will be exceptional.
#Power is a finalist in the 2017 Talent Unleashed Awards judged by Steve Wozniak and Richard Branson this is displaying how #DevGroup are skilled in the back of the assignment.
POWRBTC - watch out for the BREAK OUT!Although its very tough to predict from chart when the data is barely few days older and you dont have much of a history.
However, POWR is presenting an interesting structure with more potential on the upside and limited downside.
POWR has been resting at the same level against BTC for almost 5 days now, thats generally a sign of next big move on either side. Our job is to best guess, which side that would be!
The triangle with a pretty firm support is a good level to buy for aggressive traders (current level is almost the support level). However, conservative traders can wait for the clear breakout candle (with above average volume) above triangle resistance line.
Fib Extensions are the targets in this trade, I expect a lot of mini trades within this structure in days to come.
Treat green line as an ultimate stoploss, below that on closing basis, I see the pair falling towards 2800 level.
Happy trading :)
Power Diving to Support LineTypical movement from this cryto. its reached its ATH and now retracting down to its support at around 3000-4000. possible support at 4800, if power carries on diving down, wait for support to jump back in.
Look to get in around 4000 with profits taken at around 9000.
stop loss at 3600.
Happy trading and please be sure to give me a like if you agree or a add me if you enjoy my Analysis :)
LSK 4hr and POWR 1hr charts for BTFD membersBy Request For BTFD Members
looking at possible formations and speculation on two popular pairs
more examples pointing towards the 27th Nov being a big movement date for many pairs, up i hope!
POWR BTC - POWER show to continue? POWER recently showed a massive bull run on back of some solid product news and feature aspects.
Technically, not enough data to present a conclusive trade, however, on hourly chart we can see 50% Fib being a support along with a possible double bottom, both can push the price upward towards new high.
Can be bought at current levels with target at 0.000118 and 0.000154, SL just below 50% fib level (0.000088)
Happy trading!
Possible breakout from powr againIf you followed my last chart you would have caught the dip at 8820 perfectly
If you are still waiting to buy in wait for the breakout of the blue cloud for a buy signal but it might not breakout so wait
last chart:
Tips are appreciated
ETH:
0x4d5668cA43E1dCAA0D2FBf428b55161262feFBc1
Bitcoin:BTCUSD Buying power grows again - Bitcoin: BTCUSD Last Post
That's another pin bar formed on the 2 hour chart showing
quite aggressive buying lower down...can't deny it's still in
danger whilst trapped under the parallel but price action
shows sellers are being absorbed now at ever higher prices.
It can still fail at any point whist under that parallel but even
from here do not want to get tempted by a short due to the
danger of whipsaw - still evident by that recent pin bar. So
the waiting game continues - but now accepting that this really
could go either way...it's Bitcoin. It really is possible to still
escape...the Head and Shoulders pattern is not complete, and
won't be unless 6910 gives way. Therefore need to be
prepared for break either way, looking at it 50/50 now and
trying to stay prepared for a break either way, as per previous
comment. One last point: for Bitcoin to make another break
to the upside and defy the bears just when it looked like a big
bear raid was building momentum would be a hell of an
escape act and should propel it considerably higher still as a
result - so whichever way this breaks should be worth
following, hopefully without getting stopped out this time
around. Be lucky, especially with stops.
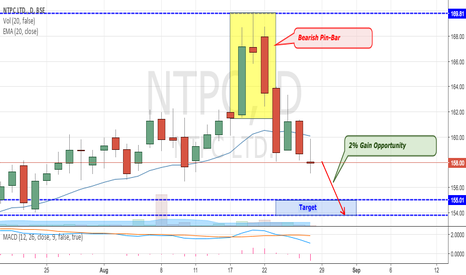
NTPC Confirmed Bearish Pin-Bar CandlesticksThe Pin Bar Candlesticks formation indicates change in trend. If it is found near important resistance level then it signals selling pressure and rejection of prices on high level as indicated the above chart.
Therefore, it is an important formation to measure market sentiments and as per above chart it indicates high selling pressure or profit taking signals short.
SCTY RIDDING ITS RESISTANCE LINENASDAQ:SCTY is running its resistance line at 27.36. While it does seem to be also following its channel. With both trends in mind I would say SCTY may fall tomorrow, but still follow its resistance line until August 1st. It may start to increase slightly and then fall.


