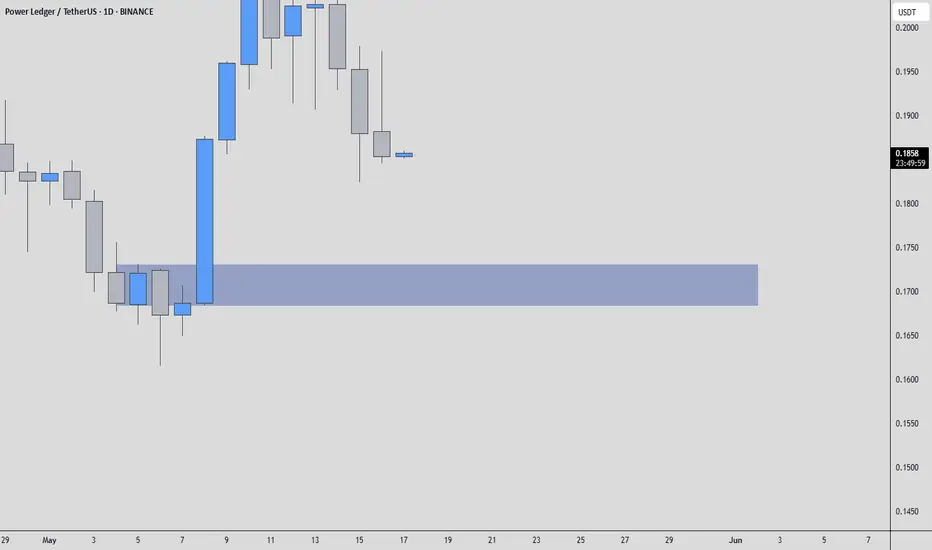
POWR/USDT – One Spot, One SetupPOWR has been grinding sideways, but the real play sits down in that blue box. You know the drill: that’s where liquidity lives, and where smart money often makes its move. There’s no need for extra chatter—just wait for the confirmation trifecta.
First, watch for price to dip into the blue zone. Then look for a volume surge that outperforms the last sell-off, paired with a CDV divergence that signals real buying pressure. Finally, flip over to your low-timeframe chart: a quick break below the box followed by a fast reclaim is your cue. That’s when order flow shifts from sellers to buyers, and you’re in.
“I will not insist on my short idea. If the levels suddenly break upwards and do not give a downward break in the low time frame, I will not evaluate it. If they break upwards with volume and give a retest, I will look long.”
Miss this, and you’ll be left watching from the sidelines. Nail it, and you catch the kind of move most traders only dream about. Keep your eyes on that blue box—when it lights up with those signals, that’s your green light.
📌I keep my charts clean and simple because I believe clarity leads to better decisions.
📌My approach is built on years of experience and a solid track record. I don’t claim to know it all but I’m confident in my ability to spot high-probability setups.
📌If you would like to learn how to use the heatmap, cumulative volume delta and volume footprint techniques that I use below to determine very accurate demand regions, you can send me a private message. I help anyone who wants it completely free of charge.
🔑I have a long list of my proven technique below:
🎯 ZENUSDT.P: Patience & Profitability | %230 Reaction from the Sniper Entry
🐶 DOGEUSDT.P: Next Move
🎨 RENDERUSDT.P: Opportunity of the Month
💎 ETHUSDT.P: Where to Retrace
🟢 BNBUSDT.P: Potential Surge
📊 BTC Dominance: Reaction Zone
🌊 WAVESUSDT.P: Demand Zone Potential
🟣 UNIUSDT.P: Long-Term Trade
🔵 XRPUSDT.P: Entry Zones
🔗 LINKUSDT.P: Follow The River
📈 BTCUSDT.P: Two Key Demand Zones
🟩 POLUSDT: Bullish Momentum
🌟 PENDLEUSDT.P: Where Opportunity Meets Precision
🔥 BTCUSDT.P: Liquidation of Highly Leveraged Longs
🌊 SOLUSDT.P: SOL's Dip - Your Opportunity
🐸 1000PEPEUSDT.P: Prime Bounce Zone Unlocked
🚀 ETHUSDT.P: Set to Explode - Don't Miss This Game Changer
🤖 IQUSDT: Smart Plan
⚡️ PONDUSDT: A Trade Not Taken Is Better Than a Losing One
💼 STMXUSDT: 2 Buying Areas
🐢 TURBOUSDT: Buy Zones and Buyer Presence
🌍 ICPUSDT.P: Massive Upside Potential | Check the Trade Update For Seeing Results
🟠 IDEXUSDT: Spot Buy Area | %26 Profit if You Trade with MSB
📌 USUALUSDT: Buyers Are Active + %70 Profit in Total
🌟 FORTHUSDT: Sniper Entry +%26 Reaction
🐳 QKCUSDT: Sniper Entry +%57 Reaction
📊 BTC.D: Retest of Key Area Highly Likely
📊 XNOUSDT %80 Reaction with a Simple Blue Box!
📊 BELUSDT Amazing %120 Reaction!
📊 Simple Red Box, Extraordinary Results
I stopped adding to the list because it's kinda tiring to add 5-10 charts in every move but you can check my profile and see that it goes on..
Powrbitcoin
#POWR/USDT#POWR
The price is moving in a 1-hour horizontal triangle and we have a green support area at 0.4444
We have a higher stability moving average of 100
Now we have a nice breakout coming up
Our RSI indicator has a well reliable upward trend
Entry price is 0.4690
The first target is 0.5014
The second target is 0.5612

Powerledger (POWR) formed bullish BAT for upto 30.50% pumpHi friends, hope you are well and welcome to the new trade setup of Powerledger (POWR) with US BTC pair.
Previously the priceline of POWR moved slightly down than buying zone, however, recovered soon and pumped more than 35% as below:
Now on a daily time frame, KMD has formed a bullish BAT move for the next pump.
Note: Above idea is for educational purpose only. It is advised to diversify and strictly follow the stop loss, and don't get stuck with trade.

Powerledger (POWR) formed bullish Gartley for upto 37% pumpHi friends, hope you are well and welcome to the new trade setup of Powerledger (POWR) with US Dollar pair.
Previously we caught a very nice pump of POWR as below:
Now on a 4-hr time frame, POWR has formed a bullish Gartley pattern for another price reversal move.
Note: Above idea is for educational purpose only. It is advised to diversify and strictly follow the stop loss, and don't get stuck with trade

Powerledger (POWR) forming bullish Cypher for upto 32% pumpHi friends, hope you are well and welcome to the new trade setup of Powerledger (POWR) with US Dollar pair.
Previously I shared a trade plan for POWR, but stil powr is moving in the potential revesal zone, and dragged too much.
Now on one hour time frame, POWR is about to complete another bullish Cypher pattern.
Note: Above idea is for educational purpose only. It is advised to diversify and strictly follow the stop loss, and don't get stuck with trade

Powerledger (POWR) formed bullish Cypher for upto 98% pumpHi friends, hope you are well and welcome to the new trade setup of Powerledger (POWR) with Bitcoin pair.
Previously we had a nice harmonic trade setup of POWR as below:
On a daily time frame, POWR is very close to complete the final leg of a bullish Cypher pattern.
Note: Above idea is for educational purpose only. It is advised to diversify and strictly follow the stop loss, and don't get stuck with trade.

POWRBTC breakout pennantPOWRBTC Create hidden bullish divergence with pennant breakout!
TPS are, 0.00000738, 0.000000830

POWRBTC create hidden bullish divergence with Double BottomPOWRBTC create hidden bullish divergence with Double Bottom.
TP: 0.00000840

POWRBTC create hidden bullish divergenceNow POWRBTC create hidden bullish divergence!
TP's are 0.00000850, 0.000000908, 0.00001070, 0.00001120, 0.00001190

POWRBTC Gonna Moon!POWRBTC pair gonna breakout CUP with Handle pattern.
Today, partnered with India's largest integrated power company @tatapower_ddl and @IndiaSmartGridF on the first live solar energy trading project in Delhi. This is an important milestone in India’s rapid adoption of renewable energy. Its a massive NEWS!
So, Our 1st TP will #0.00000830, than #0.00000980

POWR in uptrend, Good for buyingPOWR is trading in the uptrend and respecting the support and resistance zone. This is good time to build a small position and hold in POWR.
Buy Zone: 490-500
Target: 550-610-660-720-790-870-970
Stop loss: 448

Power Ledger (POWR) clear breakout Power Ledger (POWR) clear breakout. POWR broke the downtrend line and hold above it well. We see a good rally in POWR in the coming weeks. The coin will give a 20-50% return in the coming weeks.
Buy Range: 605-610 sats
Target: 660-710-770-850-920 sats
Stop Loss: 550 sats

✳️PowerLedger/BTC (4-10) #POWR $POWR #POWRBTCPOWR is really weak now in the big picture. The 700sts is the last support that you won't want to see it broken.
But if you want to trade it, you can buy close to 700sts as possible and wait for a quick pump to 900-950sts zone (high possibility)
And you need to get out quickly if 700sts level broken.
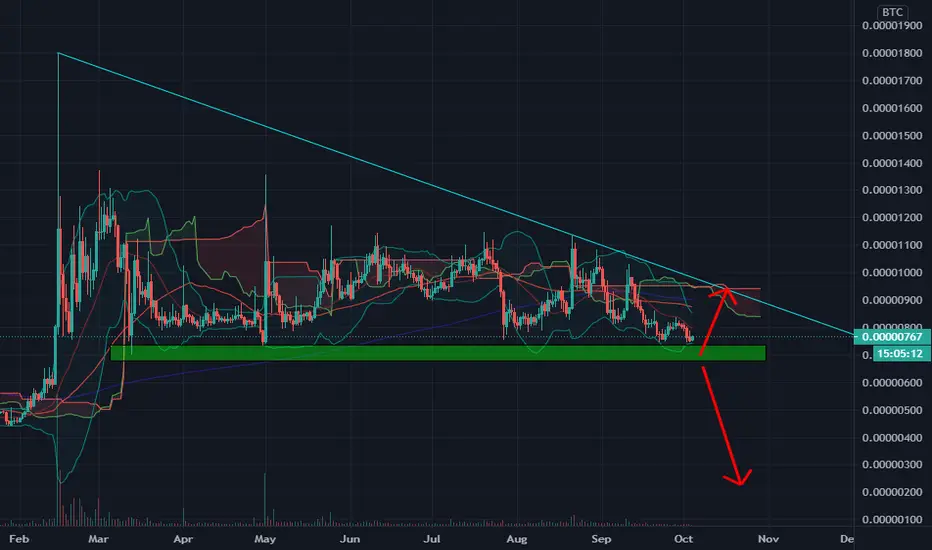
POWR/BTC (Old Support>New Resistance?)💎Technical Analysis Summary💎
BINANCE: POWRBTC
-Power Ledger broke a key level of support around 760s sat
-The price is now pulling back to test previous support
-Will it shifts to a new resistance zone?
-There is a chance but until we see a sign of weakness
-Incase of Bearish direction, the next key level of support is at 600s sat
A big Thanks for donating 💰 via Tradingview coins this week to ahancock 🙏🎉
``````````````````````````````````````````````
Trading Involves High Risk ⚠️
Not Financial Advice 💸
Please Exercise Risk Management 💱
``````````````````````````````````````````````
Thank You All!🙏😊💖For Supporting My Channel 📺
Through Leaving A Thumbs Up, Comment & Follow 💬
Happy Trading!😊💕💖
``````````````````````````````````````````````


ABCD Patternjust your ABCD power ledger trending well right now, nothing has effected it, going strong, get ready for it.

POWRBTC formed bullish Gartley | Upto 114% bullish move expectedHi Friends here I come again with another fruitful trading idea.
This time Power Ledger (POWR) with Bitcoin pair has formed harmonic pattern and that is bullish Gartley pattern.
Let’s dig the pattern deeper to see how perfect the pattern is formed:
After initial leg (X to A) the A to B leg is retraced between 0.618 to 0.786 Fibonacci and then B to C leg is projected between 0.382 to 0.886 of A to B leg's Fibonacci projection and final (C to D) leg is retraced between 0.618 to 0.786 Fibonacci as perfectly required for Gartley pattern and now the price action is moving in potential reversal zone of this Gartley pattern, now we can expect bullish divergence at any time which will lead the priceline between 0.382 to 0.786 Fibonacci projection of A to D leg, but after this bullish divergence if the candles sticks will be closed above the 0.786 Fibonacci levels then it can also lead to the long term bullish move.
Buying And Sell Targets:
The buying and sell targets according to harmonic Shark pattern should be:
Buy between: 0.00000961 to 0.00000733 sats
Sell between: 0.00001141 to 0.00001571 sats
So this time we can expect up to 114% powerful bullish move.
Stop Loss:
The potential reversal zone area which is up to 0.00000733 sats can be used as stop loss in case of complete candle stick closes below this level.

POWRBTC FlatlineFlatline on POWRBTC, this is evident across many alt coins and seem to be mirroring that of POWR for reference, price direction could be literally anywhere, no real good entry points, just an observation.


Power Ledger Scalping!!Buy @ 550-570
Sell @ 600-610
Stoploss @530
Watch out for levels and on Bitcoin movement.

POWR (Power Ledger) Is Ready To Show His Power..!!POWR (Power Ledger)
Looking Bullish & Bottomed Out..
Making Falling Wedge Pattern Daily Timeframe ..
80-100% Profit Expected In Midterm.
#POWR/BTC (Binance)
Buy Around 940-960 Sats
Sell Targets 1316 - 1586 - 1880 - 2224 Sats
Stop Loss Below 900 Sats
Chart Timeframe : Daily
Hit Like On Idea For Support & Follow Me For More Interesting Ideas.
Thanks

Daily Bullish Signal $POWR #POWR POWR/BTC (1 Jan)BLUE ARROW indicates the EXPECTED Time and Targets
Level Stoploss point up to maximize profit and reduce risk
I'm working all the time, even in Bearish Market
