Breaking: Peercoin ($PPC) Coin Might Be Gearing For A ReversalPeercoin ( NASDAQ:PPC ) an altcoin created 2012 has since been mute for over 5 years.
Also known as PPC or Peer-to-Peer Coin, the coin was created by Sunny King and his team and launched in August 2012. It is the first blockchain to implement Proof-of-Stake consensus.
The primary inspiration behind the creation of Peercoin was to address a number of perceived shortcomings of Bitcoin, including energy efficiency, security and sustainability, decentralization and long-term viability.
Essentially it was designed as an enhanced replacement for Bitcoin. As such, it was originally forked from Bitcoin and uses the same UTXO style blockchain. However, Peercoin's code was modified to introduce Proof-of-Stake as its primary consensus protocol.
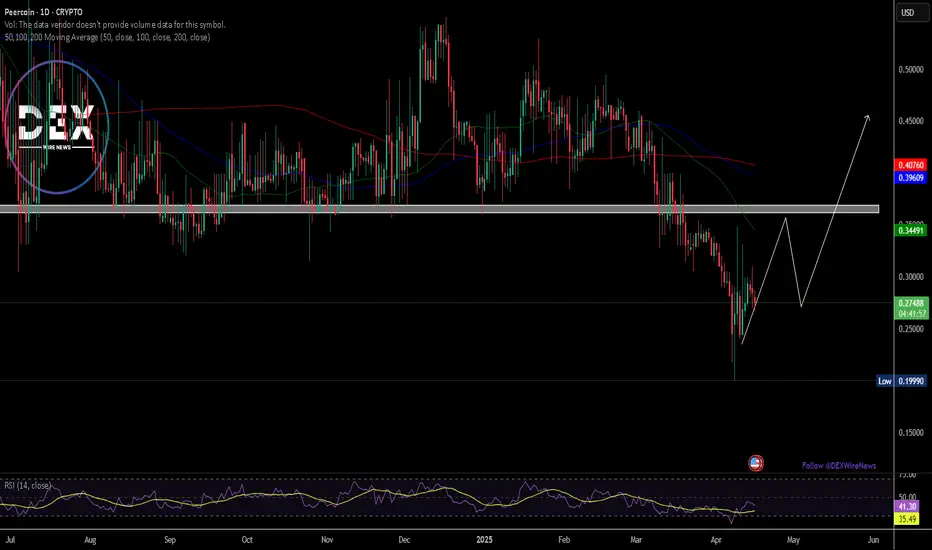
Peercoin's daily price chart depicts a perfectly formed resistant structure, should NASDAQ:PPC break above the $0.36 resistant point, a breakout to the $1 pivot is feasible. Similarly, failure to pull that stunt might negate the assets growth.
Peercoin Price Metric
The Peercoin price today is $0.277113 USD with a 24-hour trading volume of $27,510.89 USD. Peercoin is down 5.39% in the last 24 hours. The current CoinMarketCap ranking is #1053, with a market cap of $8,175,841 USD. It has a circulating supply of 29,503,607 PPC coins and the max. supply is not available.
PPCBTC
Peercoin continues to regain the foothold against BitcoinAs described before, Tether fueled Bitcoin bull runs were not good for PPC-BTC ratio. Bitcoin bear markets is when this usually turns around and Peercoin regains ground. This turn-around could also break the multi-year downtrend in PPC-BTC.
Price is now over weekly EMA(100), it has retested it once and has bounce back up.
Next obvious target is 4500-5000 satoshi along that horizontal resistance. Beyond that, retest of May 2021 high between 8000 and 10000 satoshi.
Network hashrate is exploding as well:
pbs.twimg.com
Anyway, fun times for Peercoin bulls.

Peercoin to resume braking the downtrend against BitcoinI believe next move will re-test the weekly EMA100. Just like the last wick up.
It is interesting it wicks so much, but seeing how low the floating supply is it's not surprising at all. Coin is extremely hard to accumulate at these prices, so I expect price level will be rejected by the market.

Spectacular setup herePPC-USD corrected before BTC-USD did and has established the bottom before BTC-USD. This can be see by rising PPC-BTC over the last couple of months.
This chart looks incredibly bullish, and given the 8:1 R:R ratio I'm inclined to take the offered swing.
Peercoin celebrates 10th anniversary later this month.

Peercoin heading for monthly breakerThis is the BTC/PPC chart which shows some strength, and I'd expect the breaker to be re-tested. Narrative can be: PPC is a POS version of BTC, and this is desirable.


Peercoin Is Now Ready To Grow (Fib. Targets)We looked at Peercoin (PPCBTC) long-term recently, I will share the trade idea below.
Here we have a closer look at the chart with short-term targets based on Fib. proportions.
PPCBTC broke above EMA50 and MA200 and peaked when it hit EMA200 at 0.00003198, soon after prices started to retrace.
Resistance turned support
After EMA50 (magenta line on the chart) was conquered, prices for PPCBTC moved back down and tested this level as support at ~0.00002500.
EMA50 held and prices are now back above this level and also above MA200 (black line).
What this means is that PPCBTC can easily start to move up from here (green arrow).
Conditionsfor change
If momentum is lost and prices move lower, the red arrow comes into play. Right now we are looking bullish, so we aim at the Fib. targets next.
Thanks a lot for reading.
Namaste.
--
Peercoin Awakens | Full Chart W/ Long-Term Targets (12,000%+ PP)

Peercoin Awakens | Full Chart W/ Long-Term Targets (12,000%+ PP)Peercoin (PPCBTC) is starting to wake up after a new all-time low and years of bear action... Let's take a look.
Let's start with the long-term chart, here we have the ATL sitting at 0.00001950:
Over 12,000 potential profits from current prices to our ATH (we are using Nov. 2016 peak prices as all-time high).
Consolidating since July 2019.
The RSI just made a nice jump and is really bullish (we are bullish above 40 on the weekly timeframe).
Prices are trading above EMA10.
When we look at the daily timeframe, we can find more bullish signals... Peercoin (PPCBTC) Daily (D)
MA200 conquered yesterday.
Trading volume starting to increase.
New uptrend forming.
Bullish MACD.
Peercoin is very likely to start growing long-term... Remember to have a plan/strategy in place before buying anything if you decide to trade.
Thanks a lot for reading.
Namaste.

Peercoin Hits Bottom | Up to 8300% PProfits To All-Time HighPeercoin (PPCBTC), one of the first cryptocurrency projects to launch and also a classic, hit a new all-time low on the week of the 15th of July and started to print some bullish signals... Let's take a look:
After hitting a new ATL, PPCBTC printed the "Morning star" pattern. This is a bullish pattern and holds additional strength here as we are looking at the weekly time frame.
Together with this new low and the bullish candlestick pattern, we can see a massive increase in trading volume and a huge 100%+ bounce.
Long-term bullish divergence, since late 2017, can be spotted on the MACD (purple arrow).
The RSI hit massively oversold and its lowest ever.
The profits potential for PPCBTC from the current price (0.00004128) to Novembers '16 peak price, is a massive 8300%+.
Just reaching EMA50 (0.00011630) from the current price, which can be easily achieved, can generate a generous 181% gains.
As you can see, Peercoin has been available for trading on Bittrex since April 2014. Good for long-term hold and to diversify.
Any questions?
Feel free to use the comments section below...
It will be my pleasure to answer any questions.
Namaste.

Peercoin Intraday Timeframe Analysis. Bullish OpportunityConclusion for today's Peercoin (PPCBTC) analysis: A close above ~~0.00011711 implies resumption of bullish momentum in Peercoin.
Peercoin analysis for today is carried out on a 6 hour timeframe chart using a log scale. Historical data going as far back as November 2018 till current date is shown on the chart with the major downward trend. Two major trendlines are plotted on the chart. Bearish trendline from November 2018 closest to price action and the bearish trendline since May 2018.
The latter trendline is close to a major resistance zone in Peercoin that is expected to present a challenge to any bullish swing that develops. Price low achieved on July 16, 2019 was followed by a bullish swing upwards after which Peercoin has traded in a sideways (ranging) environment.
A break above the bearish trendline since November of 2018 increases the chance of the current bullish swing making progress, while a close below ~0.00002646 implies the resumption of the existing bearish trend.
Strategies for going long include buying as soon as price retraces to ~0.00003201 or buying as soon as price breaks above ~0.00005271. Minimum profit target for either scenario is the lower boundary of resistance at ~0.00011711.


A trading opportunity to buy in PPCBTCTechnical analysis:
. PEERCOIN/BITCOIN is in a range bound and the beginning of uptrend is expected.
. The price is above the 21-Day WEMA which acts as a dynamic support.
. The RSI is at 50.
. The price downtrend in the daily chart and the RSI downtrend are broken, so the probability of the resumption of an uptrend is increased.
Trading suggestion:
. Price is in the support zone (0.00013300 to 0.00011550), traders can set orders based on Daily-Trading-Opportunities and expect to reach short-term targets.
Beginning of entry zone (0.00013300)
Ending of entry zone (0.00011550)
Entry signal:
Signal to enter the market occurs when the price comes to " Buy zone " then forms one of the reversal patterns, whether " Bullish Engulfing ", " Hammer " or " Valley " in other words,
NO entry signal when the price comes to the zone BUT after any of the reversal patterns is formed in the zone.
To learn more about " Entry signal " and the special version of our " Price Action " strategy FOLLOW our lessons:
Take Profits:
TP1= @ 0.00017960
TP2= @ 0.00021130
TP3= @ 0.00025085
TP4= @ 0.00029140
TP5= @ 0.00033495
TP6= @ 0.00038600
TP7= @ 0.00047070
TP8= @ 0.00069000
TP9= Free


PeerCoin PPC : A good 3x Profits OpportunityPPC breaks out in a huge move by this 2 days and is testing the first strong resistance at around 25263 sats. After this huge breakout there will be a correction towards point (B) in the chart. Both 50EMA and 89EMA are below the price which are a good indications for an accumulation move. But the accumulation must be done when the correction is done. RSI is at 87 for now and a huge volume poured in by the last 3 days. This signal is for mid to long term investment opportunity.
Accumulation Zone : 17000 sats - 22000 sats
Distribution Zone :
Target 1 : 25263 sats
Target 2 : 33710 sats
Target 3 : 40536 sats
Target 4 : 47362 sats
Target 5 : 57081 sats
Target 6 : 69461 sats
Stop loss : 13500 sats
Good Luck.
Legal disclaimer:
Information on this channel is our team's analyst's "opinion" based on data available at this point in time. These opinions are not recommendations to buy or sell securities/commodities and cryptocurrencies. Trading and investing is a risk and you should not rely on this data to make any financial decisions. You must consult a financial advisory licensed by regulatory agencies in your legal jurisdiction. All information stated here and in our reports don't guarantee any possible profits or losses. Please do consider to do your own due diligence and research when making any kind of a transaction with financial implications.
With Regards. TeamTWA.

There is a possibility for the beginning of an uptrend in PPCBTCTechnical analysis:
. PEERCOIN/BITCOIN is in a range bound and the beginning of uptrend is expected.
. The price is below the 21-Day WEMA which acts as a dynamic resistance.
. The RSI is at 32.
Trading suggestion:
. There is a possibility of temporary retracement to suggested support zone (0.00014140 to 0.00011550). if so, traders can set orders based on Price Action and expect to reach short-term targets.
Beginning of entry zone (0.00014140)
Ending of entry zone (0.00011550)
Entry signal:
Signal to enter the market occurs when the price comes to " Buy zone " then forms one of the reversal patterns, whether " Bullish Engulfing ", " Hammer " or " Valley " in other words,
NO entry signal when the price comes to the zone BUT after any of the reversal patterns is formed in the zone.
To learn more about " Entry signal " and the special version of our " Price Action " strategy FOLLOW our lessons:
Take Profits:
TP1= @ 0.00018880
TP2= @ 0.00021130
TP3= @ 0.00025085
TP4= @ 0.00029140
TP5= @ 0.00033495
TP6= @ 0.00038600
TP7= @ 0.00047070
TP8= @ 0.00069000
TP9= Free

Peercoin (PPCBTC) Doing Nice Numbers (170% PP)
I bought some Peercoin (PPCBTC) yesterday after looking at the price on Wex (right hand chart), I noticed that PPCBTC there was on a strong rally. Shortly after PPC started to move.
On the left hand side, we have the Bittrex chart, here you can see see how strong the move is. About 70% in the last 3 days.
I am sharing this for learning and entertainment. This is no trade advice.
Thanks a lot for your support.
Namaste.

A trading opportunity to buy in PPCBTCTechnical analysis:
. PEERCOIN/BITCOIN is in a range bound and the beginning of uptrend is expected.
. The price is below the 21-Day WEMA which acts as a dynamic resistance.
. The RSI is at 51.
. While the RSI downtrend in the Daily chart is not broken, bearish wave in price would continue .
. The price downtrend in the daily chart is broken, so the probability of the resumption of an uptrend is increased.
Trading suggestion:
. There is a possibility of temporary retracement to suggested support zone (0.00016500 to 0.00013250). if so, traders can set orders based on Price Action and expect to reach short-term targets.
Beginning of entry zone (0.00016500)
Ending of entry zone (0.00013250)
Entry signal:
Signal to enter the market occurs when the price comes to "Buy zone" then forms one of the reversal patterns, whether "Bullish Engulfing" , "Hammer" or "Valley" in other words,
NO entry signal when the price comes to the zone BUT after any of the reversal patterns is formed in the zone.
To learn more about "Entry signal" and the special version of our "Price Action" strategy FOLLOW our lessons:
Take Profits:
TP1= @ 0.00021130
TP2= @ 0.00025085
TP3= @ 0.00029140
TP4= @ 0.00033495
TP5= @ 0.00038600
TP6= @ 0.00047070
TP7= @ 0.00069000
TP8= Free

A trading opportunity to buy in PPCBTCTechnical analysis:
. PEERCOIN/BITCOIN is in a downtrend and the beginning of uptrend is expected.
. The price is below the 21-Day WEMA which acts as a dynamic resistance.
. The RSI is at 41.
. While the price downtrend in the Daily chart is not broken, bearish wave in price would continue .
Trading suggestion:
. There is a possibility of temporary retracement to suggested support zone (0.00013700 to 0.00011547). if so, traders can set orders based on Price Action and expect to reach short-term targets.
Beginning of entry zone (0.00013700)
Ending of entry zone (0.00011547)
Entry signal:
Signal to enter the market occurs when the price comes to "Buy zone" then forms one of the reversal patterns, whether "Bullish Engulfing" , "Hammer" or "Valley" in other words,
NO entry signal when the price comes to the zone BUT after any of the reversal patterns is formed in the zone.
To learn more about "Entry signal" and the special version of our "Price Action" strategy FOLLOW our lessons:
Take Profits:
TP1= @ 0.00018530
TP2= @ 0.00021130
TP3= @ 0.00025085
TP4= @ 0.00029140
TP5= @ 0.00033495
TP6= @ 0.00038600
TP7= @ 0.00047070
TP8= @ 0.00069000
TP9= Free
