XAUUSD 16/07 – Temporary Rebound or Trap Before the Next Drop?XAUUSD 16/07 – Temporary Rebound or Trap Before the Next Drop?
🌍 Macro View – Calm Before the Volatility?
Gold is currently hovering around $3,334/oz after an aggressive sell-off earlier this week. While June's Core CPI data from the US came in lower than expected — easing immediate inflation concerns — the broader macro landscape remains far from stable:
New US tariffs are beginning to ripple through consumer prices.
Sectors like appliances and electronics are seeing early signs of inflation.
Shrinking inventories may lead to direct price pressures on consumers soon.
🔎 As the market digests these signals, gold remains a defensive play — but today's PPI release could flip sentiment quickly.
📉 Technical Outlook – Setup for a Deeper Pullback?
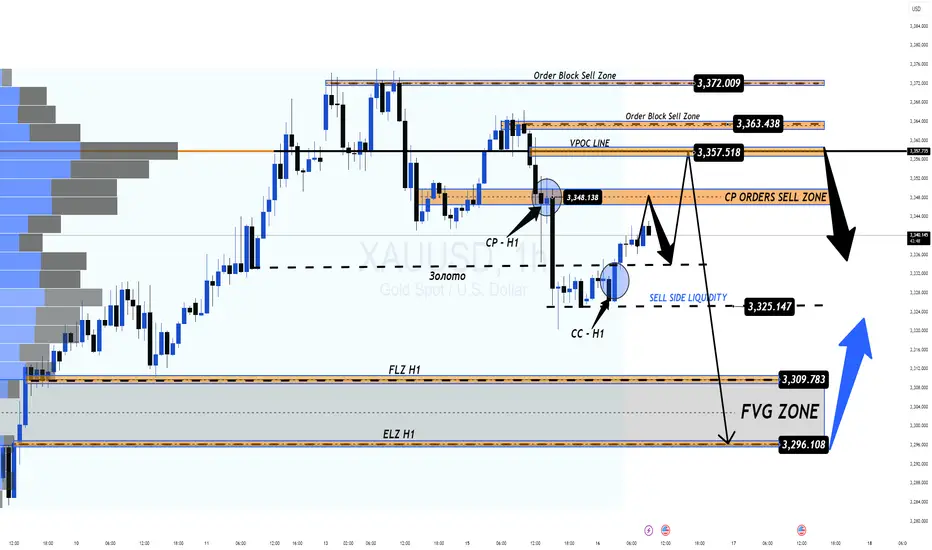
After CPI, gold retraced sharply and filled liquidity around 332x.
A clear Fair Value Gap (FVG) formed on the H1 chart, alongside a potential Continuation Pattern (CP) near 3347–3349.
Price action is likely to revisit the 334x–336x resistance zone, providing ideal short setups if rejection is confirmed.
🎯 Below lies a deep liquidity zone (FVG) near 3294, which could serve as the magnet for the next bearish move.
📊 Key Trade Zones to Watch
🔵 Buy Zone – Deep Liquidity Support: 3,296 – 3,294
SL: 3,290
TP: 3,300 → 3,304 → 3,308 → 3,312 → 3,316 → 3,320 → 3,330
🔴 Sell Scalp – CP Pattern Rejection: 3,347 – 3,349
SL: 3,353
TP: 3,343 → 3,340 → 3,336 → 3,330 → 3,325 → 3,320 → 3,310 → 3,300
🚨 Sell Zone – VPOC Level Resistance: 3,358 – 3,360
SL: 3,364
TP: 3,354 → 3,350 → 3,346 → 3,340 → 3,330 → 3,320 → 3,300
⚠️ What to Expect Today
All eyes are on the US PPI data, which could shake markets later in the session.
Look for a bullish fake-out during London or New York hours, especially toward 334x–336x zones.
Ideal strategy: wait for H1 candle confirmation before entering, and manage risk with clean TP/SL levels.
💬 Your Take?
Will gold revisit 329x this week, or are we setting up for a bullish reversal?
👇 Drop your thoughts in the comments and follow @MMFlowTrading for high-probability setups and macro insights — daily!
PPI
NAS100 - Stock market awaits inflation!The index is located between EMA200 and EMA50 on the one-hour timeframe and is trading in its ascending channel. Maintaining the ascending channel and confirming it after breaking the downtrend line will lead to the continuation of the Nasdaq's upward path to higher targets (23000), but in case of no increase and channel failure, one can look for selling positions up to the target of 22500.
Last week, the U.S.dollar demonstrated strong performance against major global currencies, despite having experienced some weakness since April 2, when President Donald Trump announced retaliatory tariffs against key U.S. trading partners. However, these tariffs were ultimately postponed, and only a baseline 10% tariff was maintained.
The 90-day deadline for implementing these tariffs, originally set to expire on Wednesday, has now been extended to August 1. Nevertheless, Trump surprised the markets this week by announcing a 25% tariff on imports from Japan and South Korea, threatening a 50% tariff on Brazilian goods, and implementing lower tariffs for other partners. These developments triggered a shift of capital toward the U.S. dollar as a safe-haven asset, boosting its strength.
This marks a notable shift in how the dollar is reacting to tariff tensions. In April, fears of an economic slowdown weighed on the greenback, but now it is gaining traction as a refuge in times of uncertainty, particularly as inflation risks mount—contributing to choppy moves in U.S. equity markets.
As is customary, the earnings season will kick off with reports from major banks and financial institutions. On Tuesday, JPMorgan is set to release its financial results, opening the floodgates for a wave of earnings reports. The image referenced lists several other companies, many of which are market heavyweights.
Following a relatively quiet week due to Independence Day holidays and a lack of major economic data, markets are now gearing up for a steady stream of reports in the coming days. Tuesday will bring the Consumer Price Index (CPI) for June along with the Empire State manufacturing survey. On Wednesday, the spotlight will shift to the Producer Price Index (PPI) for the same month. Then, on Thursday, traders will focus on June’s retail sales report, the Philadelphia Fed’s manufacturing survey, and the weekly jobless claims figures.
The week will conclude with two additional reports on Friday: the June housing starts data and the preliminary reading of the University of Michigan’s Consumer Sentiment Index.
June’s CPI report is expected to reflect an uptick in inflation, potentially driven by Trump’s tariff policies. Some analysts believe the tariffs will have an “undeniable” impact on prices, though others remain uncertain.
Despite concerns from both experts and consumers that businesses might pass tariff costs on to buyers, inflation has so far remained relatively moderate this year. The effects of Trump’s aggressive tariff campaign on hard economic data have not yet been clearly reflected—but that may be about to change.
According to Bloomberg’s consensus forecasts, as cited by Wells Fargo Securities, the CPI is expected to show a 2.7% year-over-year increase in June—up from 2.4% the previous month. Meanwhile, core CPI, which excludes volatile food and energy prices, is projected to have risen 3% over the same period, compared to a prior gain of 2.8%.
If these numbers come in as expected, it could support the forecasts of analysts who have warned that the costs of Trump’s heavy import tariffs would eventually show up on price tags, as manufacturers, importers, and retailers pass along the burden through the supply chain. Since taking office, Trump has imposed a wide array of tariffs, including a 10% levy on most imports, a 25% duty on foreign automobiles, and tariffs exceeding 50% on Chinese products.

Japan PPI slips to 10-month lowThe Japanese yen is showing limited movement on Thursday. In the North American session, USD/JPY is trading at 146.45, up 0.10% on the day.
Japan's Producer Price Index rose 2.9% y/y in June, down from an upwardly revised 3.3% in May and matching the consensus. This marked the lowest increase since August 2024. On a monthly basis, PPI fell 0.2%, a second straight decline after a 0.1% decline in May.
The PPI report signals that underlying inflation pressures are dropping at the producer level, which could delay the BoJ's plans to hike rates and normalize policy. The BoJ has been in a wait-and-see stance since it raised rates in January, exercising caution in a turbulent economic environment. The Bank of Japan held rates in June and meets next on July 31.
The FOMC minutes indicated a broad consensus that the Fed will deliver additional rate cuts this year. The pace of those cuts, however, is up for debate. Some members favored cutting as soon as the July meeting, while others were more cautious and wanted to see where inflation and employment were headed. President Trump's tariffs have not boosted inflation so far, but the tariff effect on inflation could be felt in the following months and the Fed remains cautious. Fed Chair Powell has stuck to his guns, pushing back against persistent calls from President Trump to lower rates.
Fed policymakers are keeping a close eye on the US labor market, which has softened but not deteriorated. Earlier, unemployment claims dropped to 227 thousand, down from a revised 232 thousand in the previous release and below the consensus of 235 thousand.

China's PPI slides, Australian dollar steadyThe Australian dollar is almost unchanged on Wednesday. In the European session, AUD/USD is trading at 0.6532, up 0.03% on the day.
China's producer price index surprised on the downside in June, with a steep 3.6% y/y decline. TThe soft PPI report was driven by weak domestic demand and the continuing uncertainty over US tariffs. The lack of consumer demand was reflected in the weak CPI reading of 0.1% y /y, the first gain in four months. Monthly, CPI declined by 0.1%, following a 0.2% drop in May. There was a silver lining as core CPI rose 0.7% y/y, the fastest pace in 14 months.
The uncertainty over US President Trump's tariff policy continues to perplex the financial markets. Trump had promised a new round of tariffs against a host of countries on July 9 but he has delayed that deadline until August 1.
China, the world's second-largest economy after the US, has taken a hit from US tariffs, as China's exports to the US are down 9.7% this year, However, China has mitigated much of the damage as China's exports to the rest of the world are up 6%. There is a trade truce in effect between the two countries but the bruising trade war will continue to dampen US-China trade.
With no tier-1 events out of the US today, the FOMC minutes of the June meeting will be on center stage. The Fed held rates at that meeting and Fed Chair Powell, who has taken a lot of heat from Donald Trump to cut rates, defended his wait-and-see-attitude, citing the uncertainty that Trump's tariffs are having on US growth and inflation forecasts.his was below the May decline of 3.3% and the consensus of -3.2%. China has posted producer deflation for 33 successive months and the June figure marked the steepest slide since July 2023. Monthly, PPI declined by 0.4%, unchanged over the past three months.

New Zealand dollar extends losses, inflation expectations expectNew Zealand releases inflation expectations for the first quarter on Friday. Inflation expectations can manifest into actual inflation and are considered a market-mover. Over the past three quarters, inflation expectations have hovered around the 2% level, which is the mid-point of the Reserve Bank of New Zealand's target band of 1%-3%. However, inflation expectations are expected to climb to 2.4% in the second quarter, which could complicate the Reserve Bank's plans to further trim interest rates.
New Zealand consumer inflation rose 2.5% y/y in the first quarter, up from 2.5% in Q4 2024 and above the market estimate of 2.2%. This is comfortably within the RBNZ target band and enabled the Bank to cut rates to 3.5% from 3.75% last month.
The central bank left the door open to further rate cuts at the April meeting, stressing the risk to the New Zealand economy due to rising global trade tensions. New Zealand's largest trading partner is China and the temporary agreement between the US and China to slash tariffs is good news for New Zealand's export sector. The Reserve Bank meets next on May 28.
US retail sales in April posted a weak gain of 0.1% m/m. This was well below the upwardly revised 1.7% gain in March but edged above the market estimate of 0%. There was also soft data from the inflation front. Producer Price inflation declined 0.5% in April, down from the upwardly revised 0% in March and below the market estimate of 0.2%.
The Federal Reserve is virtually certain to hold rates at the June 30 meeting, but there is a 36% chance of a rate cut in July and a 50% likelihood in September, according to CME's FedWatch. Fed Chair Powell has adopted a wait-and-see stance due to the uncertainty over US trade policy. With inflation largely under control and the labor market in solid shape, Powell is no rush to lower rates.
NZD/USD is testing support at 0.5871. Below, there is support at 0.5844
There is resistance at 0.5920 and 0.5947

SELL USDCADUSDCAD Bearish Setup – USD Weakness in Focus
This week, we anticipate USD weakness across the board, with USDCAD positioned for a decline. Short from 1.42932 (Friday’s close), targeting 1.42156 and 1.40938, with stops above 1.43668 (Thursday’s high, expected to hold strong). CPI & PPI data could add volatility, but the broader trend favours the downside.
Use proper risk management.
Best of luck to you all.

Japanese yen roller-coaster ride continuesThe Japanese yen continues to take investors and traders on a roller-coaster ride. After climbing 1.2% on Wednesday, USD/JPY gave almost all of those gains on Thursday, declining 1.05%. The yen has taken a breather today and is trading at 152.63 in the European session, down 0.19% on the day.
Producer prices in Japan climbed 4.2% y/y in January, up from an upwardly revised 3.9% in December and above the market estimate of 4.0%. PPI accelerated for a fifth consecutive month and posted its highest level since May 2023. The gain was driven by higher food prices. Monthly, PPI eased to 0.3%, down from 0.4% in December and in line with the market estimate.
The hotter-than-expected PPI report reflects persistent inflationary pressures and follows the core CPI reading for December, which hit 3%, its highest annual level in 16 months. With inflation moving higher, expectations are growing that the Bank of Japan will raise interest rates further in the near term.
The Bank has signaled that it will raise rates if wage growth increases and keeps inflation sustainable at the BoJ's 2% target. In anticipation of higher interest rates, Japan's 10-year bond yields have been rising and are close to a 15-year high.
In the US, the PPI release showed little change in January. PPI rose 0.4% m/m, after an upwardly revised 0.5% gain in December. This was higher than the market estimate of 0.3%. Annually, PPI rose 3.5%, after an upwardly revised 3.5% gain in December.
The US wraps up the week with the January retail sales report. The markets are bracing for a contraction, with a market estimate of -0.1%, after the 0.4% gain in December. Annually, retail sales are expected to dip to 3.7%, after a 3.9% gain in December.
USD/JPY is testing support at 152.73. Below, there is support at 152.29
153.00 and 153.44 are the next resistance lines

Hot Inflation & What to Watch Next - 14/02/2514th of February 2025
•XRP and BNB leading, as Bitcoin trades flat in the last seven days.
•Headline inflation metrics in the US land above expectations.
•Impactful data point to watch heading into the end of February.
---
A big week of headlines and events, particularly out of the US, have netted very little change in Bitcoin’s price.
Bitcoin is down 0.1% at the time of writing in the last seven-days, while altcoins such as XRP and BNB are showing double-digit gains.
Bitcoin has struggled to make new year-to-date highs in the current state of global conditions. In contrast, global indices in the UK (FTSE100) and China (CSI300) have continued to make new year-to-date highs
Mixed Messages & Above Expected Results
Fed Chair Jerome Powell mentioned earlier this week at a senate banking enquiry that the current state of monetary policy does not require easing conditions, as the economy remains strong and the 2% target for inflation is key.
However, he has referenced that unexpected moves in the labour market or a significant cooling of inflation could change the committee’s mind.
“If the labor market were to weaken unexpectedly or inflation were to fall more quickly than anticipated, we can ease policy accordingly.”
On this point, headline metrics for inflation land above expectations this week.
On Tuesday, Consumer Price Index (CPI) landed above expectations at 3.0%, rising 0.1% from the previous month.
Overnight the Producers Price Index (PPI) landed above expectations at 3.5% year-on-year. This figure remains unchanged from the previous month and represents the inflation burden on producers in the US.
Key data to come
On the last day of February the US Personal Consumption Expenditures (PCE) data will provide further clarity towards the state of monetary policy heading into next month.
PCE is the leading indicator used by the policy committee to measure inflation.
Fear and greed currently reads 40 – neutral.
Bitcoin Analysis
The price of Bitcoin is currently trading within the January high and low range, and on the Bollinger band we are entering a period where the upper and bottom channel is compressing.
Bullish Scenario
In the coming days, price may see a sharp move higher as the Bollinger Bands tighten. If bulls regain control and reclaim the monthly open, they could push toward last month’s high.
Bearish Scenario
We could also with this compression in the Bollinger Bands, see volatility moving price to the downside. This may result in prices heading towards the January low.
DISCLAIMER: The information is for general information purposes only. It is not intended as legal, financial or investment advice and should not be construed or relied on as such. Before making any commitment of a legal or financial nature you should seek advice from a qualified and registered legal practitioner or financial or investment adviser. No material contained within this website should be construed or relied upon as providing recommendations in relation to any legal or financial product.

EURUSD 13 Feb 2025 W7 - Intraday - US PPI, Tariffs & Peace TalksThis is my Intraday analysis on EURUSD for 13 Feb 2025 W7 based on Smart Money Concept (SMC) which includes the following:
Market Sentiment
4H Chart Analysis
15m Chart Analysis
Market Sentiment
The EUR/USD’s rise yesterday, despite hotter-than-expected U.S. CPI data, reflects a complex interplay of technical, geopolitical, and market sentiment factors.
Initial CPI Shock and Subsequent Rebound
The U.S. CPI rose 3.0% YoY (vs. 2.9% forecast), with core CPI hitting 0.3% MoM, triggering an immediate USD rally and EUR/USD dips.
Fed Policy Expectations vs. Market Positioning
Despite the CPI spike, Fed Chair Jerome Powell downplayed urgency for rate hikes, stating the Fed is “close but not there yet” on inflation. This tempered fears of aggressive tightening and limited USD upside.
Geopolitical De-escalation and Risk Sentiment
Reports of a potential territory swap deal reduced geopolitical risk aversion, weakening the USD’s safe-haven appeal and supporting the Euro.
Diverging Central Bank Policies
While the Fed’s cautious stance limited USD gains, the ECB’s restrictive policy (rates at 2.75% vs. Fed’s 4.5%) and improving Eurozone PMI data (manufacturing: 46.6; services: 51.3) supported EUR strength.
The EUR/USD rally was a corrective rebound driven by:
Technical triggers after oversold conditions.
Powell’s refusal to escalate hawkish rhetoric.
Geopolitical optimism overshadowing inflation risks.
Relative Eurozone resilience amid global trade uncertainties.
While CPI data initially favored the USD, the market’s focus shifted to policy stability and risk sentiment, allowing the Euro to recover. However, sustained EUR strength hinges on ECB rate cuts and tariff developments.
4H Chart Analysis
1️⃣
🔹Swing Bullish
🔹INT Bearish
🔹Reached Swing Extreme Demand
🔹Swing Continuation
2️⃣
🔹With the deep pullback to the Bullish Swing extreme discount and mitigating the 4H/Daily demand zones, price turned Bullish forming a Bullish CHoCH.
🔹The current Bullish move from Swing extreme discount to current price level having 2 scenarios (Previously I’d the following 2 scenarios where now I favors the 2nd scenario due to the impulsive nature of the move):
Scenario 1: Pullback for Bearish INT Structure and with the recent Bearish CHoCK and Minor Demand zones are failing, I expect Bearish continuation to target the Weak INT Low which aligns with the Daily/Weekly Bearish Structure/Move. (Counter Swing – Pro Internal)
Scenario 2: Bullish Swing continuation to target the Weak Swing High. Which requires to have Demand holding and Supply failing. The first sign required to confirm this scenario will be the current Demand which price is currently at to hold and we form a Bullish CHoCH. (Pro Swing – Counter Internal)
🔹The reaction from the recent 4H Demand Zone formed a Bullish CHoCH and a fresh Demand zone where price can pullback to after tapping the recent 4H Supply Zone.
3️⃣
🔹Expectations is set to Bullish targeting the Liquidity above the Feb 5 and then Jan 30 before any considerable pullback to then continue to target the Weak 4H Swing High.
15m Chart Analysis
1️⃣
🔹Swing Bearish
🔹INT Bullish
🔹Sweeping Swing High
2️⃣
🔹With yesterday economic and geopolitics news, we had a mixed moves based on investors sentiment and their appetite to risk.
🔹INT structure continuing Bullish aligning with the 4H Bullish Swing continuation phase.
🔹Currently price in the process of creating a 15m Bullish Swing (BOS).
3️⃣
🔹With current Bullish INT Structure and the expected Bullish BOS on 15m and it’s alignment with the 4H Bullish Swing continuation phase, expectations is set to continue Bullish to facilitate the 4H Bullish move.
🔹Having in mind that after the 15m Bullish BOS we will have a pullback which will provide opportunities to Long as Shorts currently are not viable for me.

Australia dollar eyes confidence dataThe Australian dollar has started the week with gains. In the North American session, AUD/USD is trading at 0.6275, up 0.60% on the day.
Australia releases business and consumer confidence on Tuesday, with the markets expecting some improvement. Westpac Consumer Sentiment is expected to rebound and gain 0.4% in February after a 0.7% decline in January. The National Australian Bank business confidence index is projected to improve to zero in January, after a -2 reading in December.
China's inflation was a mix, as consumer inflation rose to a five-month high while producer inflation continued to decline. CPI jumped 0.5% y/y in January, up from 0.1% in December and above the market estimate of 0.4%. This was the highest level since August. Monthly CPI rose 0.7%, up sharply from zero in December and an 11-month high, but shy of the market estimate of 0.8%
The producer price index fell 2.3% y/y in January unchanged from December and deeper than the market estimate of 2.1%. This points to deflation which is likely to worsen if the trade war between the US and China continues. On Monday, China's retaliatory tariffs kicked in after the US hit China with tariffs last week.
US nonfarm payrolls decelerate, unemployment falls
US nonfarm payrolls eased to 143 thousand in January, shy of the market estimate of 175 thousand. Still, there weres signs of strength in the labor market - nonfarm payrolls were revised by 100 thousand in the previous two months and the unemployment rate ticked lower to 4% from 4.1%, below the market estimate of 4.1%.
Average hourly earnings rose 0.5%, up from 0.3% in December and above the market estimate of 0.5%. Annually, average hourly earnings rose 4.1%, unchanged from the revised December reading and above the market estimate of 3.8%. The generally positive employment report supports the case for the Federal Reserve continuing to hold rates, possibly until the third quarter. Just a few months ago, it appeared that the Fed would stay aggressive and continue lowering rates into 2025, but with the economy purring along we might see only one or two rate cuts this year.
There is resistance at 0.6351 and 0.6430
There is support at 0.6220 and 0.6141

10/02/25 Weekly outlookLast weeks high: $102,496.97
Last weeks low: $91,204.00
Midpoint: $96,850.48
Another week of Bitcoin within the range and another one begins. With a very familiar low of ~$91K holding for the 10th week running (since the end of NOV '24), with a weekly high of $102,500 (last weekly outlooks midpoint) capping off the highs, will this weeks midpoint also act as the pivatol level? So far the midpoint has been reclaimed, a retest should add confluence to this.
We have a midweek CPI data release with a forecast 0.0% change remaining at 2.9%. These data events often cause LTF volatility and so that should be taken into account, the same is true for PPI on Friday.
Currently the market sentiment is pretty dire, the fear & greed index is at 43, the lowest since before the US Presidential Election.
Altcoins are struggling across the board, with the exception of some CEX coins all large-midcaps are below the 4H 200 EMA. I think that will change if BTC has a strong rally back above the weekly high and reclaims it, that will give the bulls the chance to finally break the $106K brick wall and flip from a rangebound environment into a trending environment again, altcoins would rally very well if this were to happen.
On the other hand is the midpoint is lost then the weekly low will need to hold for the 11th week running.
Good luck traders!

SELL DXYDXY Bearish Setup – Weekly High on Monday
This week, we anticipate DXY to set its high on Monday, followed by a sell-off. Short from 108.137, targeting 106.912 and 105.697, with a stop above 108.836. With CPI & PPI releases ahead, volatility is expected, but the bias remains bearish. A break below key support could accelerate downside momentum.
Use proper risk management.
Best of luck to you all.

AUD/USD steady as consumer sentiment slips lowerThe Australian dollar is showing little movement on Tuesday. In the European session, AUD/USD is trading at 0.6174, down 0.06% at the time of writing.
The Australian consumer remains pessimistic about the economic outlook. The Westpac consumer sentiment index fell 0.7% in January from -2% in December 2024. This brought the index down to 92.1 in January, down from 92.8 a month earlier.
The Westpac report found that confidence over employment has been falling and interestingly, a majority of consumers expect interest rates to move higher, despite signals that the Reserve Bank of Australia's first rate move will be a cut rather than a hike. The RBA hasn't moved on rates in over a year and the current cash rate of 4.25% continues to squeeze businesses and consumers. Australia releases third-quarter inflation on Jan. 29 and the central bank will be watching. That inflation reading could result in a historic rate cut if inflation is lower than expected.
We'll get a look at the US Producer Price Index later today, with mixed numbers expected. PPI is projected to jump from 3.0% to 3.4% y/y while decreasing monthly from 0.4% to 0.3%. Core PPI and is expected to jump to 3.8% y/y from 3.4% and from 0.2% to 03% m/m. If the PPI report indicates an acceleration as is expected, the money markets will likely lower their expectations for a rate cut.
Currently, the money markets have priced in a quarter-point cut at the Jan. 29 meeting at below 3% and at the March meeting at around 20%. Federal Reserve members are sounding hawkish and have signaled that the market shouldn't expect a rate cut anytime soon.
AUD/USD tested resistance at 0.6193 earlier. Above, there is resistance at 0.6209
0.6162 and 0.6146 are providing support

BOJ to discuss rate hike, yen dips lowerThe yen remains calm and is lower on Tuesday. In the North American session, USD/JPY is trading at 157.98, up 0.34% on the day.
There are no tier-1 events out of Japan this week and the yen is having a relatively quiet week. That could change with the release of US inflation on Wednesday. Headline CPI is expected to rise to 2.9% y/y in December from 2.7% in November, while core CPI is expected to remain at 3.3% y/y for a third straight month. Inflation reports have had significant impact on rate expectations but the December inflation rate might not be all that significant, as expectations of a rate cut have fallen in recent weeks.
Since the December meeting, the Fed has tried to dampen rate-cut expectations and the market is not expecting a rate cut in the first quarter of 2025. The money markets have currently priced in a quarter-point cut at the Jan. 29 meeting at below 3% and at the March meeting at around 20%. With inflation largely under control and a solid labor market, there is little reason for the Fed to cut rates in the near term.
The Bank of Japan tends not to telegraph its rate plans, leaving investors in the dark and on the hunt for clues about the central bank's rate plans. The uncertainty adds to the drama ahead of BoJ meetings and means that each meeting should be treated as a market-mover.
BoJ's Deputy Governor Ryozo Himino said on Tuesday that the BoJ would discuss a rate hike at the Jan. 24 meeting. Himino didn't say what decision he expected the BoJ to make but reiterated Governor's Ueda recent comments that wage growth was solid and that there was a lot of uncertainty surrounding Donald Trump's trade policies.
USD/JPY tested resistance at 158.13 earlier. Above, there is resistance at 158.49
There is support at 157.78 and 157.42

XAUUSD - gold will be welcomed by the Federal Reserve!Gold is located between EMA200 and EMA50 in the 1H time frame and is trading in its descending channel. If we maintain the drawn channel, we can witness the continuation of gold's decline and limited visibility of the bottom of the channel. Within the demand zone, we can buy with a suitable risk reward. If it returns to the ceiling of the channel, it is possible to sell within the supply zone.
1. UBS Gold Forecast:
UBS has projected that gold prices will reach $2,900. This prediction is based on factors such as the rising U.S. debt, strong demand from central banks, and declining interest rates. The institution also anticipates that U.S. inflation will decrease to 3% by the end of 2024, 2.6% by the end of 2025, and 2.5% throughout 2027. These figures are significantly higher than the Federal Reserve’s 2% target, suggesting that persistent inflation may pose a significant obstacle to the Fed’s efforts to control it.
2. U.S. CPI Report:
The U.S. Consumer Price Index (CPI) report for November highlighted the persistence of inflationary pressures. However, the details of the report appeared somewhat reassuring. CIBC Bank predicts that the Federal Reserve will reduce interest rates by 0.25% in its December meeting, though subsequent rate cuts may be delayed due to the economy’s continued growth.
3. Ray Dalio on Gold:
Ray Dalio, the founder of Bridgewater Associates, referred to Bitcoin as a hard asset and stated that he prefers Bitcoin and gold over debt-based assets. He expressed concerns about a potential global debt crisis and emphasized the importance of shifting investments toward hard assets.
Dalio pointed to unprecedented levels of debt in major countries such as the U.S. and China, deeming these debt levels unsustainable.Speaking at a financial conference in Abu Dhabi, he remarked, “It is impossible for these countries to avoid a debt crisis in the coming years, which will likely lead to a significant depreciation of their currencies.”
4. Dalio’s Evolving Stance on Bitcoin:
Previously, Dalio believed that cryptocurrencies like Bitcoin would not achieve the success many had hoped for. However, in recent years, he has become a prominent advocate of Bitcoin. In 2022, Dalio suggested allocating up to 2% of an investment portfolio to Bitcoin and gold as a reasonable strategy to combat inflation. He also reiterated his preference for gold over Bitcoin while emphasizing the importance of portfolio diversification.
5. Peter Schiff’s Warning on Bitcoin:
Peter Schiff, a prominent gold advocate, has warned that creating a strategic Bitcoin reserve in the U.S. could have negative consequences. On December 9, Schiff posted on the social media platform X, suggesting that the Biden administration should sell all Bitcoin currently held by the U.S. government before leaving office. He stated, “This move would not only help reduce the 2024 budget deficit but also put an end to all the nonsense about establishing a ‘strategic reserve’ of Bitcoin, which is detrimental.”

Gold Supported by Fundamentals, Testing Key Technical ResistanceTechnical Analysis
Gold is trading at $2,719, approaching a critical resistance level at $2,735 (Fib 0.786). A breakout above this resistance could pave the way for further upside toward $2,743 and $2,758, marking significant levels for long-term trend continuation. On the daily chart, the price has held firmly above the 50-day SMA, supported by a bullish RSI, indicating the potential for continued strength.
- Key Resistances :
- $2,735 (Fib 0.786).
- $2,743 and $2,758.
- Key Supports :
- $2,700 (short-term support).
- $2,693 (Fib 0.618).
In the short term, gold has encountered resistance at $2,720 and shows signs of a possible pullback. The RSI in the overbought zone suggests that a correction toward $2,700 and potentially $2,693 is likely before any continuation to the upside.
---
Fundamental Analysis
Gold prices remain near two-week highs, supported by geopolitical tensions, central bank buying, and expectations for the Federal Reserve's (Fed) monetary policy. Markets are now pricing a 95% chance of a 25 bps rate cut by the Fed next week , per the CME FedWatch tool, with a further 22% chance of another cut in January.
Key Developments Driving Gold:
1. Chinese Central Bank Gold Buying:
The People's Bank of China resumed gold purchases in November, adding 160,000 fine troy ounces to its reserves. This significant move has bolstered global gold demand and added upward momentum to prices.
2. Middle East Geopolitical Tensions:
The collapse of the Syrian government and subsequent military actions by Israel have increased investor interest in gold as a safe-haven asset.
3. US Inflation Data (CPI):
November's CPI data showed a 2.7% YoY increase, aligning with expectations and reinforcing the case for rate cuts. The core inflation rate remained stable at 3.3%. These figures have kept gold's bullish momentum intact.
---
Upcoming Data to Watch
The Producer Price Index (PPI) for the US, scheduled for release tomorrow, will provide further clues about inflation trends.
- Forecasts:
- Core PPI m/m: 0.2% (previous: 0.3%).
- PPI m/m: 0.2% (previous: 0.2%).
- Unemployment Claims: 221K (previous: 224K).
Potential Scenarios for PPI:
1. Stronger-than-expected PPI (above 0.2%):
Higher PPI could indicate persistent inflationary pressures, potentially boosting the US Dollar and pressuring gold prices lower. In this case, gold may test short-term supports at $2,700 or $2,693.
2. Weaker-than-expected PPI (below 0.2%):
A weaker PPI could further strengthen the case for Fed rate cuts, weakening the US Dollar and providing additional upside for gold. A breakout above $2,735 would open the path toward $2,743 and $2,758.
---
Conclusion
Gold remains strong in the long term, with $2,735 as a critical resistance level. A breakout above this level could trigger a rally to $2,743 and $2,758. However, in the short term, the price is expected to correct to $2,700 or $2,693 before resuming its uptrend. The upcoming PPI report is pivotal and will shape market sentiment ahead of the Fed's rate decision next week.
Recommendation
Monitor the PPI report and Fed commentary closely. A pullback to $2,700 may offer a buying opportunity, with targets set at $2,743 and $2,758 if bullish momentum persists.

NAS100 - Nasdaq will welcome Santa Rally?!The index is above the EMA200 and EMA50 in the 4H timeframe and is trading in its ascending channel. If the index corrects towards the demand zones, you can look for the next Nasdaq buy positions with the appropriate risk reward.
In recent days, financial markets have experienced a notable influx of capital. According to a report by Bank of America, capital flows amounted to $8.2 billion into equities, $4.9 billion into bonds, and $3.0 billion into cryptocurrencies. This marks the largest four-week inflow into cryptocurrencies, totaling $11.0 billion.
Capital inflows into U.S. equities continued for the ninth consecutive week, totaling $8.2 billion. Additionally, a $4.6 billion investment in small-cap U.S. stocks pushed the 2024 inflows to record highs.
Over the 12 months ending in November, an average of 186,000 new jobs were created each month. On a monthly basis, the highest job growth was observed in healthcare, leisure, and government sectors. Employment in the transportation equipment manufacturing sector also saw a boost following the resolution of labor strikes.
Recent economic data continues to highlight contractionary pressures and their effects on the U.S. economy. At first glance, November’s NFP employment report indicates a resilient and strong labor market, with the U.S. economy adding approximately 227,000 jobs. This growth was largely due to the recovery of jobs lost to recent hurricanes in the Southeast and the resolution of Boeing labor strikes, both of which had reduced employment figures in October. The October report was also revised upward to 36,000 jobs.
Unemployment rose to 4.2%, while labor force participation declined. Despite this, unemployment remains relatively low, though it may rise in the coming months if contractionary pressures persist.
This week, major events in global central bank policies are expected to take place. Dubbed by some as the “central banks’ decisive week,” it begins with the Reserve Bank of Australia (RBA) decision. Key U.S. economic data, particularly the Consumer Price Index (CPI), will play a pivotal role in shaping Federal Reserve policies.
Investors are primarily focused on inflation data. The November CPI report is set to be released on Wednesday, followed by the PPI report on Thursday. These figures will serve as a precursor to the Federal Reserve’s interest rate decision next week.
Projections indicate that annual CPI may rise from 2.6% to 2.7%, while core CPI is expected to remain steady at 3.3%. If no stronger-than-expected data emerges, the Federal Reserve is likely to lean toward reducing interest rates, with the possibility of halting monetary easing in the January meeting.
The December 2024 global economic outlook report by Fitch highlights rising inflation risks in the U.S., driven by stronger-than-expected consumer spending, upcoming tariff increases that raise import prices, and slowed labor force growth due to reduced net migration.
Fitch forecasts that global growth will decline to 2.6% in 2025, a figure largely unchanged from its September report. However, this global stability masks significant shifts in the economic growth forecasts of major countries. U.S. economic growth for 2025 has been revised up by 0.5% to 2.1%, while the Eurozone’s growth forecast has been reduced by 0.3% to 1.2%. Similarly, China’s growth forecast for 2025 has been lowered by 0.2% to 4.3%.
The persistent inflationary trends observed in recent months are unlikely to change significantly with the November CPI report. The CPI data, due on Wednesday, is one of the final and most important indicators ahead of the December 18 Federal Reserve meeting. It may influence FOMC members’ decisions on whether to reduce or halt interest rate cuts.
Currently, there is a strong probability of a 25-basis-point cut in the upcoming meeting.
Meanwhile, Donald Trump, the U.S. President-elect, stated in an interview with NBC’s “Meet the Press” that he has no plans to request the resignation of Jerome Powell, the Federal Reserve Chairman. Trump emphasized that he does not intend to replace Powell and will continue to work with him.
In recent years, financial and tech markets have witnessed remarkable shifts. One such change is the shift in focus from semiconductor companies to AI-related software firms. After a significant rally in semiconductor stocks like NVIDIA and AMD, market enthusiasm has now shifted toward software companies such as Snowflake and Palantir. This reflects a growing realization that AI’s true potential lies in its applications across industries, rather than solely in the hardware enabling it.
Semiconductor firms were the initial beneficiaries of this AI boom, but the market is now gravitating toward companies implementing AI in practical and operational ways.

XAUUSD - Buy Gold!?The US dollar gained strength again last week due to the effects of Trump being elected as the next US president. Considering that the Republican Party will control the US Congress in both the House of Representatives and the Senate, it is expected that the implementation of Trump's pre-election promises will easily become law.
The new US president wants drastic cuts in corporate taxes and tariffs on goods imported from around the world, especially from China. From the point of view of the financial community, these actions could increase inflation and prevent the Federal Reserve from lowering interest rates in the future.
US inflation data in October indicated the persistence of price pressures. Also, Federal Reserve Chairman Jerome Powell recently stated that there is no need to rush to cut interest rates. This has led some market participants to believe that interest rate cuts will stop in the near future.
Mark Leboitt, publisher of VR Metals/Resource Letter, commented: "Gold's price correction is happening as expected, with a possible drop to the $2,300 level, although the long-term view remains to reach $3,700. considers
"Right now, gold is oversold, so we're likely to see a correction," he continued. In such a situation, buying at weak price points for long-term positions and doing short-term transactions with a buying approach can be considered a suitable strategy.
Darin Newsom, senior market analyst at Barchart.com, said: "For the coming week, an upward trend is expected. The excitement and frenzy surrounding the recent US election is likely coming to an end, which means the market will face new uncertainties. In such a situation, gold can once again be considered as a safe asset by investors and can be bought as a hedge against the volatility of other market sectors, especially the stock market.
This week for the US we have S&P Global manufacturing, services and composite PMI data to watch out for. The beginning of the easing cycle in September and the first reduction in interest rates have revived hopes for the improvement of data such as PMI, and economic activities are expected to improve, especially in the manufacturing and industrial sector, with the continued reduction in borrowing costs. Therefore, although we cannot expect a significant improvement in the short term, we can hope for the improvement of the production sector in the future and gradually.
In addition, the speeches of several central bank officials are also of particular importance to traders, as they try to get indications of the speed and possible depth of interest rate cuts. Among the important speeches of the week, we can mention Goolsby's statement on Monday and his appearance again with Hamek on Thursday.

USD/JPY hit 15-week high, Japan GDP nextThe Japanese is lower for a fourth straight trading day and has declined 2.1% during that time. In the North American session, USD/JPY is trading at 155.85 up 0.25% on the day.
The markets are braced for a sharp slowdown in third-quarter GDP, which will be released early Friday. The market estimate stands at 0.7% y/y, compared to a revised 3.1% in the second quarter. On a quarterly basis, GDP is expected to ease to 0.2%, following a revised 0.7% gain in Q2. The strong GDP numbers in the second quarter reflected wage negotiations in the spring which resulted in sharp wage increases and a recovery in the auto industry.
The BoJ meets next on Dec. 19 and key data such as the GDP release and inflation will be important factors ahead of the meeting. As well, wages have been rising which could translate into increased consumer spending and demand-driven inflation.
In the US, the Producer Price Index (PPI) rose in October to 2.4% y/y, up from a revised 1.9% gain in September. The core rate also rose to 3.1% from a revised 2.9% in September. The increase in PPI comes on the heels of consumer inflation (CPI) which rose from 2.4% y/y to 2.6%. The core rate remained unchanged at 3.3%.
The Federal Reserve is unlikely to change its plans due to the rise in inflation, which had decelerated for six straight months. The path of inflation can be bumpy and Fed policymakers won’t be losing sleep over a single monthly increase. If inflation accelerates next month, however, there will be some concern and we could hear calls for an oversized half-point cut in December.
USD is testing resistance at 155.95. Above, there is resistance at 1.5643
There is support at 155.15 and 154.67

XAUUSD - which way will gold go after CPI!?Gold is below the EMA200 and EMA50 in the 4H timeframe. In case of upward correction due to today's economic data, we can see supply zones and sell within those zones with appropriate risk reward. The continuation of the downward movement of gold has led to the visibility of the demand zone and it is possible to look for buying positions.
UBS analysts are optimistic about a possible rate cut by the Federal Reserve despite inflation concerns. Recent inflation data has not been enough to change UBS's view on further rate cuts by the FOMC. UBS refers to the following points:
• Economic data indicates a stronger than expected economy.
• Concerns about inflation remain.
• The expectations of the market are moving towards the reduction of the interest rate by the Federal Reserve.
• Federal Reserve officials see the current rate as restrictive but are trying to balance employment and inflation goals.
• A major inflationary shock is needed to change the policy landscape.
The consensus seems to be that once Trump takes office, he will increase pressure on the Federal Reserve to cut interest rates to boost growth and deliver on his economic promises. This was indeed the context for the questions asked of Federal Reserve Chairman Jerome Powell last week. He was asked if he would resign if pressured by the Trump administration. Powell stated that he will not resign and that the president does not have such authority. This assumption partly goes back to the first term of Trump's presidency, when he repeatedly called for easing policies of the Federal Reserve and sometimes criticized Powell.
But the difference between today and 2018 and 2019 is that inflation was much lower at that time. Most importantly, voters showed their anger at the high cost of living by ousting Democrats from the White House and the Senate. NBC exit polls in 10 key states found that three-quarters of voters rated inflation as a moderate or severe problem in the past year, and more supported Trump.
"It makes more sense for Trump 2.0 to bear some of the economic slack (and blame it on Biden and Harris) to curb inflation," Stephen Jenn, CEO of Eurizon SLJ Capital, wrote in a note. "I don't agree at all that Trump 2.0 risks increasing inflation."
Meanwhile, China's central bank stopped buying gold for reserves for the sixth consecutive month in October, according to official data. China's gold reserves reached 72.8 million troy ounces at the end of last month. However, the value of gold reserves rose to $199.06 billion from $191.47 billion at the end of September.
The World Gold Council's report predicts that gold purchases by global central banks, which increased in 2022 and 2023, will decline in 2024, although they will remain above pre-2022 levels. This issue is partly due to the suspension of 18-month purchases of the People's Bank of China since May.

USDJPY - Will the yen continue to weaken?!The USDJPY currency pair is above the EMA200 and EMA50 in the 4H timeframe and is moving in its medium-term bullish channel. In case of correction due to the release of today's economic data, we can see the demand zones and buy within those two zones with the appropriate risk reward.
John Thune, the senator from South Dakota, has been elected as the Republican Senate Majority Leader. This election received broad support from Trump-aligned Republicans, though some factions within the GOP, particularly the far-right, were less welcoming of the choice. In this race, Thune faced competition from John Cornyn of Texas and Rick Scott of Florida, although Scott was not seen as a significant threat. Thune ultimately won in a direct, closed-ballot vote against Cornyn, securing the Senate leadership position.
Moody’s has announced that financial risks concerning the United States’ fiscal strength have escalated. In a statement, Moody’s highlighted the outlook on U.S. national debt, identifying the “decisive victory of Republicans” as a specific risk factor. Moody’s stated, “In the absence of policy measures to curb the budget deficit, federal fiscal strength will deteriorate, increasingly impacting the U.S. sovereign credit profile.”
Given the fiscal policies promised by Trump during his election campaign—and the high likelihood of their passage due to the shift in Congress—U.S. fiscal strength-related risks have increased. While Trump’s victory has been seen as positive for certain risk assets, it has had negative implications for bonds.
Meanwhile, a Bank of Japan official indicated that Japan is not currently in need of extensive financial support, allowing the central bank to resume interest rate hikes after a brief pause to assess U.S. economic developments.
Another Bank of Japan member warned that raising rates could cause market shocks, disrupting the normalization path of Japan’s monetary policies, as the divergence in policy directions between the U.S. and Japan could heighten foreign exchange market volatility. Additionally, one member emphasized the need to be prepared for potential market fluctuations due to the U.S. presidential election results.

GBPUSD - Is inflation under control in America?!The GBPUSD currency pair is located between EMA200 and EMA50 in the 4H timeframe and is moving in its downward channel. If the downward trend continues due to the release of today's economic data, we can see the demand zones and buy within those zones with the appropriate risk reward. In case of an upward correction, this currency pair can be sold within the specified supply zones.
The Governor of the Bank of England noted that the UK’s Consumer Price Index (CPI) does not accurately indicate whether underlying inflation dynamics have been suppressed. There remains a risk of rising energy prices, and inflation within the services sector is notably resilient and persistent. He anticipates greater volatility ahead, with some inflationary drivers potentially shifting upwards.
Additionally, according to new data from the Cleveland Federal Reserve, the inflation trend in the U.S. continues to remain above 2 percent. The Median CPI for the previous month was reported at 4.09 percent, a slight increase from 4.08 percent in the prior month. Since June, this measure has only seen a minor decline, from 4.15 percent to the current level.
Median CPI is a monthly inflation indicator that measures price changes at the midpoint of a basket of goods. Although this method may differ from the standard CPI, it focuses on items that fall within the midpoint of the distribution.
Charts within this report show that other inflation indicators are relatively stabilized, while the decline in the headline CPI is primarily due to a drop in energy prices, which is considered a temporary factor.
According to the Federal Reserve Bank of New York, despite ongoing challenges, debt levels remain manageable. Although delinquency rates have risen, income growth continues to outpace household debt growth. In the third quarter, delinquency transition rates varied, with credit card delinquencies improving, while delinquency rates for auto loans and mortgages saw a decline.
At the end of Q3, 3.5 percent of debt was in some stage of delinquency, up from 3.2 percent in Q2. Overall delinquency rates also increased during this period. According to the data, credit card balances in Q3 rose 8.1 percent compared to the same period last year, reaching $1.17 trillion, marking an increase of around $24 billion from Q2. Additionally, mortgage balances increased by $75 billion in this period, reaching $12.59 trillion.
