NZDUSD Bearish Setup🔍 Market Structure Analysis
WSD Zone Rejection (Top):
Price tapped a wick-based supply & demand (WSD) zone at the top around 0.59486.
That zone also aligns with the previous liquidity grab + mitigation of the OB.
Price is now rejecting that area — forming a lower high (LH) inside the zone → classic sign of distribution.
Rising Channel Break:
Price was rising inside the red ascending channel.
Currently showing bearish intent, with multiple internal BOS (breaks of structure).
If price closes below the channel, that confirms bearish expansion.
Downtrend from Premium Zone:
We're clearly in premium pricing, where institutions prefer to offload longs.
This area also completes a liquidity sweep of prior highs inside the WSD zone.
🧠 Trade Logic (Sell Setup)
🔺 Entry Zone: Inside or after rejection of WSD at 0.59486.
🛑 Stop Loss: Just above the WSD zone and local high.
🎯 Take Profits:
TP1: 0.58669 → Local support + lower WSD zone (reaction zone).
TP2: 0.58398 → Previous liquidity pool and external low.
🧾 R:R = Clean 1:4.5+, textbook SMC setup.
📌 Confluences for Bearish Bias
✅ Multiple WSD zones tested with bearish rejection.
✅ Rising channel inside premium is breaking.
✅ Mitigation + BOS on smaller TF.
✅ News candle marked by blue vertical line may act as final volatility spike before continuation.
✅ Price is near VWAP/50% equilibrium → Ideal for smart money to expand to downside.
🧯 Invalidation Conditions
❌ If price closes above 0.59486, we reassess the bias.
❌ A re-entry into the upper WSD with strong bullish volume invalidates the current bearish flow.
🔮 Forecast Summary
This is a classic distribution setup with liquidity engineered into a WSD zone, now showing early mitigation and markdown signs. Unless major manipulation occurs, expect price to expand toward the 0.58398 low in the next 24–48 hours.
PPT

EURUSD Bearish Setup📌 Market Structure & Setup Summary
Major Supply Zone Rejection (Red Zone at Top):
Price tapped into higher timeframe supply zone at 1.13755 (red box).
This was a buy-side liquidity grab just above the previous high → textbook distribution zone.
Now price is respecting that zone and rejecting it with bearish momentum.
Bearish Rising Channel Broken:
Red trendlines show a rising wedge → often leads to a bearish breakout.
Price is currently breaking out of that wedge to the downside.
Premium Pricing Confirmed:
Price was pushed into the premium zone (above equilibrium), inducing buy orders → now being reversed.
🔄 Trade Plan (Short Bias)
✅ Entry: Activated inside the red supply zone after confirming wick rejections and structure shift.
🛑 Stop Loss: Above the red supply zone (above 1.13755).
🎯 Targets:
TP1 → 1.12545: Structure support and breaker block.
TP2 → 1.11663: Previous demand zone and trendline intersection.
TP3 (Optional) → 1.11002 – 1.10610: External liquidity + trendline + FVG zone.
📉 RR Ratio: Estimated 1:4 to 1:5+ if TP2/TP3 hits.
⚠️ Key Confluences
🔹 Bearish break of rising wedge = structural shift.
🔹 Rejection wick inside red supply + BOS.
🔹 TP zones aligned with previous OB, breaker blocks, and liquidity pools.
🔹 News/volatility likely during the double blue vertical lines, so expect reaction spikes.
🚫 Invalidation Criteria
If price closes above 1.13755, the idea is invalid.
Watch for manipulation or false breakouts during high-impact news.
🔮 Market Forecast
If current rejection holds, expecting price to seek sell-side liquidity from 1.12545, then 1.11663, and possibly lower. This is a classic distribution > BOS > retrace > expansion sequence.

GBPUSD Bearish Setup📌 Current Market Structure
Liquidity Sweep + Rejection in Premium Zone:
Price tapped into the major supply zone (red box) sitting above the last high.
Liquidity above previous highs was swept, and now price is rejecting → a classic buy-side liquidity grab setup.
Bearish Rising Wedge Structure Broken:
Price broke the inner rising wedge (red trendlines) to the downside and is now retesting the supply zone.
Breakdown aligns with a potential reversal entry or at least a bearish pullback.
Higher Timeframe Supply Zone:
The red zone coincides with the 1.34782 resistance, which price failed to break cleanly above.
This zone holds institutional footprints → possible smart money distribution.
🧠 Trade Idea (Bearish Bias Confirmed)
✅ Entry: Already activated inside the red supply zone.
📍 Stop Loss: Just above the red box (around 1.3480).
🎯 Target Zones:
TP1: 1.33281 → minor demand zone and previous consolidation.
TP2: 1.32870 → previous BOS retest zone.
TP3: 1.32543 → deep demand zone and trendline intersection.
TP4: 1.31759–1.31554 → external liquidity resting below structure (long-term target).
🔻 Risk-to-Reward: Excellent potential up to 1:5+ RR if TP4 hits.
🔄 Reversal Signals Confirmation
Watch for:
Bearish engulfing candles with rising volume inside the red zone (VSA style).
Displacement candle or M5–M15 BOS confirming internal structure shift.
⚠️ Invalidation Zone
If price closes a 1H candle above 1.3480, setup is invalidated.
Watch out for possible manipulation during the vertical blue lines (likely high-impact news).
🔮 Forecast:
Expecting a mid- to long-term retracement or reversal back to the 1.31700s – 1.32800s region, based on the current rejection from premium supply and completion of a liquidity sweep.

NZDJPY bearish continuation📌 Key Observations
Previous Structure Shift (QM + Break of Structure):
There was a clear Quasimodo (QM) formation at the top, followed by a break of structure to the downside, confirming bearish intent.
The high created liquidity and was swept—then price broke below the QM low confirming order flow shift.
Bearish Channel Breakout & Retest:
Price broke below the rising wedge (bearish reversal pattern).
Retested inside a minor bearish flag now acting as a continuation pattern (currently breaking it down again).
Current Price Action:
Price is reacting to a supply zone inside the red box, which also aligns with:
A previous order block.
A potential breaker structure.
This zone also represents a BOS retest.
🧠 Trade Idea (Sell Bias Confirmed)
✅ Entry: Inside the red supply zone (already showing rejection).
🎯 Target Zones:
TP1: 85.15 → minor demand zone + previous structure.
TP2: 84.20 → mid-level POI.
TP3: 83.14 → major demand/FVG zone.
TP4: 82.58 → extreme demand and liquidity resting point.
📍 Stop Loss: Above the red zone, ~85.95 to 86.00 area.
🔻 Risk-to-Reward (RR): The RR to final target (TP4) looks excellent (~1:4 to 1:5+).
🧩 Volume/Engulfing Confirmation (Optional)
You may wait for a bearish engulfing candle inside the red zone with bearish volume to confirm entry if you're applying your VSA + engulfing method.

GBPJPY bearish move🔹 Pair / TF | GBP/JPY, 1 h → 15 m |
| 🔹 Bias | Bearish (selling the break of support) |
1. 📊 Key Levels
Level Price Role
R1 191.721 Major resistance (green)
Broken Support 190.65 (black line) Minor support → now resistance
R4 189.828 Next minor support
R2 189.355 Next major support
2. 🚨 Trigger
Price closes below the 190.65 support (black line) on 1 h, AND
200-hour MA (red) has just been rejected—sellers stepping in.
This decisive break flips 190.65 into new resistance.
3. ✅ Confirmation
RFI oscillator on 15 m dips below its rising trendline and fails to reclaim it.
Momentum is clearly bearish—no divergence or oversold reversal signal.
4. 🎯 Entry & Stops
| 🔶 Entry Zone | 0.19060–0.19050 (just below 190.65) | | 🔴 Stop-Loss | 0.19180 (above R1 at 191.72) ≈ 120 pips |
Place a Sell-Stop at 0.19055 (mid-zone).
Risk: 1–2% of account on ~120-pip SL.
5. 🎯 Profit Targets
Target Level Pips RRR
T1 R4 189.828 ~82 pips 1 : 0.7
T2 R2 189.355 ~125 pips 1 : 1
Scale out:
Exit ½ at T1.
Let the rest run to T2.
6. ⚙️ Trade Management
Move SL to breakeven once +40 pips in profit.
Monitor RFI on 15 m:
If RFI spikes above its trendline before T1, close remaining.
Adjust if you see large wicks or volume spikes into support zones.
7. 🔑 Rationale
Support→Resistance flip at 190.65 gives a logical entry & SL.
200-hour MA rejection confirms sellers overpowering buyers.
RFI confirms sustained bearish momentum.
High RRR (>1 : 1) ensures edge even with a moderate win-rate.
⚡ Highlight:
This is a bank-order-flow style fade—selling the break of minor support after a MA confluence test, riding momentum into larger support zones.

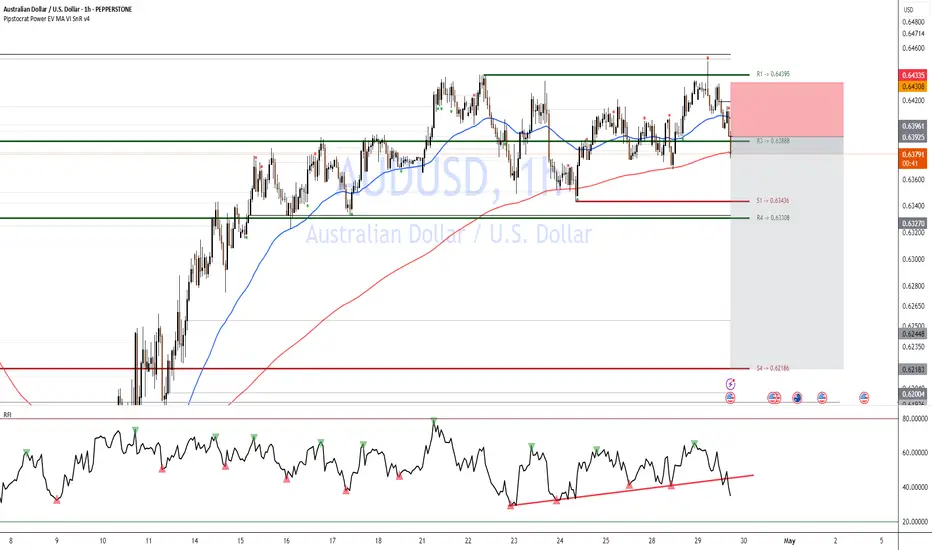
AUSSIE bearish move Short-setup: Breakdown of Support (AUD/USD)
Trigger: Price has decisively broken below R3 (0.63888) and the 200-hour MA (red) on the 1h chart.
Confirmation: RFI just dipped below its ascending trendline and failed to reclaim it—momentum is bearish.
Entry: Short at market 0.6385–0.6380 (just below R3).
Initial Stop: Above R1 (0.64395) ≈ 55 pips stop.
Targets:
T1: S1 (0.63436) (~40 pips → RRR ≈ 1 : 0.7)
T2: R4 (0.63308) (~55 pips → RRR ≈ 1 : 1)
⚡ Highlight: This is a bank-order-flow style fade—selling the break of minor support after a test of the 200-hour MA confluence.
🔑 Rationale
Support→Resistance flip at R3 gives logical entry & SL.
200-hour MA rejection confirms sellers overpowering buyers.
RFI confirms sustained bearish momentum.
High RRR (>1:1) ensures edge even with moderate win-rate.
NASDAQ INVESTORS IDEA FOR LONGINGThis is just a simple old way of trading with Pure Price Action. A long-term view of the Nasdaq. On a weekly time frame, it provides some interesting ideas for going long, let me start by stating that we are on an uptrend, and currently we just experiencing a retracement, a correctional wave. Some people explain it as a point where sellers are given an opportunity to close their loss cheap while on the other hand, it's providing an opportunity for banks that missed an entry earlier to start buying, or simply the ICT or SMC traders call it craping liquidity and triggering buy stops.
In pattern trading form we can say that we are having a flag pattern and the market is about to continue the trend. The move is about to start now, the reason being that we are having *equal lows* meaning we might be presented with a *double bottom* that will *break the trendline* and skyrocket 🚀🚀

GBPJPY BREAKOUT TRADEPair: GBPJPY
Timeframe: 4H
Analysis: Round number level, trend line, volume profile, support and resistance, ascending triangle pattern
—————
Key Takeaway: Need a break of round number and resistance with strong bullish momentum
—————
Level needed: need a close by 161.450
—————
Trade: Long
RISK:REWARD 1:7
SL: 30
TP: 210
—————
DO NOT ENTER OUR SETUPS WITHOUT CONFIRMATION

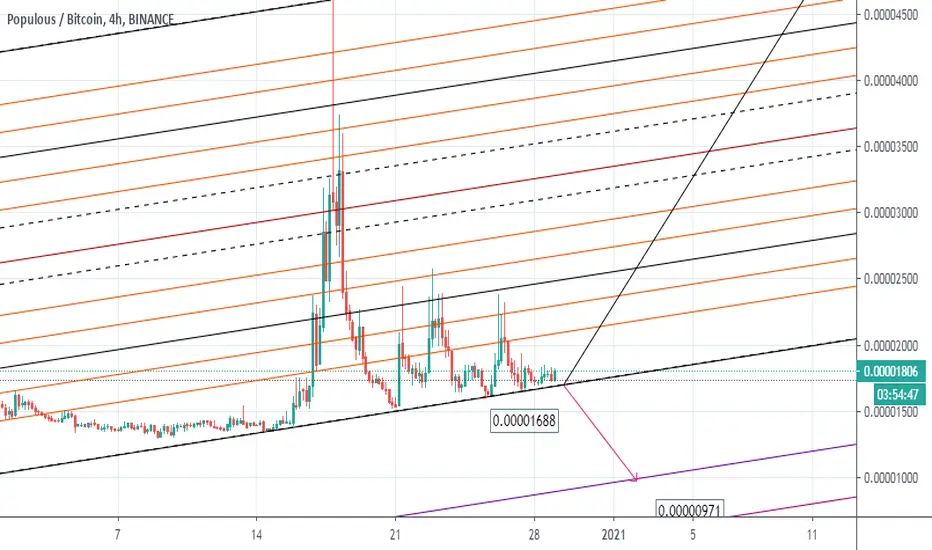
Populous SURPRISE INCOMING!ready to breakup from the major triangle formation
bull phase started end of 2020
targets previous ALL TIME-HIGHS
I hope you found the idea interesting;)


Buy PPTUSDT Target $5.4Buy PPTUSDT Target $5.4
Buy PPTUSDT Target $5.4
Buy PPTUSDT Target $5.4
Buy 1
Buy 1
Buy 1

PPT/USD Ready for a breakout to the upside!PPT is gaining momentum to the upside and the first target is $5. If you would like access to our Pro Oscillator please DM us or click the "Website" button below. Please DYOR!

the nice weekly chart with nice targetslets buy and hold to go to the moon, it is best to hodl for 1 year


Descending Scallop ComparisonElastos can be seen to be in the early stages of nearing a reversal point with this recent bounce off the descending scallop trendline
While populous can be seen, engaged in a reversal at the current moment
Descending scallops often are very slow to come to fruition and is a common trend among many altcoins
Heres two

Populous (PPT) Is Already There | Next Target!We've been looking at charts where a long upper wick was printed a month ago... All these are now gaining upwards momentum to try and challenge again this same resistance.
MDA, APPC, EVX, and now PPT.
The next target is marked on the chart.
Remember you need a plan to trade.
Do your own research and be patient, this market offers endless opportunities and if one goes there is sure to be more.
Be grateful. 🤗
Thanks a lot for your support.
Namaste.

Reversal of a degenerative coin PPTSimple alligator analysis
You can see the bullish reversal using this indicator with the opening of the alligator, indicated with an arrow
This coin has been in bear mode for about three years
I say, its about time
Congratulations to all the hodlers!

PPT longterm support and resistance roadmapPPT longterm support and resistance roadmap.
At the time of speaking ppt managed to S/R flip the blue horizontal longterm resistance line from $1.70 dollar.
That has been an important longterm accumulation resistance level.
If the price managed to hold this blue line we will see much higher prices in the near future.


POPULOUS (PPT) On A Parabolic Rise After The BreakoutPOPULOUS (PPT) broke out of the falling wedge and now trying to retest 200 SMA which is very health. Price actions usually continue to move higher after the breakout of the falling wedge and the retest of 200 SMA is complete.

#PPT/BTC Ready for a potential 316% Pump!!!Welcome to this quick altcoin setup.
PPT is a low volume coin but when it rallies it goes over 2x and even 3x.
As per the chart it seems PPT has touched the bottom and is currently bouncing off the lower trendline support.
Though iMy plan is to book good profits from this asset.
I've added some in my alt bag and will add more if it falls.
Its a shitcoin but yes at times it is highly profitable.
Expecting a good run in this coin in the next few days.
Bouncing from the support trendline in 3 Day chart.
You can trade this coin but with little amount. Dominance is falling so we can expect some good gains from altcoins.
ENTRY : 1355 to 1375
Second entry if it retraces more : 1288 to 1340
TARGETS:
2490
2852
3590
5160
Stop Loss : 1233
Please do your own research before investing.
Thanks for reading. Feel free to hit that like button and share your views in the comment section.
Stay safe
#PEACE
