US CPIs came out. Gold is at an interesting spot.TVC:GOLD is currently struggling with one of its key resistance barriers, at around 3365. We need a clear break above that area in order to aim for higher areas. However, we are not getting bearish yet. Let's dig in!
MARKETSCOM:GOLD
Let us know what you think in the comments below.
Thank you.
75.2% of retail investor accounts lose money when trading CFDs with this provider. You should consider whether you understand how CFDs work and whether you can afford to take the high risk of losing your money. Past performance is not necessarily indicative of future results. The value of investments may fall as well as rise and the investor may not get back the amount initially invested. This content is not intended for nor applicable to residents of the UK. Cryptocurrency CFDs and spread bets are restricted in the UK for all retail clients.
Preciousmetals

GOLD - GC | Weekly Recap & Plan 13.07.2025🟡 GOLD (GC) Weekly Recap & Outlook
Symbol: GC1!
Date: Week of July 8–12, 2025
Timeframes Used: 4H, Daily, Weekly, HTF structure
🔍 What Happened Last Week?
Gold saw a strong rejection from a confluence of two HTF trendlines, signaling resistance.
But that move was absorbed by:
🟦 Daily Demand (blue zone)
🔵 Daily Swing Liquidity (blue line)
This builds a bullish structure on the daily chart.
🧭 Scenarios I'm Watching
Scenario 1 — Minor Pullback:
🔹 Price may revisit the Daily Gap (pink line) and find support for continuation.
Scenario 2 — Deeper Pullback:
🟣 Price could retrace into the HTF bullish trendline (purple) before resuming upside.
🗞️ Bonus Macro Scenario: Powell Resignation?
There are growing rumors that Fed Chair Powell might resign this week.
📈 If that happens, I expect strong bullish momentum in Gold —
→ very limited retracement, and
→ potential straight breakout into new highs.
🎯 Targets for the Week:
✅ 1st Target:
W C DOL (purple line) → acts as a primary take profit area.
✅ 2nd Target (Expansion):
EQHs / DOL (extended purple levels)
Game Plan:
Watch for LTF confirmation on both retracement zones.
Maintain bullish bias unless Daily Demand fails.
If Powell resigns, be ready for breakout setups.

Silver to $38The move from March 2020 to August 2020
Was a measured move that played out to the Tee.
We have a similar structure building that projects to the High 30's
Suggesting #Gold move beyond ATH's and #Silver the beta play to move faster in an attempt to catch up, and move towards it's high's again.

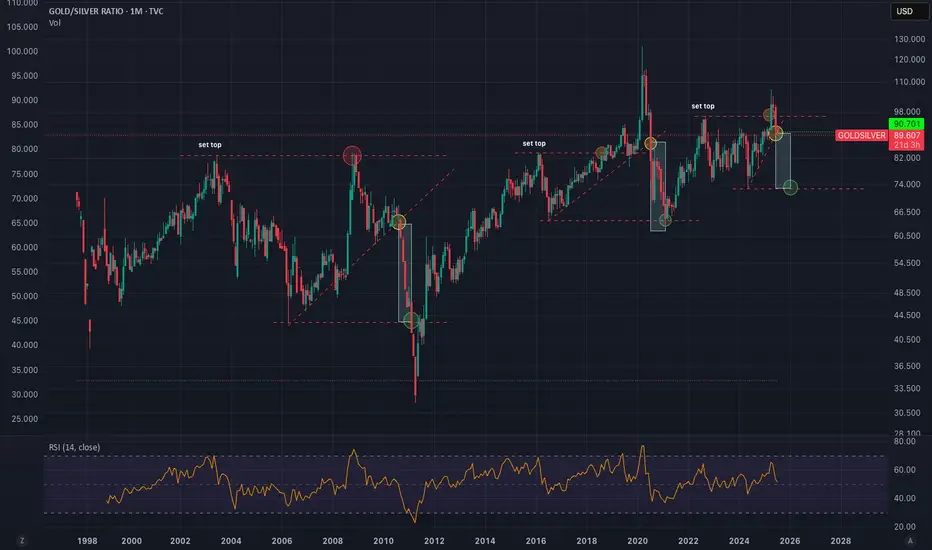
Gold/Silver Ratio to 72 Minimum - Imminent Silver BreakoutGoldSilver Ratio is following a clear pattern of behavior. We can expect a return to mean conservatively hitting 72 at a minimum. This puts silver at $46-58 if Gold doesn't move higher. I think we will see silver 5-10X over the next few years. Easy 25-50% in the short term (6-12 months).
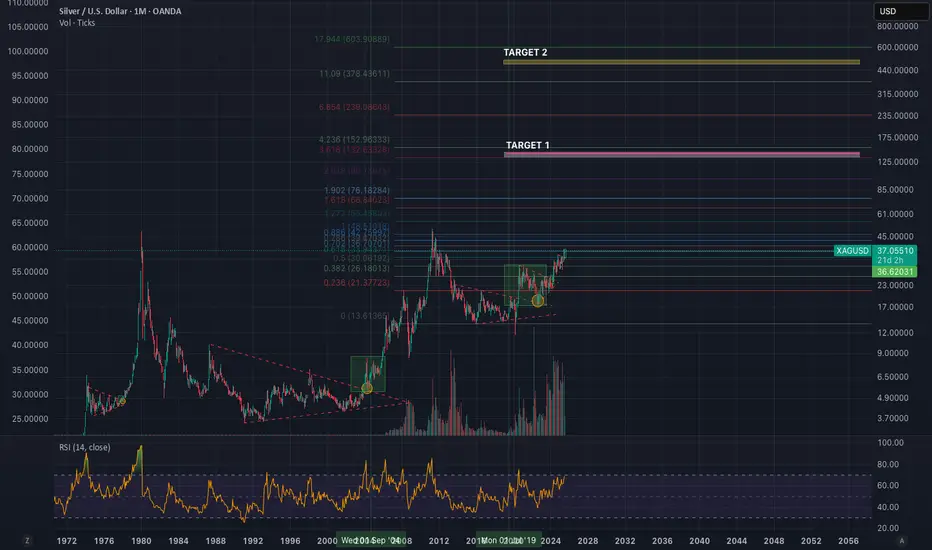
Silver Spot to $136/oz then $477/ozThis could take multiple years to play out, my gold call 2-3 years ago was dead on. All I'm using are multi-fib confluences and the assumption that currency debasement and global liquidity will continue to increase over time. I am riding silver for the long haul. Watch Gold and for DXY bottoming pattern. Silver and Crypto move when DXY enters a momentum shift to the upside. Silver to $136-150 then $477-500 eventually.
Gold To The Basement? Week Ahead with Bearish Bias by PhoenixFX🌟 Welcome to Phoenix FX’s Intraday Pulse! 🌟
Hello, Phoenix FX family! 👋 I’m thrilled you’ve joined us for today’s TradingView chart breakdown. Our focus? Intraday opportunities—spotting those high-probability setups you can enter, manage, and leave to run whilst you concentrate on the things you love doing.
Here’s what you’ll find in this analysis:
Key Levels & Zones: Support, resistance, and Fair Value Gaps that matter on the smaller timeframes.
Price-Action Clues: Exact candlestick patterns and momentum signals to watch for your next entry.
Trade Triggers & Targets: Clear criteria for when to get in, where to take profits, and how to manage your risk.
Whether you’re hunting quick scalps or tactical swing moves, our goal is simple: help you trade with confidence, clarity, and community support. Got a different view or a fresh idea? Drop it in the comments—after all, “each one, teach one.” 😉
Let’s dive into the charts and make today’s market moves count! 🚀📈
Donald Trump’s presidency continues to exert outsized influence on gold through three main channels: trade policy uncertainty, fiscal stimulus (and resulting deficits), and shifts in safe-haven demand. Here’s how each factor has played out—and what it could mean for gold going forward:
1. Trade-War Uncertainty
What’s Happening: The Trump administration’s aggressive use of tariffs—including recent 25% duties on goods from Japan and South Korea—has periodically roiled markets and driven investors into gold as a safe haven. On July 7, gold pared losses after tariff news, as traders sought refuge despite a firm dollar.
Looking Ahead: If further tariff escalations or retaliations emerge, expect renewed spikes in gold. Conversely, any de-escalation or trade-deal breakthroughs could sap that safe-haven bid.
2. Fiscal Stimulus & Deficits
What’s Happening: Senate Republicans recently passed a Trump-backed tax‐and‐spending package projected to add $3.3 trillion to the U.S. deficit. Larger deficits—especially when financed by the Fed—tend to stoke inflation expectations, which bolsters gold’s appeal as an inflation hedge.
Looking Ahead: Continued large-scale stimulus or fresh tax cuts without offsetting revenue measures could keep real yields low (or negative), a classic tailwind for gold.
3. Safe-Haven Flows & Investor Positioning
What’s Happening: Despite peaking at record highs earlier this year, gold remains up roughly 30% since November, driven largely by investor fears around Trump’s policy unpredictability and geopolitical tensions.
Looking Ahead: Should Trump-era uncertainty persist—whether around trade, foreign policy, or domestic turmoil—gold is likely to retain its status as a portfolio diversifier and crisis hedge. A sustained drop in U.S. real rates or fresh bouts of market volatility would reinforce that trend.
🎯 Outlook Summary
Bullish Drivers: Ongoing trade-war rhetoric, larger deficits, and any new geopolitical flashpoints.
Bearish Risks: Clear resolution of major trade disputes, a pivot by the Fed toward earlier rate cuts (reducing real‐rate support for gold), or diminished investor fear.
------------------------------------------------------------------------------------------
PhoenixFX price action analysis based on the Daily time frame
🔴 Primary Resistance (Daily)
Zone: $3,348 – $3,400
Why It Matters:
Multiple daily closes have stalled here, leaving a clear Fair-Value Gap (dashed purple). Sellers are likely to defend this range until we see a decisive daily close above $3,400.
📉 Bearish Bias – Short Setups
Short at Resistance
Entry: Bearish daily reversal candle (engulfing, pin-bar) in $3,348–$3,400
Targets:
TP1: $3,290 (50% of Primary Buy Zone)
TP2: $3,250 (Primary Buy Zone low)
TP3: $3,172 (Secondary Buy Zone high)
Stop-Loss: Above $3,420
Breakdown Short
Trigger: Daily close below $3,250 (Primary Buy Zone low)
Entry: On the open of the next daily candle after close below $3,250
Targets:
TP1: $3,172 (Secondary Buy Zone)
TP2: $3,026 (Final Buy Zone 50% level)
Stop-Loss: Above $3,290
🔵 Potential Long Opportunities
Defensive Long (Aggressive)
Entry: Bullish daily rejection candle in $3,250–$3,290
Targets:
TP1: $3,348 (short-term resistance)
TP2: $3,400 (key resistance)
Stop-Loss: Below $3,230
Trend-Reversal Long (Ultra-Conservative)
Trigger: Daily close above $3,400
Entry: Open of the next daily candle after the close above $3,400
Targets:
TP1: $3,450
TP2: $3,500+
Stop-Loss: Below $3,360
📊 Week-Ahead Scenarios
Bearish Scenario (High Probability):
Price remains capped under $3,400.
Look for a bearish signal in $3,348–$3,400 to initiate shorts.
A break below $3,250 extends the move into deeper demand zones ($3,172 → $3,026).
Bullish Counter-Trend (Lower Probability):
Strong daily rejection candle in $3,250–$3,290 could spark a relief rally.
Short-term longs can target $3,348 and $3,400—ideal for quick swing trades.
Only a sustained daily close above $3,400 shifts the bias back to the upside.
Just a Heads-Up:
This is my take on the charts—not gospel, not financial advice, and definitely not a crystal ball 🔮.
Trading is part skill, part patience, and part “what just happened?” 😅
We all see things a little differently, and that’s the beauty of it. So if you’ve got a hot take, wild theory, or just want to drop some chart wisdom—hit the comments!
Let’s grow, learn, and laugh through the madness together. 🚀📈
Each one, teach one.
— Phoenix FX Team 🔥🦅

Cheap jewellery (Silver XAG/USD)Setup
Silver is sitting just under multi-decade highs having broken above $34 resistance last month. The long term cup and handle pattern is still in place.
Signal
The price has been consolidating in what could be a bull flag pattern between 35 and 37. A breakout could trigger the next leg of the uptrend, whereas a drop below the bottom of the flag would imply a retest of 34.

EURUSD: Expecting Bullish Continuation! Here is Why:
The analysis of the EURUSD chart clearly shows us that the pair is finally about to go up due to the rising pressure from the buyers.
Disclosure: I am part of Trade Nation's Influencer program and receive a monthly fee for using their TradingView charts in my analysis.
❤️ Please, support our work with like & comment! ❤️

“Accumulation, Breakout, Repeat: SBSW’s Time Again?” SBSW | Weekly Chart Analysis
4-Year Cycle | Smart Money Levels | Precious Metals Macro Tailwind
This chart paints a clear picture — Sibanye-Stillwater (SBSW) has followed a reliable 4-year accumulation-to-expansion cycle:
🔹 2015–2016
🔹 2019–2021
🔹 Now shaping up for 2025–2026
Each rally kicked off after institutional accumulation around the $3 level, and once again, we’re seeing the same behavior. History doesn’t just rhyme — it repeats.
🧠 Smart Money Moves
Every major cycle began after price based out near the $3 level. That’s exactly what we’ve just seen — accumulation, basing, and now lift-off. We’ve entered a familiar pattern — the same smart money footprints showing up again.
📊 Technical Breakdown
This is the weekly chart, and we’re now testing the 0.236 Fibonacci retracement level (7.39) drawn from the 2020 high to the recent low.
✅ A weekly close above this level + structure building could confirm the beginning of a long-term leg higher.
📈 Volume Flow Indicator has crossed above the midline for the first time in years, suggesting that real buying pressure is back. That’s a shift in momentum worth noting.
🎯 Key Areas of Interest:
• $10.00 – Volume node + prior S/R
• $12.00 – Fib midpoint + prior pivot
• $14.90 – Confluence zone
These are zones where I’ll be watching for continuation, reaction, or reversal.
🌎 Macro Tailwind: Precious Metals Demand
Platinum and palladium are gaining renewed attention as demand increases in EVs, clean energy, and industrial sectors. SBSW — with its deep exposure to both metals — is positioned as a long-term beneficiary if this trend continues.
Add to that the recent global instability and de-dollarization chatter, and you’ve got a macro backdrop favoring real assets over paper. Precious metals are catching a bid — and SBSW could ride that wave.
🧠 My Position
Started buying $4.00 calls and recently rolled to $5.50s. I’m letting this one develop over time — watching for confirmation and continuation.
(Not financial advice — just sharing my perspective as always.)
🕰️ Cycles matter.
📚 History teaches.
💰 Smart money accumulates before the breakout.
This setup has all the hallmarks of a repeat cycle in progress. I’m locked in.
—
📍 Long-term chartwork, weekly timeframe. Zoom out to see the rhythm.
SBSW | Weekly Chart Analysis
4-Year Cycle | Smart Money Levels | Precious Metals Macro Tailwind
This chart paints a clear picture — Sibanye-Stillwater (SBSW) has followed a reliable 4-year accumulation-to-expansion cycle:
🔹 2015–2016
🔹 2019–2021
🔹 Now shaping up for 2025–2026
Each rally kicked off after institutional accumulation around the $3 level, and once again, we’re seeing the same behavior. History doesn’t just rhyme — it repeats.
🧠 Smart Money Moves
Every major cycle began after price based out near the $3 level. That’s exactly what we’ve just seen — accumulation, basing, and now lift-off. We’ve entered a familiar pattern — the same smart money footprints showing up again.
📊 Technical Breakdown
This is the weekly chart, and we’re now testing the 0.236 Fibonacci retracement level (7.39) drawn from the 2020 high to the recent low.
✅ A weekly close above this level + structure building could confirm the beginning of a long-term leg higher.
📈 Volume Flow Indicator has crossed above the midline for the first time in years, suggesting that real buying pressure is back. That’s a shift in momentum worth noting.
🎯 Key Areas of Interest:
• $10.00 – Volume node + prior S/R
• $12.00 – Fib midpoint + prior pivot
• $14.90 – Confluence zone
These are zones where I’ll be watching for continuation, reaction, or reversal.
🌎 Macro Tailwind: Precious Metals Demand
Platinum and palladium are gaining renewed attention as demand increases in EVs, clean energy, and industrial sectors. SBSW — with its deep exposure to both metals — is positioned as a long-term beneficiary if this trend continues.
Add to that the recent global instability and de-dollarization chatter, and you’ve got a macro backdrop favoring real assets over paper. Precious metals are catching a bid — and SBSW could ride that wave.
🧠 My Position
Started buying $4.00 calls and recently rolled to $5.50s. I’m letting this one develop over time — watching for confirmation and continuation.
(Not financial advice — just sharing my perspective as always.)
🕰️ Cycles matter.
📚 History teaches.
💰 Smart money accumulates before the breakout.
This setup has all the hallmarks of a repeat cycle in progress. I’m locked in.
📍 Long-term chartwork, weekly timeframe. Zoom out to see the rhythm.
🛑 Invalidation below $5.50 — no structure, no conviction, I’m out.
If SBSW breaks back below the $5.50 level with high volume and fails to reclaim it quickly, that would invalidate the current breakout structure and suggest this move was a false start. I'd reassess the cycle thesis if we revisit the $4 range with no buyer defense.
Please feel free to comment and let me your opinion

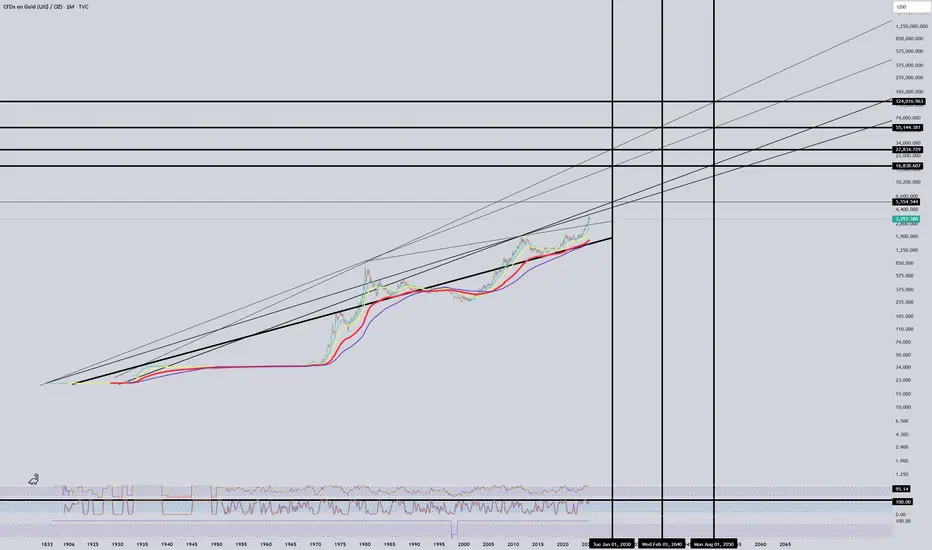
WHAT IS THE EXPECTED RETURN and DURATION of this GOLD Bull Run?Well, when measured against the DXY index, a clear trend becomes apparent.
A Golden Bull typically lasts about 40 quarters, which is essentially 1 decade (give or take a quarter).
Similar to #Bitcoin and its cyclical bull markets within a larger secular bull, the returns tend to decrease over time.
However, it seems that a triple-digit Gold price relative to the DXY is on the horizon at the very least.
What would that look like if the DXY were to hit a new low around 69? This would suggest a Gold price of $6900 at a ratio of 100:1.
A Gold price of $12K with a DXY of 80 only requires a ratio of 150...
Thus, a five-digit Gold price is certainly within the realm of possibility.
I have forecasts that extend as high as $12K.

Is gold in an ascending triangle, or in a wider range?A quick technical piece on TVC:GOLD . What are your thoughts?
MARKETSCOM:GOLD
Let us know what you think in the comments below.
Thank you.
77.3% of retail investor accounts lose money when trading CFDs with this provider. You should consider whether you understand how CFDs work and whether you can afford to take the high risk of losing your money. Past performance is not necessarily indicative of future results. The value of investments may fall as well as rise and the investor may not get back the amount initially invested. This content is not intended for nor applicable to residents of the UK. Cryptocurrency CFDs and spread bets are restricted in the UK for all retail clients.

Silver X Mining: Grinding it outThis stock is still resting, and I think waiting for Silver to make it's move to $50 first. Until then, this will continue to grind sideways to lower. There's a lot to clear first.

Huge Moves Coming for Silver MinersNYSE:PAAS has some of the best structure I've seen in any of the miners, along with NYSE:AG and $FSM. July 2024 was the beginning of a rising, complex correction. Price could always reject off the top of the channel and pull back to $26, but any dip here is a buying opportunity. We are headed for far higher prices going forward based on this structure.
The impulsive bullish waves in 2024 are clear.
The rising corrective pattern is mega bullish for the next wave.
I believe we are already in the next wave.
If this thing breaks above $30, it will fly.
I am taking no profits until we hit $55-60.

Is gold (XAUUSD) building up for a possible push higher?With the economic data sets, which we are getting and will be getting this week, all eyes on gold, and its possible move to the all-time high. Apart from this, the geopolitical tensions are also something that is fueling gold demand. But what are the technical saying? Let's take a look.
TVC:GOLD
FX_IDC:XAUUSD
Let us know what you think in the comments below.
Thank you.
77.3% of retail investor accounts lose money when trading CFDs with this provider. You should consider whether you understand how CFDs work and whether you can afford to take the high risk of losing your money. Past performance is not necessarily indicative of future results. The value of investments may fall as well as rise and the investor may not get back the amount initially invested. This content is not intended for nor applicable to residents of the UK. Cryptocurrency CFDs and spread bets are restricted in the UK for all retail clients.

Zac will explode WHEN above 10 cents. If silver explodes above $40 dollars, Zac should explode above 10 cents. If so, 28 cents can be reached.

Everybody loves Gold Part 3Gold strategy proving functional and reliable thus far.
Everybody loves Gold Part 3 takes a heavy bias towards the down side; all be it following the predicted price as highlighted.
As always price action determines trades.

Platinum's Quiet Ascent: What Drives Its New Value?Platinum, often operating in the shadow of gold, has recently experienced a significant surge in value, reaching multi-year highs and capturing considerable investor attention. This resurgence is not arbitrary; it stems from a complex interplay of industrial demand, tightening supply, evolving geopolitical dynamics, and a notable shift in investment sentiment. Understanding these underlying forces becomes crucial for investors seeking to decipher the trajectory of this vital industrial precious metal.
A primary catalyst for platinum's price rally is its strong industrial utility, particularly within the automotive sector, where it remains indispensable for catalytic converters. While the rise of battery electric vehicles presents a long-term shift, the robust growth in hybrid vehicle production continues to sustain demand. Critically, the market faces persistent physical deficits, with supply consistently falling short of demand for the past two years, a trend projected to continue into 2025. Mine output struggles due to disruptions in key producing regions, such as South Africa and Zimbabwe, and secondary supply from recycling has proven insufficient to bridge the growing gap.
Geopolitics and strategic investment further amplify platinum's upward trajectory. China has emerged as a pivotal market, with a sharp rebound in demand as consumers increasingly favor platinum for both jewelry and investment amidst record gold prices. This strategic pivot by the world's largest consumer market is reshaping global platinum price discovery, supported by China's initiatives to develop new trading ecosystems and futures contracts. Concurrently, renewed investor confidence is evident in growing inflows into platinum Exchange-Traded Funds (ETFs) and robust physical buying, with anticipated lower borrowing costs also enhancing its appeal.
In essence, platinum's current rally reflects a powerful combination of tightening supply and resilient industrial demand, underscored by strategic shifts in major consumer markets and renewed investor interest. As above-ground stocks gradually deplete and the market anticipates continued deficits, platinum is poised for a sustained period of relevance, offering compelling prospects for those who recognize its multifaceted value proposition.

Ivanhoe Mines - a 50% discount opportunity !The share price of this mining monster has suffered a 50% price decline in the last 6 months.
One of the main reasons for the share price decline is the suspension of underground operations at the Kakula mine due to seismic activity. This suspension has led to a withdrawal of production and cost guidance for 2025, causing investor uncertainty and a subsequent drop in share price 1,2,3 Additionally, the company has faced challenges with its smelter, including a fire that damaged onsite generators and caused a three-month delay in commissioning. These issues, combined with power constraints and grid instability in the Democratic Republic of Congo (DRC), have contributed to a more conservative production outlook.
However there are lots of positive catalysts for Ivanhoe Mines: the upcoming rise in precious metal prices, especially the wake up of the severely undervalued PLATINUM prices.
Platreef PGM project in South Africa contains 7 million ounces of gold (0.25 gpt) and 50 million ounces of AuEq. About 90% of annual production (1 million ounces) will consist of PGMs (platinum group metals), making it the largest PGM mine in the world ! Platreef is expected to have low all-in production costs, though more precise figures will become available after the ramp-up phase, scheduled for the second half of 2025.
Platreef PGM, Kakula-Kamoa (massive copper mine, the largest high grade mine globally) and Kipushi (a high-grade zinc operation); With all three of their mines expected to be in production, 2025 could be a pivotal year for them.
Chart wise, the price is still rising in a long term rising wedge. Price just found support on the lower resistance and is bouncing strongly. OBV on balance volume is still on a steady rise. I own Ivanhoe Mines since I got in at sub 1$ (thanks to Rick Rule's reccomandation - God may bless him). and I am not willing to let go before we reach 50$, which is my long term target.

GOLD - Buy the dips toward the 50% / 61% retracement...the decline from the 22nd of April is in a very clear 3 waves with a perfect 100% retracement. the subsequent rally from the 15th of May is in a clear motive sequence. negative RSI divergence signals that some sort of 5th wave is complete.
the characteristics of this motive rally seems like a wave (i) of V is complete and we are now looking for a drop to complete wave (ii) of V.
buying dips toward the 50% / 61% retracement is my preferred strategy for now.
a rally and daily close above 3400 would invalidate this analysis. keep in mind possible volatility due to upcoming event risk.

Wheaton precious Metals can push on to $90It could be a HOT summer for the gold and silver bugs
And the speculators in the mining sector!
WPM ( formerly Silver Wheaton #SLW)
Has a broken out of a inverse head and shoulders
Two targets provided
Also important to note this inv head and shoulders is a continuation pattern not a bottom pattern.

A break above $5500 would be huge. If this breaks above $5500 by 2030, the sky is the limit. Lots of key horizontal lines to reach above!
XPD/Palladium Profit Raid: Steal Gains with This Blueprint!🔥 Chart Heist Blueprint: Snag Profits in XPD/Palladium! 🚀💰
Crafted for sharp traders ready to raid the XPD/Palladium market, this sleek strategy fuses razor-sharp technicals with savvy fundamentals to maximize your gains. 📊🕵️♂️ Surf the bullish surge, but watch for traps in the White Moving Average Zone where bears could strike! 🐻 Lock in your loot before the tide turns. 🌊
- 🎯 **Entry Tactics: Hit the Sweet Spot**
- Long on pullbacks near 1020.00 or the Market Makers Zone at 980.00. 🏹
- Set alerts for breakouts or pullbacks to strike in real-time. 🔔
- 🛡️ **Stop Loss Hacks: Guard Your Gains**
- Place stops below the nearest 4-hour swing low or candle wick. 🔧
- Tailor stops to your risk and lot size—precision over recklessness! ⚡
- 💸 **Profit Goals: Cash In Big**
- Bullish traders aim for 1070.00 or exit early if momentum dips. 📈
- Scalpers focus on long-side quick wins, trailing stops behind big players. 🚀
- 📡 **Market Edge: Why This Plan Wins**
- XPD/Palladium is charging bullish, driven by COT data, macro shifts, sentiment outlook, and intermarket flows. 🔍
- Check the linkss for deeper insights. 🌐
- ⚠️ **News Alert: Dodge the Chaos**
- Skip new trades during major news releases. 📰
- Use trailing stops to secure profits on active trades. 🔒
- 🤝 **Join the Profit Crew**
- Boost this plan, share the vibe, and let’s raid the markets together! 🤑
- Stay sharp for the next big score in the XPD/Palladium heist! 💥
Happy trading, chart bandits! 🎭📉

Is this a platinum breakout?Using a weekly chart of a platinum ETF.
Breaking out above it's triangle pattern. Needs confirmation though or retrace in the next coming months
