Gold H4 - Long SetupGOLD H4
We posted this yesterday thinking we may have seen a reversal at that 1810-1805 region which ties in nicely with our pullbacks (FIB) and S/R trading zone.
This unfortunately broke and the next point of support was out $1800/oz psychological support, we also have lower timeframe support and H4 demand. So another confluence stack.
We have broken back above that 1810 S/R price and looking for trading price of 1827 (monthly key level) and then respectively 1840 (H4 S/R).
Preciousmetals

XAUUSD - KOG REPORT!In last weeks KOG Report we said we were in long holding positions from below. We suggested we would like to see another attempt on the lower support regions which the 4H and 12H charts were suggesting due the potential double tops. We said we had higher levels of 1817 and 1824 which we would be our immediate targets and this is where we would reduce our long exposure only holding a portion of any long trades we had from below. We said we would be looking for the higher price regions of 1830-35 and above that 1850-55 for our short entries. The lower support levels held which we had shown on the charts and it gave traders a good opportunity to long the market into our immediate targets which were both completed by market close.
A great end to the year for KOG members.
So what can we expect in the week ahead?
We would like to see Gold get some more buyers in a little higher so we are anticipating a challenge around the 1830-35 price region. We can expect this to either open with aggressive bullish momentum to target that area straight away, find resistance and make a move down, or ideally come down towards the lower support levels and then begin another incline to target that level. Please note, breaking this level will push the price to more gains potentially targeting that higher trend line resistance and key area of 1850-55 where we hope to see resistance again.
Our plan:
If the market opens and targets that higher resistance level of 1830-35 we’ll be looking to short it back down towards the lower support regions of 1815-10 as the first initial target and below that 1800-1797. We have a target at 1785 so we would like to see this achieved at some point during the week. We also have a higher target of 1833 so there is a chance we open, hit that level and then take a small decline from around that region to the lower support levels then push back up. What we want to see is how the price reacts at the higher resistance levels and how they hold as we think these resistance levels would be good opportunities to test the short trades. The higher resistance level is 1850-55 (potentially just short of this region), this level we feel could be a possibility so play it safe.
We are still bearish on this as long as its creating lower highs so for us to go long again we would need to see the extreme lower levels acting as support to take the trades. Rather we would like to see these higher level achieved and test the short trades to hold for the longer term. This is Gold, so you know it won't make it easy, thats why lots sizes and money management are really important.
Support levels:
1824
1820
1810-12
and below that 1800-1797.
Resistance levels:
1830-35
1838
1845-7
1850-55
1866-70
Yearly timeframe:
We have added the yearly chart to show the closing candle for the year. You can see that it failed to close above last years closing price where it rejected. It also shows the potential range for the months ahead going into 2022 where the lower support stands at around the 1670 price point. If you’ve been following our analyses you’ll know we have a target lower than that so based on the higher timeframe, its looking like we could be in for a few bearish months on Gold.
Monthly Timeframe:
We’ve published this chart before and we’ll stick to the plan on this. We’re looking for the lows below the 1600 price point as long as the price stays below the 1885-95 price point. There is a chance they can drive the price upwards towards that level which will still maintain the structure and still give us a lower low. This is a long term timeframe so can take months to play out, that’s if they even take it there. This is published for reference only to give you an idea of what we’re looking at.
In all honesty this is going to be a difficult one to predict, it’s the opening of a new yearly candle and we’ll see the return of volume back into the markets after the festive period. We’ve seen the markets open in the new year with some very aggressive movement so please be careful, movement that looks out of the ordinary please stay out of it, wait for the price to settle and then look to take your positions. If you really want to see what can happen take a look at the opening few days of the markets last year.
As always, trade safe.
KOG

Technical analysis update: Gold (21st December 2021)During the summer 2021 we expressed our belief that gold would end up trading within the range between 1750 USD/oz. and 1835 USD/oz. for an indefinite amount of time. We also noted that the bullish trend of higher degree was weakening and becoming neutral. Currently, gold trades slightly below 1800 USD/oz. Despite gold's sideways moving price action we continue to maintain a bullish view on gold, especially in the long-term. We expect an eventual bullish breakout from the neutral zone; and, at the same time, we assume such breakout will coincide with resumption of the bullish trend of higher degree. Additionally, we think this resumption of uptend will culminate in a new all time high for gold in 2022. Our view is supported by a combination of fundamental and technical factors.Main bullish drivers for gold are persistent high inflation in the U.S. and decrease in quantitative easing program (by the FED) which poses substantial threat to further rise in the general stock market. Additionally, we think the FED will be unable to raise interest rates three times in 2022. Instead, we expect the FED to backpedal on its current plans (as it did in its latest hiking cycle between 2015-2018).
Illustration 1.01
Illustration above shows the daily chart of XAUUSD. It also shows 20-day Simple Moving Average (blue) and 50-day SMA (red). Many false crossovers are observable which is indicative of the neutral trend.
Technical analysis - daily time frame
MACD remains in the bearish area. However, it points to the upside. We will observe it closely in the following days and we will watch out for bullish crossover above 0 points. We expect such a phenomenon to be accompanied by further rise in price. Stochastic oscillates in the upper area which is bullish but it currently points to the downside. RSI started to rise recently which is bullish. DM+ and DM- show bearish conditions. Though ADX remains relatively low.
Illustration 1.02
Illustration above shows the daily chart ADX based on XAUUSD. It shows relatively low value which suggests the prevailing trend is neutral.
Technical analysis - weekly time frame
MACD, RSI and Stochastic are all neutral. DM+ and DM- show bearish conditions but ADX contains low value.
Support and resistance
Closest support of tremendous importance sits at 1750 USD and breakout below this price level would force us to reassess our bullish notion. Next important support lies at 1721 USD while the major support level lies at 1676 USD. Closest resistance of high importance sits at 1835 USD. Other important resistance levels are at 1916 USD, 1959 USD, and 1965 USD. Major resistance level lies at an all time high of 2075 USD.
Illustration 1.03
Picture above shows the daily graph of XAUUSD. It depicts two alternative scenarios that current gold's setup allows.
DISCLAIMER: This analysis is not intended to encourage any buying or selling of any particular securities. Furthermore, it should not serve as basis for taking any trade action by individual investor. Your own due dilligence is highly advised before entering trade.

DJI/GDX appears to be nearing completion of a top.The GDX, which is an ETF comprised of precious metals mining shares appears to be topping with a head and shoulders pattern when compared to the DOW. Basically when this ratio reduces the GDX becomes more valuable when compared to the DOW Jones Industrial average and broader stock market. This ratio appears to be trapped in the undervalued zone (for the GDX) and has been there for the last 8 years.
We are still in a time with good buying opportunities for gold and silver miners, as the GDX is cheap when compared to the broader stock market.
Sooner or later this ratio will break down lower. When it does what would you rather own? General stocks or gold mining stocks?

Gold: Weekly Forecast 2nd January 2022Gold rose for the 3rd week since it took off from the demand level at 1768.
As the price reaches a key resistance at 1829, little resistance is seen and thus could extend the rally going into the coming week.
The gold is expected to continue rising through the vacuumed area from the current 1829 to the key supply level at 1850.
This week, we will wait for a pullback towards 1818 to buy again and aim for the top of the entire symmetrical triangle, as well as the key supply level at 1850.
However, we also see a good chance of pulling deeper towards 1805 should the current trend continues to follow its whippy structure.
P.S. Give a thumbs up if you like our idea:)
Do follow us as we will be providing daily trading ideas as a continuation to our weekly forecast. Cheers!

Gold Short SHORT termDon't forget to click the follow button for more daily detailed analysis.
Here we have our GOLD chart.
On the latest rally we are looking short intraday. NOTE this means in the near future we expect a fall. Price CAN and will rise higher but we are trading it short term EARLY and can add positions as price moves further up.
Price arrows NOTE direction.

XAUUSD New planDon't forget to click the follow button for more daily detailed analysis,
After hitting our recent targets we can look for the following price movement on GOLD. We got a smasher move due to market sentiment today...
We are looking for a dip back at the current comfortable resistance before any further move.
See directional arrows and fractals.

XAUUSD Moving into short zonesDon't forget to click on the follow button for more daily detailed analysis, also if you have any questions please do ask them.
Here we have our GOLD chart.
We are now looking short after hitting our long targets and exiting. Price action is showing us a SHORT zone.
Target is shown by directional arrows. Still room to move so VARY position sizes.

DXYThis is only my theory I think DXY looks really weak on HTF meaning weekly & monthly. But I cant rule out the $97-$99 move can still be baking in the oven. Being that DXY has been so strong the sentiment points my analysis this way, but also unemotionally speaking this would be max pain. But for now there are big sellers of the dollar on daily TF and we should at least hit $95.50 to finish Wave C down

Silver ready to run?Give a like and follow!
XAGUSD had a perfect bounce last week off it's late September low.
Possible double bottom formation.
RSI divergence on the Daily bar immediately before the dip and bounce.
MACD has just turned.
Looking at the 0.382 Fib level around 24.7 as target, with potential for a runner above 26 towards the 0.618 Fib level.

GOLD up and downFor more daily detailed analysis, don’t forget to click on the follow button. Also, please ask any questions you may have and I will be happy to answer them.
GOLD still remains a short after the current rally from market sentiment.
The fall is now back to Comfortable resistance and our Key MA’s.

10 yrNotice the BTC orange line is almost exactly the same as US10 yr rates, so rates up BTC & stock markets up rates down BTC & stock markets down.. recently dumping rates 1.34% needs to hold or things in the stock market & crypto markets could get ugly.

XAUUSD and some great support
For more daily detailed analysis, don’t forget to click on the follow button. Also, please ask any questions you may have and I will be happy to answer them.
This safe haven asset has seen a rally upwards as of late.
We are now looking short back down to comfortable support and our TECH areas.

Technical analysis update: XAUUSD (16th December 2021)Gold responded pretty well to yesterday's FOMC meeting. It soared from as low as 1753 USD yesterday to as high as 1798 USD today. We continue to maintain a bullish view on gold as we expect the tightening cycle (with presence of high inflation) to be very bullish for gold. Additionally, we expect gold to break above the resistance level at 1835 USD. We expect this breakout to be accompanied by resumption of the uptrend that will culminate in a new all-time high for gold in 2022.
Technical analysis - daily time frame
RSI started to grow slightly (after a long period of sideways moving action) which is bullish. Stochastic is also bullish. MACD tries to reverse its direction to the upside. DM+ and DM- are due to perform a bullish crossover in the following days. ADX remains low which suggests that the prevailing trend remains neutral.
Final note - daily time frame
Overall, no trend is present. Price remains stuck between 1750 USD and 1835 USD. We continue to await a bullish breakout above the 1835 USD price tag followed by subsequent resumption of the bullish trend.
Technical analysis - weekly time frame
RSI and Stochastic are neutral. MACD remains in the bearish area; however, it needs to be observed closely in the following weeks as we expect it to perform a bullish crossover above 0 points. DM+ and DM- continue to show bearish condition. Though, ADX is very low which suggests no trend is present.
Final note - weekly time frame
Weekly time frame shows similar conditions as the daily time frame. No trend is present and price remains stuck between the support level at 1750 USD and the resistance level at 1835 USD.
Support and resistance
Short-term resistance sits at 1835 USD while short-term support sits at 1750 USD. Other resistance levels sit at 1877 USD, at 1916 USD, and then at 1965 USD. Another important support level can be found at 1676 USD.
DISCLAIMER: This analysis is not intended to encourage any buying or selling of any particular securities. Furthermore, it should not serve as basis for taking any trade action by individual investor. Your own due dilligence is highly advised before entering trade.

XAUUSD with a gold rush..For more daily detailed analysis, don’t forget to click on the follow button. Also, please ask any questions you may have and I will be happy to answer them.
Looking at this safe haven asset, we have seen a huge rally in the last 18 hours. On this rally, we can short at the previous highs.
This is because it fits out TECH plan. We shall then go onto inputting accurate RM.
sentiment has heavily affected this asset as of late and is likely to continue to do so in the near future.

Silver Still Bullish into end of year Hey guys, this is follow up to my US100 call today linked below, I see silver falling to the support line making a big double bottom supported by strength coming back into the RSI causing a strong bull run into the new year come after. December has always been a great time to be invested in precious metals often coinciding with strong rallies, I think most people understand that the fed is behind on tapering and will speed up but I doubt they will sped up enough on there policies so maybe this could be a reason for a flock to precious metals as a flight to safety for next year. First target is 10.7% away from the support line where we have had previous support and resistance and by the time we get there the 150 EMA will Also be there acting as resistance. But I stress wait for Gold to confirm this trend and watch the gold/silver ratio seems to be topping so silver will outperform gold here.
follow for the follow up charts coming throughout the week on where i will cover another play i have on AUD/JPY, AUD/USD, stock buys and further breakdown on possible big short early next year.

Everyone likes a safe haven...For more daily detailed analysis, don’t forget to click on the follow button. Also, please ask any questions you may have and I will be happy to answer them.
Recently, we have taken plenty of gains on the XAUUSD and its sideways movement.
Currently, this movement is heavily sentiment dependant. As we know, investors rush to safe havens like precious metals in uncertain times.
There is much larger room to the upside and we are long technically with our exit at the directional arrows.
Our bias comes from the long zone drawn by the eclipse symbol around key price action areas.

Vox Wave CountEWT is a handy tool to give some context of where a share price is within a certain structure. Fundamentals will always win out over Technical Analysis and with good fortune, the fundamentals for Vox Royalty Corp will exponentially improve.
Cross-currents are keeping industrial metals tightly bound to a narrow trading range. Of course, peak reflation is in the rearview, but the lagged impact of Chinese deleveraging will soon join forces with a US fiscal drag, which could weigh on commodity demand growth into 2022. While China's Central Economic Work Conference reiterated its objectives of "stability", opening the door to more growth-supportive policies in the short-term,
we expect an only slightly easier fiscal stance, while credit growth has also likely bottomed but is unlikely to rise substantially. Notwithstanding, rising metals supply risks are insulating base metals for the time being, particularly as surging power prices in Europe once again support the market. While a substantial increase in LME aluminium stockpiles has eroded signals of scarcity in the term structure, aluminium and zinc are particularly prone to risks associated with power shortages, particularly in winter months and as Chinese officials seek clean skies ahead of Beijing 2022. Copper prices have remained supported despite waning demand, as disruptions to transportation and logistics keep metal stranded overseas at ports, inhibiting trade. Nickel faces further supply risks from Indonesian policy, but concerns are waning as a sizable plant delivered on its pledge to produce nickel matte.
Precious metals participants remain on the sidelines ahead of the Fed meeting which is set to announce a more aggressive tapering schedule, affording the central bank with optionality to embark on a hiking cycle as early as May 2022. Chair Powell will also likely reiterate a different hurdle for hikes, but the market will link hikes to the end of quantitative easing. Our rates strategists also note that the dot plot could be market moving, if the median 2022 dot shows more than 2 hikes. Certainly, while the above suggests a hawkish tone from the Fed, the market is already pricing the first hike in May 2022, which leaves a balance of risks tilted towards the upside for the near-term precious metals outlook, particularly as our macro strategists expect enough slowing in inflation and growth to delay rate the start of the hiking cycle. And, while precious metals have underperformed against historical analogs, in contrast to other markets for inflation-protection such as breakevens, it is worth highlighting that inflation breakevens may have been supported by inflation risk premium, without a commensurate rise in inflation expectations. The liquidity premium in TIPS could overwhelmingly be driving the price action in breakevens markets, potentially pointing to price distortions driven by quantitative easing. In this context, a reversal in liquidity premium driven by tapering could also catalyze a change in sentiment across precious metals, particularly as its impact ripples through into market pricing for Fed hikes.
When we have the Fed out of the way and the Omicron virus has been fully tested with regards to the current vaccines that are available we should return to some market normalisation.

Technical analysis update: XAUUSD (7th December 2021)Gold remains stuck in the neutral zone between 1750 USD and 1835 USD. Its trend continues to be neutral. Several fake breakouts above or below the neutral zone took place, however, a new trend failed to be established. We await the FOMC on 14th and 15th December 2021 as it will provide more insight into FED's next actions. Despite gold's neutral trend we remain bullish on gold in the long-term. Our view is supported by persistent high inflation and other fundamental as well as technical factors.
Technical analysis - daily time frame
Stochastic oscillates in the bearish area. However, it changed its direction to the upside. MACD is bearish, although it started to show first signs of attempting to reverse its direction. RSI is neutral. DM+ and DM- show bearish conditions, however, ADX suggests no trend is present. Overall, technical indicators on daily time frame suggest that no trend is prevailing in gold right now. This is reflected in its sideways moving price action.
Rectangle formation:
Rectangle area is shown in yellow background. False breakouts are indicated by white arrows and text.
Technical analysis - weekly time frame
Stochastic is bearish. RSI is neutral. MACD appears near 0 points and it needs to be observed closely for potential strength to stay in the bullish area (above 0 points). DM+ and DM- show bearish conditions, however, ADX contains low value which suggests that no trend is present (which coincides with ADX on daily time frame).
Support and resistance
Short-term support is at 1750 USD while short-term resistance is at 1835 USD. Resistance 1 is at 1877 USD, Resistance 2 is at 1916 USD, and Resistance 3 is at 1959 USD. Major resistance level is at 2075 USD while the major support level lies at 1676 USD.
DISCLAIMER: This analysis is not intended to encourage any buying or selling of any particular securities. Furthermore, it should not serve as basis for taking any trade action by individual investor. Your own due dilligence is highly advised before entering trade.

RHIM LongPlatinum will increase in value so their books I'm sure will look better as a result too.
Technical approve!
I've highlighted resistance/support with the colourful bubbles.

Silver possible +10% upside Hey guys, Silver looks to be bottoming out at this $22-22.3 range with a lot of wicks showing strong buying pressure. We have a previous support line there and a Fib retracement line there acting as strong support with a consolidation flag on the 1 hour time frame shown below developing a reversal trade setup. With the RSI showing buyers momentum increasing I believe we brake out of that pattern, which means this channel pattern on the daily will play out. The first leg reaching $24.5-24.6 where again we have a previous support line, 150 day MA and a Fib line acting a resistance and could bring a pull back before we resume past this point and push to the top of the channel. For now I'm only targeting this $24.6 price until we get closer to the further targets.
1.6% risk for a 9.5-10% reward
I'm going to be buying warrants to make it around 40% profit to a 7% lose there abouts

GOLD IS SET TO MOVE LOWERHello traders & investors!
We have nice setup for Gold. On daily it was rejected at important daily supply zone. Now we are stuck in little range and we can expect some sideways action.
Once we start breaking lower, it should be a vicious move.
My targets are $1676.91 & $1611.34 . Personally I am not trading it, will look for good places to add bullion at blueish ractangle.
That's it, very simple concept :)
This is not a financial advice. Until the next one!

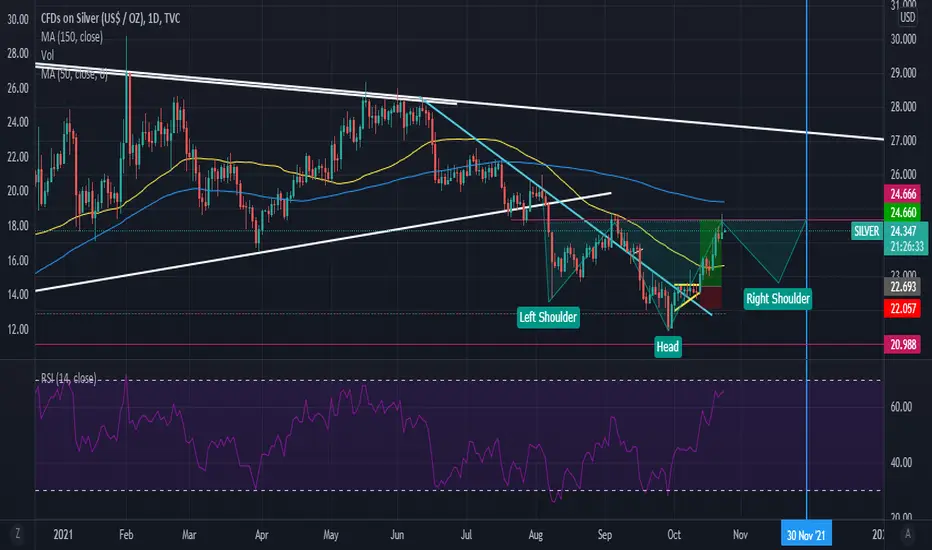
Silver Will have one more leg down before exploding higher
Hey guys, Silver recently broke its big down trend and is starting to look like it will start bulling hard. But If you have looked back in the past 9 years silver seems to have some strong seasonality bulling around the end of November to start of December period so I believe we will see some weakness over the next two weeks build the rest of this possible head and shoulders before the bull run starts. Also backing this is my view on the US100 will fall after earnings and Silver and the US100 track quite well at times and when the Us100 declines silver either leads and is a great signal for shorts or follows I touch on this on my first short against the US100.