VOX Royalty - Gold revenueVox Royalty Corp (CVE:VOX) (OTCMKTS:VOXCF) has noted that its royalty partner Thor Explorations Ltd (CVE:THX) (LON:THX) (OTCMKTS:THXPF) (FRA:T2X) has begun commissioning its gold processing plant at the Segilola gold project in Nigeria and will pour the first gold bar there before the end of the month.
Vox Royalty, which has a 1.5% net smelter return (NSR) royalty on all products mined from the property, estimates it will receive pre-tax royalty revenues of C$4.4 million within the first two full years of production.
"Based on production guidance from Thor, we expect that this royalty has the potential to generate revenue almost five times Vox's initial investment of C$900,000 within a span of three years,” Vox Royalty executive vice president of corporate development Simon Cooper said in a statement.
Preciousmetals

Gold Daily Chart Lacks Clear DirectionWe have added a triple moving average system to determine the trendiness of XAUUSD. Green>orange>red is regarded as a bullish formation. When this is achieved with angle and separation (blue arrows) a price uptrend typically ensues. Current price action lacks clear direction in this regard. We note that the short-term green moving average has turned down. If green<orange<red develops this will be considered a bearish development for the precious metal.

The June CPI, South Africa, And Another Trial In Precious MetalsGold was sitting around the $1825 on Friday, July 16. Silver was over $26, platinum was near the $1140 level, and palladium was around $2700 per ounce. All four of the precious metals that trade on the COMEX and NYMEX divisions of the Chicago Mercantile Exchange have been trending higher over the past years. Gold and palladium reached all-time highs over the past year.
The June CPI comes in on fire
The inflation data is not a validation of “transitory”
Passing a bullish baton from one sector to the next
South Africa is on fire- Precious metals supplies could decline- Another trial begins this week
The next leg up for gold, silver, platinum, palladium and other PGMs could be on the horizon
Precious metals tend to rise in inflationary environments as the economic condition erodes money’s purchasing power. The tidal wave of central bank liquidity and tsunami of government stimulus has increased the money supply exponentially over the past year. Rising money supply weighs on fiat currency values. While all four of the precious metals are below their highs for 2021 and over the past years, the path of least resistance for prices on a long-term basis remains higher.
When it comes to gold, every substantial price dip has been a buying opportunity over the past two decades. The current environment suggests that it will continue. Moreover, the recent events in South Africa, a leading gold and platinum group metals producer, could put additional upward pressure on prices.
The June CPI comes in on fire
The June Consumer Price Index rose for the third consecutive month posting a 5.4% increase in June. Excluding food and energy, it was 4.5% higher, the most substantial gain since September 1991. While the Fed and other analysts blamed one-third of the rise on used car and truck prices, any consumer knows prices are rapidly rising. The Fed continues to view the data as “transitory.”
The market’s reaction continues to be another indication that the central bank will roll out plans to taper quantitative easing and schedule liftoff from the zero percent short-term Fed Funds rate. However, one factor may make any move by the central bank moot.
The inflation data is not a validation of “transitory”
The Fed Chairman and the Secretary of the Treasury believe that inflationary pressures are “transitory,” blaming the data on pandemic-inspired bottlenecks in the supply chain. However, with Congress discussing another $3.5 trillion in spending, even if the Fed tightens credit, the government’s stimulus tsunami continues to flood the financial system.
The CPI data and rising retail prices are the price tag for the stimulus and tidal wave of central bank liquidity that began over one year ago.
Passing a bullish baton from one sector to the next
We have seen inflationary pressures rise in markets across all asset classes. The economic condition erodes money’s purchasing power. The stock market has risen to all-time highs. We witnessed parabolic moves in cryptocurrencies earlier this year. While Bitcoin, Ethereum, and many other cryptos halved in value from the April and May highs, they remain far higher than at the end of 2020 and many times the price levels at the 2020 lows. In commodities, gold rose to a record high in August 2020. While the yellow metal corrected, it continues to consolidate at above the $1800 per ounce level at the end of last week. Silver rose to its highest level since 2013 when it probed above the $30 level in February before correcting. Platinum rose to its highest price since 2014 before moving lower. In May, palladium, along with lumber and copper, reached all-time highs. Rhodium, a platinum group metal that only trades in the physical market, reached almost $30,000 per ounce this year.
Grain prices rose to eight-year highs earlier this year. Sugar and coffee reached multi-year peaks. The latest sector to move to the highest level in years was energy as the nearby NYMEX crude oil futures contract traded at $76.98 per barrel on July 6, the highest price since 2014. Natural gas moved to $3.822 per MMBtu on July 6, the highest price since late 2018, with ethanol at an over seven-year high and coal prices at the highest price in a decade.
The raw materials asset class has been passing the bullish baton from sector to sector in an inflationary relay race over the past year. Bull markets rarely move in a straight line, but the trends remain bullish, reflecting the rising inflationary pressures.
South Africa is on fire- Precious metals supplies could decline- Another trial begins this week
After another attempt at a rally, precious metals sold off at the end of last week. The prospects for higher interest rates push the US dollar higher, which tends to be bearish for the precious metals. However, gold remained above $1800 per ounce, silver is over the $25.50 level, platinum was at $1100, palladium was around $2.640, and rhodium was at a midpoint of $19,100.
At the March 2020 lows, gold found a bottom at $1450.90, silver fell to $11.74, platinum reached $562, and palladium fell to $1449.90 per ounce. Rhodium declined to $2000 per ounce.
South Africa remains a leading producer of platinum group metals. 72% of annual platinum supplies come from South Africa, along with 36% of palladium, 82% of rhodium, 81% of ruthenium, and 87% of iridium. Ruthenium and iridium are other platinum group metals that trade in the physical market. While South African gold production has declined over the past year, the country still produced around 99.2 metric tons of gold in 2020.
South Africa is currently facing the worst political violence since apartheid ended 27 years ago. Violent riots and looting in the aftermath of the jailing of former President Jacob Zuma are gripping the country. Persistent poverty and the global pandemic’s toll have only exacerbated political violence and upheaval. As South Africa faces the potential for a civil war, precious metals production could suffer over the coming months and perhaps years, creating the PGM shortages and limiting gold output from the mineral-rich nation.
Meanwhile, the greener path for energy policy only supports the demand for platinum group metals. As supplies from South Africa may decline, the demand will continue to grow, putting upward pressure on prices. Rising inflation and the South African political landscape support all precious metals prices.
Meanwhile, this week, two traders accused of felony-level crimes in the precious metal markets go on trial in Chicago. Federal District Court Judge John Z. Lee will preside over the trial of John Pacillo and Edward Bases. The pair last traded for Bank of America Merrill Lynch. Mr. Bases had traded precious metals for Morgan Stanley, Deutsche Bank, Bear Stearns, and Merrill Lynch since the 1990s, while Mr. Pacillo has an equally long resume. A jury at the most recent Chicago trials of two Deutsche Bank traders, John Vorley and Cedric Chanu, returned guilty verdicts. Both were sentenced to one year in prison. Bases and Pacillo pleaded not guilty to the charges. A jury of their peers will decide their fate this week. More traders, including three from JP Morgan Chase, await their days in court.
While the trials and sentences will not impact precious metals prices, trader’s behavior will change as a prison cell, and lifelong branding as a felon is a far cry from the comforts of a trading room. I ran one of the leading precious metals dealing desks in the 1980s and 1990s and know some of those charged, including Mr. Bases. I will save any comments for after the accused have their days in court.
The next leg up for gold, silver, platinum, palladium, and other PGMs could be on the horizon
Platinum group metals suffer from illiquidity on the futures exchange. The lack of visible stockpiles and the supply versus demand equations in the PGMs does not allow for robust futures or forward markets. Less liquid commodities tend to experience far higher volatility levels. Lumber is one of the least liquid futures markets. The price of wood from the $251.50 level in April 2020 to $1711.20 one year later in May 2021. At the end of last week, the price was below $550. Traders call markets like lumber roach motels as market participants can get into long or short risk positions but getting out when the market moves in the opposite directions can be more than a challenge. Platinum and palladium futures quality as roach motels.
Meanwhile, increasing demand for PGMs because of the rise of environmentally friendly energy policy supports their prices. The upheaval in South Africa may only exacerbate upside price action if supplies decline. When it comes to gold, every dip over the past two decades has been a buying opportunity.
The quarterly chart highlights the bullish price action in gold and the pattern of higher lows and higher highs that began in 1999 at $252.50 per ounce. Gold may have corrected from the August 2020 $2063 high, but the price action remains in bullish mode from a long-term perspective.
Silver is a highly speculative metal that attracts herd behavior when the price begins to trend. In 2020, silver traded in an $18.175 range from low to high. So far in 2021, the trading band has been only $6.61, with silver making a marginally higher high and higher low. When precious metals embark on the next leg to the upside, silver is likely to have a magnetic pull for a herd of buyers.
Rising inflation and the political landscape in South Africa are bullish for precious metals. While the US Federal Reserve may pivot to a more hawkish monetary policy stance, government stimulus shows no sign of slowing. It may only be a matter of time before the precious metals sector takes the bullish baton in the inflationary relay race that has been underway since the 2020 bottoms.
Use the links below to sign up for free early access to new posts and register for the free Monday Night Strategy Call.
Trading advice given in this communication, if any, is based on information taken from trades and statistical services and other sources that we believe are reliable. The author does not guarantee that such information is accurate or complete and it should not be relied upon as such. Trading advice reflects the author’s good faith judgment at a specific time and is subject to change without notice. There is no guarantee that the advice the author provides will result in profitable trades. There is risk of loss in all futures and options trading. Any investment involves substantial risks, including, but not limited to, pricing volatility, inadequate liquidity, and the potential complete loss of principal. This article does not in any way constitute an offer or solicitation of an offer to buy or sell any investment, security, or commodity discussed herein, or any security in any jurisdiction in which such an offer would be unlawful under the securities laws of such jurisdiction.

What Inflation? US Dollar Breaks Out Into a New Bull MarketThis is a momentous occasion! US Dollar just broke out into a new bull market.
Looking at the chart we can see that the Dollar index has closed above the Blue support-resistance line on July 13, 2021. This is a clear breakout. We can now expect new higher highs and higher lows for the US Dollar. Those that trade commodities and especially precious metals understand that stronger dollar will now pressure gold and silver.
The demise of the Dollar was greatly exaggerated. The inflation is also very likely not going to be an issue. Here I am referring to inflation as caused by "fear" of the unknown events (war, climate change, kakistocracy, etc.).
Inflation as related to imbalances between supply and demand may continue to be an issue.
---
How to understand price action.
It is very easy to read price action if you have a reference point. These support/resistance lines are there to help you read where the buyers and sellers are likely to make a stand.
You can also think of these indicators as moving pivot points .
MasterChartsTrading Price Action Indicators show good price levels to enter or exit a trade.
The Blue indicator line serves as a Bullish Trend setter.
If your instrument closes above the Blue line, we think about going Long (buying).
For commodities and Forex, when your trading instrument closes below the Red line, we think about Shorting (selling).
For Stocks, I prefer to use the Yellow line as my Bearish Trend setter (on Daily charts ). A stock has to close below the Yellow line first, then rally towards the Red line and top out there. This is where I would short it.

Gold: Weekly Forecast 18th July 2021The gold successfully broke out of a consolidation but faced strong rejection on the last trading day.
The break-above of 1825 should technically boost the price all the way to 1850 but it turned out to be another phrase of accumulation.
However, the gold still ended the week with a bit of gains and still managed to stay supported at the bottom of a rising channel.
Gold has a tendency to whipsaw like this before any major trend and thus we maintain our bullish view.
This week, we will observe for a continuation of support at the current price and look for another buying opportunity at the beginning of the week.
We still plan to hold our gold long up till 1850 where there will then be a stronger supply for price rejection.

GOLD futures: If the History repeats, this is our trading plan Today we will take an in-depth look at the Gold Futures chart.
On the main chart, we can see the Daily timeframe, and before starting with the analysis, we want to share the Weekly view + The similarities we are observing with the previous bull run of 2009
Current Weekly Chart
Weekly Chart 2009
Daily Chart 2009
---------------------------------------------------------------------------
With all that clear, let's start with our analysis:
General View: We observe clear similarities to the conditions prior to a bull run using 2009 as a template. The main characteristics are:
-The price makes a New ATH after a year of Draw-Down.
-After the New ATH, a massive corrective pattern happens on the edge of the previous ATH
-The Bullish movement does not start after the breakout of that pattern. We have a smaller correction on edge, and the breakout of this last one represents the beginning of a new bull run.
Also, it is important to say that we use a statistical approach. What do we mean by that? If we are right with our view, we can reach a risk-reward ratio on this setup of at least 1: 5, which means that for every dollar we are risking, we are aiming to make 5. The key concept of this is that even after failing 3 times to catch the movement and succeeding on the 4th attempt, we keep having a positive expectancy on the trade. Remember that: Profitable trading is about positive expectancy, is not about crystal balls.
Ok, so what is our trading plan?
The main idea here is waiting for the correction to be finished. We think that the consolidation will keep moving on the current area at least for 70 days (currently 40 days). The specific pattern we are looking for is a double bottom inside the correction. Here you can check some examples of what we mean by that.
Suppose we observe this pattern (main characteristic: the 2nd movement that makes the double bottom MUST NOT SURPASS THE FIRST ONE). If that happens, we will set our bullish setup above the previous local high.
We will be risking 1% of our capital. THIS IS VERY IMPORTANT. We never risk more than 1 to 2% of our capital. By doing that, you take the chances of blowing your account almost to 0. And the chances keep improving in your favor if your style is Swing Trading.
Target? The main idea here is that when Gold starts trending is not a good idea to close the setup, is better to trail it using higher highs and higher lows as references. But as we explained before, our main idea is getting at least a 1:5 Ratio.
How long can this movement take? Let's assume we are right; the previous bull run lasted for 800 days almost.
And what if this setup fails? Two options here, Either we have a stop loss, or the setup is never executed. It would be logical to observe a bearish movement towards the next support zone.
Thanks for reading; we hope this can bring more clarity to your decision-making!

XAUUSD - Long Discussion - Video. I see this recent drop in XAUUSD as a natural process for the previous break above resistance for Gold.
Time will of course always tell.
Manage risk, use stops.

Technical analysis update: XAUUSD (14th July 2021)Gold keeps rising as we correctly predicted. RSI, MACD and Stochastics remain bullish. ADX undergoes reset. We decided to change our 1850 USD medium price target to short term price target. In addition to that we would like to set new medium term price target to 1875 USD.
Thoughts from 30th June 2021:
Here we hinted at divergence between RSI and price of gold. We also noted that this would lead to reversal in price direction. Then we achieved price target of 1810 USD.
More thoughts from 11th June 2021:
Here we warned investors about higher volatility around FOMC date and possible plunge in XAUUSD.
Prior developements from 26th May 2021
Here we stated that gold started to reach overbought condition.
Disclaimer: This analysis is not intended to encourage buying or selling of any particular securities. Furthermore, it should not serve as basis for taking any trade action by individual investor. Your own due dilligence is highly advised before entering trade.

Vox Royalty - GDX,FNV,RGLD & WPMComparing 3 large precious metals royalty companies and the VanEck Vectors Gold Miners UCITS ETF (GDX), shows how the Gold miners and large-cap royalty firms have a similar relationship within the market.
Recently the price action in Vox Royalty has started to find that it too can benefit from a rising market and good news flow. In the past VOX Royalty has been a more volatile ride but steady progress towards their goal of building a portfolio and bringing value to their shareholders.
A few months ago news of Letters of Intent and Public Offerings was announced. The raising of capital was to purchase royalties and assuming completion of the transactions under LOI and a midpoint of 25 royalties acquired, the Company’s portfolio will consist of seven producing assets (an increase of 75% compared to its four producing or construction-stage assets in 2020). In addition, six of the royalty assets subject to LOIs are currently in a development stage and the remaining 16 royalty assets are in the exploration stage (based on an assumed acquisition of 25 royalties). Assuming 25 of the royalties under LOI are purchased, the Company projects that the underlying royalties are expected to generate between C$3 million and C$7 million of incremental revenue in 2023.

Vox Royalty - Strong closeGold has once again held the $1800 level and is relatively strong after the US cpi print.
Precious metals holding their head against transitory inflation and a strengthening US dollar.
Small-cap companies should lead Large caps, so I am keeping an eye on Vox Royalty who finished with a nice green candle and towards the highs of the day.
Tradigview technicals are signalling a buy, getting above the recent swing highs are key to a continuing uptrend, so I am looking for price to now stay above the daily 20 ema.

Gold: Weekly Forecast 20210711Gold has climbed for the 3rd consecutive week since it rebounded off from the neckline of a previous double bottom.
Resistance is currently seen at 1815 as gold kept getting rejected multiple times and ranged for 4 days already.
This could very well bring about another pullback based on the volume and the duration of the current bullish wave.
However, given the fact that it was able to close and stay supported at the resistance turned support level 1795, we shall adopt a more bullish view and look for buying opportunities.
We are expecting pullbacks at the beginning and will be looking to buy from 1803.
And if the gold is able to trend and break 1820, we see a potential of reaching 1860 as there won't be much resistance in between.

Technical analysis update: XAUUSD (9th July 2021)Recently we correctly predicted reversal in the downtrend of smaller degree (correction). Subsequently our price target of 1810 USD per ounce was reached. Currently, RSI, MACD and Stochastics are bullish. Our new medium term price target is 1850 USD per ounce.
Thoughts from 30th June 2021:
Here we hinted at divergence between RSI and price of gold. We also noted that this would lead to reversal in price direction.
More thoughts from 11th June 2021:
Here we warned investors about higher volatility around FOMC date and possible plunge in XAUUSD.
More thoughts from 19th May 2021:
Here we observed that gold was reaching overbought condition.
More prior developements from 16th April 2021:
Disclaimer: This analysis is not intended to encourage buying or selling of any particular securities. Furthermore, it should not serve as basis for taking any trade action by individual investor. Your own due dilligence is highly advised before entering trade.

VOX Royalty up 13% since Mid-JuneVox Royalty (CVE:VOX) has been down despite a constant news flow including, entering into binding agreements to purchase a 0.633% net smelter returns royalty and associated advance minimum royalty payments of over C$120,000 per annum on part of Gold Standard Ventures Corp's (CVE.GSV) Railroad-Pinion Gold Project, located on the prolific Carlin Trend in Elko County, Nevada, for US$1,980,000.
The price action over the last few days has been positive and is opening up the possibility of further gains as technically we're entering into higher highs and higher lows

How does Gold fit in the current macro picture?Many people think of gold as an inflation hedge, which isn't actually correct. Gold is a hedge on many other things and it has various interesting 'properties', however in the world we live in right its role is definitely isn't as clear as it used to be. Gold is a safe haven asset, but every time we get a liquidity crisis gold gets punished and the rises quickly. So why hasn't gold performed well while inflation was high, and what should we expect now?
To me gold isn't in the best spot right now. There are multiple triple/quadruple bottoms in the 1680 and 1450 areas, and the area below 1380 was never retested as gold broke out in 2019. So essentially these areas are areas of high liquidity which the market either wants to tap or truly break lower. Because all the people that bought there, can't make money and if they do it will be a rare occasion (such bottoms rarely hold forever except if they come when the market has formed a massive base after a long bear market).
Gold has tested both the monthly and yearly P and has been rejected twice. In that area we also have some horizontal resistance and the 350 DMA... So the momentum for gold isn't bullish, especially as the 2011 ATH turned back into resistance as gold failed to break and sustain above it. Until that ATH breaks cleanly, we should be cautious. Now if it manages to close above the pivots, chop for a bit between 1830 an 1920, then I think there might be some potential longs before the break of 1920.


USDWTI H4 - Long SetupUSDWTI H4 -
Extending higher with clear fresh highs set. Looking for a pullback to repeat what we have marked up and executed over the last few weeks, demand is still there, price is still on the rally. Simply looking to buy the dips effectively.
Hard to predict TP targets, typically we use the previous breakout high, but it's not always quantifiable, and with assets as volatile as WTI. It's sometimes best to forecast and be a bit more conservative with stoploss' (use larger stops).

Gold: Weekly Forecast 20210704Gold continued with its current consolidation but shown promising rebound right at the neckline of a previous double bottom.
An inside bar was also formed as it reached the week low and it followed through with a break-above, showing a stronger conviction for the bulls.
Therefore, we expect the gold to follow through with its rebound and potentially reach 1820 before facing resistance again.
Should the price failed to climb at the beginning and hovers around the current range top at 1795, we can expect a pullback towards 1765 where an inverse head and shoulder could potentially form.

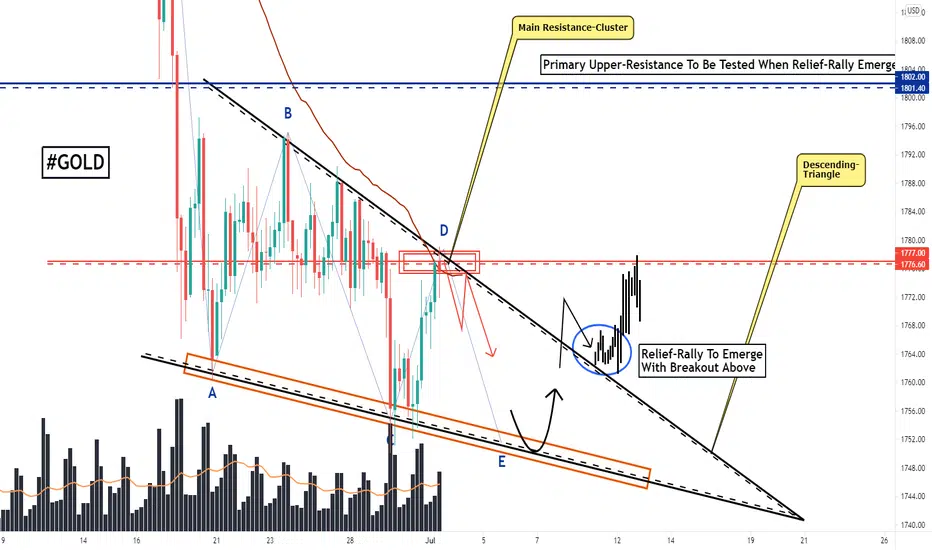
GOLD, Descending-Triangle-Formation, Preparing For Relief-Rally!Hello Traders Investors And Community,
Welcome to this analysis about GOLD, we are looking at the 4-hour timeframe perspective. In my former analysis of GOLD I already mentioned that GOLD is likely to form a relief-rally within its established structure as it moved into important support zones. Now recently GOLD made this bear-trap below the 1760 level and snapped back into the range which is an important event in the structure because it can be the source of the actual relief-rally that will emerge in the upcoming times. Now it is necessary to do not rush into set conclusions and overspeculate the market into a one-sighted direction, therefore I detected the fundamental underlying formation and what scenarios we should consider in GOLDs upcoming developments.
As when looking at my chart now we can watch there how GOLD snapped back into its previous range after forming the bear-trap below the 1760 level. This resulted in an initial rally that did not yet had the ability to convert into a full reversal and is now running directly into this dedicated resistance-cluster that is marked in red in my chart where several resistances coming together consisting of the upper-boundary of the formation, the horizontal resistance in red and also the 35-EMA in red. All these resistances in the resistance-cluster indicate the wave E in the major wave-count to emerge from this point, this wave E will complete the whole ABCDE-wave-count and will approach the dynamic-support-zone marked in orange again.
Taking these factors into the consideration now GOLD when it continues with this decisive wave-count as it is marked in my chart ahead of the next times can complete the descending-triangle-formation when it manages to bounce in the structure and breakout above the upper-boundary of the descending triangle. Such a development will be the origin of the actual relief-rally with increased continuations and approaching of the next levels, which does not necessarily mean GOLD is already completely bullish however this relief-rally should not be expected as it can trap the bears with stop losses above the descending-triangle. And when the relief-rally shows up the upper resistance marked in blue will be tested sooner or later.
In this manner, thank you for watching my analysis about GOLD and the decisive descending-triangle-formation that has the potential to be the source of the upcoming relief-rally; will be great when you support it with a like and follow or comment, great contentment for everybody supporting, all the best!
"There are many roads to prosperity, but one must be taken."
Information is only educational and should not be used to take action in the market.
Technical analysis update: FMV (23rd June 2021)FMV has been trading within rectangle pattern for some time now. Currently, FMV has neutral trend and it oscillates between its support at 12.34 EUR and its resistance at 15.445 EUR. Neutral trend is reflected in low ADX value. Stochastics and MACD are bearish. However, RSI shows first signs of reversing to the upside. We think that mining stocks within precious metals sector are currently very cheap and attractive. We expect FMV to rise above its resistance and continue up as it coincides with our bullish forecast for gold. Because of that we would like to set medium term price target for FMV to 15.50 EUR.
Disclaimer: This analysis is not intended to encourage buying or selling of any particular securities. Furthermore, it should not serve as basis for taking any trade action by individual investor. Your own due dilligence is highly advised before entering trade.

Gold: Weekly Forecast 20210627Gold ranged throughout the week with every attempt to rebound getting wiped out over and over.
However, gold was able to stay supported and garner some bulls before the market close for the week.
We could expect the bulls to fight back again this week since the gold was able to survive multiple rejections after an extremely bearish week, and not forgetting it is still technically oversold.
So this week, we want to continue to look for buying opportunities and we probably will get one at the beginning of the market.
If the bull is able to take over the current range top at 1795, it should reach 1820 before facing another resistance.
And if the bull starts to trend, we might get a V-shaped recovery and it will quickly reach the equilibrium level at 1858.
Should the rebound this time fails and support gets broken, we might get a stronger demand at the neckline level of the previous double bottom at 1747.

VOX: another month of exciting royalty operator partner newsflowLooking to see if this positive news flow can get the share price back above June's recent swing high. Positive divergence between price and the stochastics are encouraging but confirmation is needed.
Riaan Esterhuizen, Executive Vice President – Australia stated, “Yet another month of exciting royalty operator
partner newsflow for Vox shareholders relating to discoveries, resource expansions, project financing and ESG best
practice. We are particularly excited by the exceptional Puzzle North drilling results including 60m @ 3g/t and the
Pitombeiras 221% mineral resource increase. Vox investors can look forward to a catalyst-rich H2 2021, including
maiden mineral resources for royalty-linked Puzzle North, McTavish and mining studies for Lynn Lake Nickel and
Pitombeiras.”
Summary of Exploration Updates
• Growth in Puzzle North discovery with exceptional new wide shallow intercepts by Genesis;
• Resource estimate update at Pitombeiras and 221% increase in Measured and Indicated Resources(3);
• Commencement of a modern mining study for the potential restart of mining operations at the Lynn Lake
nickel-copper-cobalt sulphide project by Corazon;
• Capital raising to fund exploration activities at the Kookynie gold project by Metalicity; and
• Partnership for Karora to become one of the world’s first net zero greenhouse gas junior gold mining
companies.
Kookynie (Pre-Feasibility) – Exceptional Growth in Puzzle North Discovery
• Vox holds a A$1/t production royalty on part of the Kookynie gold project1;
• On June 15, 2021, Genesis announced that:
o Reverse circulation drilling continues to confirm the potential to grow all key deposits which form
the Ulysses Gold Project, including the royalty-linked Puzzle North deposit;
o Puzzle North has been expanded with significant new shallow results, which are some of the most
outstanding drilling results ever reported by Genesis in the history of the Ulysses Project, including
the following drilling highlights:
▪ 60m @ 3.03g/t Au from 106m (hole 21USRC855)
▪ 84m @ 1.98g/t Au from 84m (hole 21USRC912)
▪ 40m @ 2.52g/t Au from 44m (hole 21USRC911)
o Management of Genesis commented that:
▪ “The Puzzle North discovery is developing into a significant zone of shallow gold
mineralisation that clearly has the makings of a new open pit mine.”
▪ “The recent drilling may have a significant impact on our development plan – particularly
the exciting shallow results at Puzzle North and the high-grade zone at Admiral deeps –
and we are considering the possibility of including these new elements in our Feasibility
Study.”
• Vox Management Summary: Puzzle North is shaping up to be an exciting gold discovery and operator
guidance suggests that this has the potential to be a new open pit mine, which may be included in the
upcoming Ulysses feasibility study. This exploration royalty acquired in 2020 has growing potential to
generate revenue for Vox shareholders.
Pitombeiras (PEA Stage) – 221% Increase in Measured & Indicated Resources(3)
• Vox holds a 1% net smelter royalty over the Pitombeiras vanadium-iron ore project;
• On June 16, 2021, Jangada announced an updated resource estimate(3) at Pitombeiras North and South
Targets, with the following highlights:
o 221% increase in Measured and Indicated Resources (“M&I”) based on two of eight identified
targets (see technical note 3 below for further detail):
▪ M&I Resources of 5.10Mt at 0.46% V2O5, 9.04% TiO2 and 46.06% of Fe2O3
▪ Inferred Resource of 2.33Mt at 0.41% V2O5, 8.26% TiO2 and 43.18% of Fe2O3
o Exploration potential remains open along strike and at depth - Jangada has established a target to
potentially delineate 10Mt of total mineral resources.
o Drilling programme at Goela target started in late April 2021 and is expected to be concluded by
end of June 2021
o Updated Preliminary Economic Assessment (“PEA”) to be completed in Q3 2021 following the
delivery of the updated mineral resources for both Pitombeiras and Goela, which will include new
metallurgical tests.
• Vox Management Summary: A resource increase of >200% is uncommon in the mining industry and
generally indicates strong momentum in exploration success. The updated Pitombeiras PEA in Q3
2021 will provide guidance for potential royalty revenue that could commence as early as Q1 2022,
based on prior guidance from operator Jangada. The pace of this royalty development continues to
exceed Vox management expectations.
Lynn Lake Nickel (Exploration) – Mining Studies Commence at Lynn Lake Nickel Project
• Vox holds a 2% gross revenue royalty (post initial capital recovery) on part of the Lynn Lake nickel-coppercobalt project (“Lynn Lake”);
• On May 26, 2021, Corazon announced:
o International mining consultants Palaris have been engaged to undertake mining studies for the
potential recommencement of mining operations at Lynn Lake with modern mining and processing
practices - scope of work includes:
▪ Undertaking individual bridging studies in key areas to identify a viable basis of project
design before progressing into future study phases; and
▪ Determining the favoured path forward, utilising “best-fit” mining and processing
techniques to deliver an attractive, long-life mining operation at Lynn Lake.
o Studies are expected to be completed in the following quarter and will feed into more detailed work
designed to advance the development of the Lynn Lake Project.
• Vox Management Summary: Lynn Lake was mined for 24 years until 1976 and was one of North
America’s major nickel operations, producing 206,200t nickel and 107,600t copper. Since 1976 mining
studies undertaken for a potential re-start of the mine have only considered historical mining and
processing methods. This modern mining study accelerates this royalty from exploration to early
development.
Kookynie (Advanced Exploration) – Equity Raise for Advancement of Kookynie Gold Project
• Vox holds a A$1/t ore production royalty (with gold grade escalator1
) on part of the Kookynie gold project
held by Metalicity; and
• On June 15, 2021, Metalicity announced that it has received firm commitments for a strongly supported
A$3,000,000 equity raise. The funds raised will be used to advance the Kookynie gold project, continue to
develop its maiden JORC resource estimate (including royalty-linked McTavish deposit), together with
providing working capital and funding for potential new opportunities.
• Vox Management Summary: This equity raise will fund a maiden resource estimate for the McTavish
gold deposit on Vox’s royalty tenure, which should re-rate the value of this exploration royalty.
Higginsville – Dry Creek (Producing) – Partnership to Become Net Zero Greenhouse Gas Emissions Company
• Vox holds a price-linked production royalty(2) that is equal to A$0.60/gram gold produced at current gold
prices (effective 0.85% net smelter return economics) on part of the Higginsville gold mine held by Karora;
and
• On June 14, 2021, Karora announced a new partnership with The Net Zero Company to commit to and to
implement a pathway to becoming one of the world’s first net zero junior gold mining companies, as follows:
o Karora will work with The Net Zero CompanyTM to seek to ensure its approach to setting and
achieving GHG reduction targets is inline with best practices based on available science to achieve
the aspirations of the Paris Agreement. As the program is further outlined and targets are identified,
updates will be provided to the market.
o Karora's initial focus will be on Scope 1 and 2 emissions reductions, followed by Scope 3 emissions
reductions to work toward its goal of reaching True Net Zero (Scope 1, 2 and 3) status.
o Progress on the GHG reduction program will be included in Karora's inaugural ESG Report which
is expected in early 2022.
• Vox Management Summary: This progressive partnership demonstrates Environmental, Social &
Governance (ESG) best practice by Karora management. The quality, responsibility and track record
of the Karora management team is what Vox looks for in our royalty operating partners.

Vox Royalty Exploration UpdateVox Royalty tells shareholders to look forward to a ‘catalyst-rich’ second half of 2021
www.proactiveinvestors.co.uk
Vox Royalty Corp (CVE:VOX) provided its shareholders with funding and exploration updates from five of its 50 operating partners.
The high-growth precious metals-focused royalty company noted each partner had been busy advancing their respective projects with studies, sampling and drill programs.
Highlights from the exploration update include, the expansion of the Puzzle North discovery at the Australian Ulysses project, a 221% increase in measured and indicated resource at Pitombeiras in Brazil and the commencement of a modern mining study for the potential restart of mining operations at the Lynn Lake nickel-copper-cobalt sulphide project in Canada.

Gold: Weekly Forecast 20210620Gold fell through multiple support last week and marked the biggest weekly loss in 15 months.
Almost every forms of support, from a 3-month rising channel to the equilibrium level at 1860 to all the moving averages, have been broken.
As of writing, the gold seems to have found a bit of support as it's ultimately way oversold in the short-term, and thus an opportunity to possible buy into a potential pullback.
The bigger picture, however, remains the same as inflation risk looms but the short-term sentiment is pointing towards a strong recovery in the dollar and thus demand fell for gold.
This week, we will look for signs of rebound to buy into the pullback and target 1813, where we will then look for an opportunity to sell, aiming for the neckline level at 1750.
