Gold volatility in playThe sudden drop in Gold was expected (privately shared) within a circle. But what was surprising was the immense drop, spurred by the sudden spike in the USD.
Noted that there appears to be an inverse Head adn Shoulders pattern forming, and the neckline and extension is marked in purple.
Projection for down and a fast up to 2100 in mid-October 2021 (previously September).
Watch for the bounce!
Preciousmetals

#silver squeeze, its been a long time forming, will #PMinvestors get their moment to shine and say I told you so!
Opened a speculative long position today
#AG first majestic is a premier pure silver #mining play


GOLD - Long Term VisibilityWe are witnessing a breakout of the downtrend channel that has been forming for a year now.
The setup looks similar to the one that occurred from March 2008 to December 2008

Go for Gold!Gold is looking really bullish now. Perhaps it should challenge its last year high again soon. Looking at the 10 year chart, we can clearly see a cup with handle formation that is just waiting for breakout at around $1916. Based on the depth of the cup, we could potentially see a price objective of $2700. This is definitely a good hedge for inflation. Go for gold!!
Dislaimer:
This is by no means a recommendation to buy/sell. The ideas shared here are mainly for educational purpose only. Please consult your financial advisor prior to any investment decision.

Gold: Weekly Forecast 20210613The bulls for gold are not able to make any progress and if any, they've failed to maintain bullish momentum.
Since the consolidation started at the beginning of June, gains have been swallowed constantly and highs are getting lower.
The breakout of the rising channel failed to continue and the price eventually fell all the way back to the bottom of the channel with little support towards the end of last week.
It seems that buyers are reluctant to add more position ahead of the Fed's meeting, weighing the odds of early tapering.
However, we will focus on buying since the price is still sitting well above the equilibrium level of 1858.
This week, we will be looking for buying opportunities at the opening of the market, followed by the equilibrium level at 1858.
We want to keep in mind that the global economy is currently facing a high risk of fast-rising inflation and that always work well for gold.

GOLD PRICE/VOLUME CORRELATION - GC1! - MONTHLYThank you for your likes, comments and shares! Much appreciated! This is an idea not a financial advise.
__________________________________________________________
A quick look at the some of the Gold key points. It probably will provide you an extra look on the price action.
See how the volumes have increased throughout the time. Some parabolic moves and little corrections. But, overall, the Gold price will probably continue to rise.
Some probable lower price ranges are identified and might be good entry points for a long entry. Holding long term position or dollars cost averaging.

Gold, metals and oil are definitely back and looking very strongGold was falling as real yields were going up, but now that that trend has reversed gold is looking better. Gold has successfully broken and retested many key levels + several important moving averages and pivots. In the past I thought 1680 would break even just in the short term and it is still a possibility, but looks less likely at the moment.
Currently Gold is at a bit of resistance and could pull back a little bit. The key level is 1980 where it could have a major trap and then a decent correction before going higher. Yes there are some issue with gold too, especially as it is still below its 2011 ATH, but once it starts closing above it again things could change rapidly. Metals overall seem really strong, with Silver gearing for a big breakout although there is still a chance of failure at the resistance above. Palladium still going hard and seems relentless. Copper at its 2011 ATHs still looking decent although it might pullback a little bit. Oil although not a metal, is very important and it also looks extremely explosive. The upside for oil at this point almost seems unlimited. The bear market for oil ended with that insane capitulation where prices went negative on the front month contract. For many reasons the production of oil has taken a big hit and now that demand is coming back, and coming back strong especially due to money printing. So from here Oil could easily hit 100$/barrel by EOY.
Point is that inflation is rising, commodities are rising and will potentially keep on rising mostly due to supply shortages, but also due to excess speculation and money printing. Gold might not be the best bet in this situation, but it is definitely an asset to own as insurance. Maybe the downturn in cryptocurrencies also had to do with people switching back to Gold and other assets. Maybe Gold is a signal that something bad is coming and that thing might be high inflation or even bad deflation that could bring issues to the system. Either way dips are for buying in these assets.

Gold & Silver Stocks - Bullish SetupToday's inflation figures release could be a serious catalyst for the next leg up.
The U.S. economy’s rebound from the pandemic is driving the biggest surge in inflation in nearly 13 years, with consumer prices rising in May by 5% from a year ago.
The Labor Department said last month’s increase in the consumer-price index was the largest since August 2008, when the reading rose 5.4%. The core-price index, which excludes the often-volatile categories of food and energy, jumped 3.8% in May from the year before—the largest increase for that reading since June 1992.
RSI and Stochastics are looking good; both in positive territory.

Gold Signal 300+ pips in ProfitGood day guys! I am still holding this gold trade with my three positions. Another phenomenal setup this was. I do anticipate the price going much lower, however, I have yet to see a sharp sell off. Those who took this signal, be sure to leave a comment below to share your appreciation. Also, a like will help out the traders view algorithm. We appreciate you for checking out our post and remember, we will see you on the other side.
Rodrick (CEO)
Third Eye Traders

XAUUSD the target we are aiming for. Today, we will share with you a 4hs chart on XAUUSD
- In April, we opened long positions on the precious metal, and after two months, we are close to our expected target
- As you can see, after the breakout of the descending channel, we observed a straight bullish movement with an ascending trendline as the main structure of the current situation.
- Currently, we are observing a consolidation situation on the price after breaking a key resistance zone now working as support (1850 - 1860). We expect the price to stay above that level (otherwise, we will start thinking that our view is not going as expected)
- Regarding the long-term view we have on XAUUSD. If we look at a daily chart or weekly chart, we can see that the descending channel is actually a Flag pattern of a huge impulse. And we think the bullish trend will continue in the future, making new ATH. However, we also expect a several weeks correction on the next resistance zone (where we are planning to close our entry)
- Let's finish this post with the core idea. "The Target": We will be closing 100% of our position on the Green circle, we don't want to trade exactly on the edge of the resistance zone, and we rather sacrifice some pips and gain security on the target of our position.
- It would not be crazy to observe an apparent breakout of the resistance zone, giving the impression that the price will keep going up; however, based on the study we made of previous situations like this one, we think a correction in that zone has a high probability.
Thanks for reading!


Gold: Weekly Forecast 20210606The gold closed with a bearish weekly candle for the first time in 5 weeks amid a weakening dollar due to a weaker US labour market.
The price was able to find support at the current equilibrium level and recovered quickly before the week ended.
However, it was resisted at 61.8% of the Fibo level based on the most recent bearish wave which could potentially cause another short-term sell.
This week, we could look for a selling opportunity from the current price of 1890 and target 1873 at the beginning.
But going forward, since we are still seeing support from both the equilibrium level and the bottom of the 2-month rising channel, we will continue to buy the pullback as soon as 1883, followed by 1873.

GOLDGold is trading at a key resistance. We shouldn't be surprised to see prices dropping lower from here

Gold: Weekly Forecast 20210530Gold was pretty much as bullish as expected, resulting in the biggest monthly gain in 10 months.
The gold continued to prove its value in times of uncertainty and rising inflation, coupled with falling asset prices, causing higher demand for the safe-haven assets.
We continue to see the gold pushing higher towards 1950 before any strong selling may occur.
This week, we shall continue to look for buying opportunities. Should the price pulls back at first, we can look to buy at 1880, followed by 1863.

GDX : RESET / POSITION TRADE / HEDGEDuring the last three-month trading period, the VanEck Vectors Gold Miners ETF (GDX) has generated net inflows of 731.35 million. More importantly, we can see that the greatest selling pressures emerged after the Pfizer vaccine news was released on November 9th.
This suggests that the market is simply undergoing a temporary reaction to a news event and that further downside in GDX seems unlikely because any additional vaccine announcements would probably do little to change the underlying environment.
Moving out to an even longer-term view, we can see further evidence that these assertions are accurate because the VanEck Vectors Gold Miners ETF has actually generated net inflows of 2.37 billion during the last three years.
All together, these trend divergences tell us that investors might have an opportunity to profit from recent paradigm shifts in the precious metals markets. While this short-term enthusiasm might be moderately favorable for U.S. stock benchmarks into the end of 2020, we think that the prospects for economic deterioration during the first-quarter period of 2021 might be enough to send investors right back into safe-haven assets.
Ultimately, the VanEck Vectors Gold Miners ETF provides an alternative strategy for investors that are interested in moving deeper into the precious metals sector and its expense ratio of 0.52% remains near the middle of the range for the category as a whole.
SOURCE : INCOME GENERATOR, THE INCOME MACHINE / SEEKING ALPHA
seekingalpha.com

2021-05-28 Possible Gold correction (Daily Chart)Looks like a Short Japanese pin-bar has formed on Wed the 26th of May and the RSI may look overbought.
Possibilities:
- Gold upward move continues then it could rise toward 1989,
- Go sideways between 1875-1922 support & resistance.
- Further Down Correction between 1872-1875 support & resistance.

SILVER TO RE-TEST $16-$18 DEMAND ZONE BEFORE CONTINUATION HIGHERHello investors and traders!
We should see significant drop in silver prices relatively soon. Expect 30-40% drop towards demand zone $16-$18.
Weekly support is at $18.38.
Long term investors should be looking to accumulate as much as possible in purple-ish region.
Take care! This is not financial advice.

PLGUnless this bull flag top TL does not continue to support the PA I will venture to say PLG is leaving a very long boring bear market.

DXY has been looking weak. Here's my long term chart.I'm watching the solid blue downward trendline closely. DXY looks sick; if it breaks, lookout, commodities to the moon!

#gold vs #FED #M2 ... a wall of #dollars should Push #metals UPPLENTY of ROOM to the upside measure Money stock

#gold met the upper channel, and broke I take @ #GDX #GDXJ #AG #wpm
#fsm
MINERS LOOK GREAT!!!
time to rock & roll

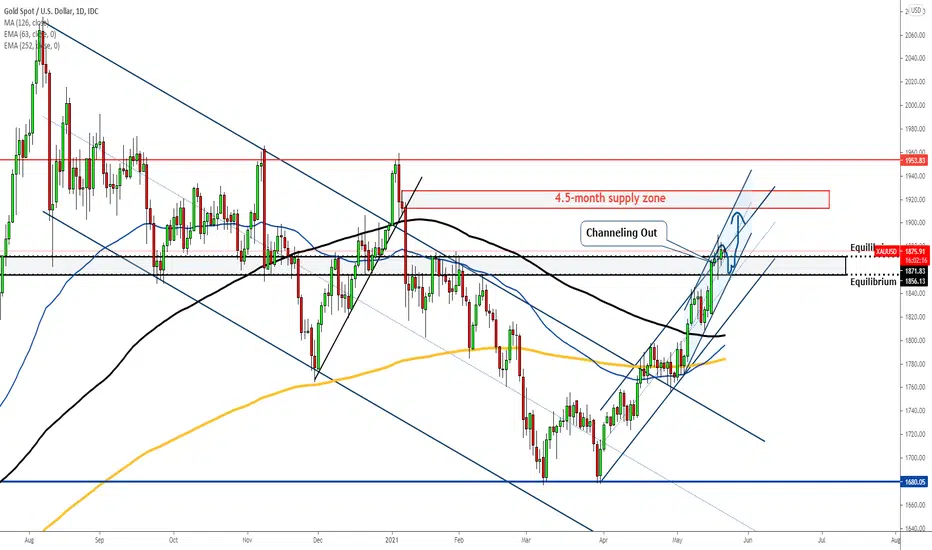
Gold Channeling Out of Another ChannelGold has been rising within a 1.5-month rising channel and the top of the channel was somewhat breached earlier this week.
However, gold struggled to make another jump as it was actually resisted at the top of another rising channel that's channeling out of the 1.5-month channel.
By now, it is obvious that the gold is currently in the process of consolidation, and based on what we've seen, it is very likely that the price will take a little dive before it shoots back up just like a person diving into the bottom of a pool and resurfaces.
We can still consider buying some on every pullback but we now target 1856 as the best price to buy.