EURUSD: Market of Sellers
Balance of buyers and sellers on the EURUSD pair, that is best felt when all the timeframes are analyzed properly is shifting in favor of the sellers, therefore is it only natural that we go short on the pair.
Disclosure: I am part of Trade Nation's Influencer program and receive a monthly fee for using their TradingView charts in my analysis.
❤️ Please, support our work with like & comment! ❤️
Prediction

Why the Bitcoin Pi Cycle Indicator will not trigger this cycleIn this post, we’ll take a closer look at the Pi Cycle Indicator and explain why we believe it is unlikely to trigger in this cycle. Instead, we present an alternative signal that may better indicate the true Bitcoin top.
Understanding the Pi Cycle Indicator
The Pi Cycle Indicator has historically been highly accurate in predicting Bitcoin cycle tops. It consists of two simple moving averages:
The 111-day simple moving average (SMA) (blue)
The 350-day simple moving average (SMA) multiplied by two (green)
A signal is generated when the 111-day SMA crosses above the multiplied 350-day SMA, which is marked by a red vertical line.
Why This Signal Alone Isn’t Enough
While this signal has been useful in the past, we believe it doesn't provide the full picture—specifically, it doesn’t indicate how strong the crossover is. By transforming this indicator into an oscillator that measures the ratio between these two moving averages, we gain a more nuanced perspective:
In the chart, the green line represents the ratio between the two moving averages. When it crosses above the red horizontal line (ratio > 1), a Pi Cycle signal occurs (marked by a red vertical line). Notably, the 2017 signal was significantly stronger than the 2021 signal, suggesting a pattern of diminishing returns. We highly recommend checking out our post on diminishing returns and the overall timeline for the current cycle here . Additionally, we've developed our own Bitcoin model that factors in the effects of diminishing returns. Check it out here .
The TRUE cycle top signal
The key question is whether this diminishing return is strong enough to prevent a signal from forming in this cycle. Based on our analysis, we believe it is.
By extrapolating this trend into the future using a white diagonal trend line, it becomes clear that the ratio will likely remain below 1, meaning no crossover is expected this cycle.
Instead, we anticipate that the next Bitcoin top will occur at a ratio of approximately 0.9 , as indicated by the orange area on the chart.
In summary, while the Pi Cycle Indicator has been a reliable tool in previous cycles, its diminishing strength suggests that it may not trigger this time. Rather than relying solely on this metric, we suggest considering looking deeper into the true value of this indicator instead.

AUDUSD: Short Signal with Entry/SL/TP
AUDUSD
- Classic bearish pattern
- Our team expects retracement
SUGGESTED TRADE:
Swing Trade
Sell AUDUSD
Entry - 0.6373
Stop - 0.6418
Take - 0.6300
Our Risk - 1%
Start protection of your profits from lower levels
Disclosure: I am part of Trade Nation's Influencer program and receive a monthly fee for using their TradingView charts in my analysis.
❤️ Please, support our work with like & comment! ❤️

CHFJPY: Bearish Forecast & Bearish Scenario
The charts are full of distraction, disturbance and are a graveyard of fear and greed which shall not cloud our judgement on the current state of affairs in the CHFJPY pair price action which suggests a high likelihood of a coming move down.
Disclosure: I am part of Trade Nation's Influencer program and receive a monthly fee for using their TradingView charts in my analysis.
❤️ Please, support our work with like & comment! ❤️

USDCHF: Expecting Bullish Continuation! Here is Why:
Looking at the chart of USDCHF right now we are seeing some interesting price action on the lower timeframes. Thus a local move up seems to be quite likely.
Disclosure: I am part of Trade Nation's Influencer program and receive a monthly fee for using their TradingView charts in my analysis.
❤️ Please, support our work with like & comment! ❤️

GOLD: Short Signal Explained
GOLD
- Classic bearish setup
- Our team expects bearish continuation
SUGGESTED TRADE:
Swing Trade
Short GOLD
Entry Point - 2996.0
Stop Loss - 3001.2
Take Profit - 2986.7
Our Risk - 1%
Start protection of your profits from lower levels
Disclosure: I am part of Trade Nation's Influencer program and receive a monthly fee for using their TradingView charts in my analysis.
❤️ Please, support our work with like & comment! ❤️

QQQ: Long Trading Opportunity
QQQ
- Classic bullish formation
- Our team expects pullback
SUGGESTED TRADE:
Swing Trade
Long QQQ
Entry - 479.69
Sl - 466.22
Tp - 508.62
Our Risk - 1%
Start protection of your profits from lower levels
Disclosure: I am part of Trade Nation's Influencer program and receive a monthly fee for using their TradingView charts in my analysis.
❤️ Please, support our work with like & comment! ❤️

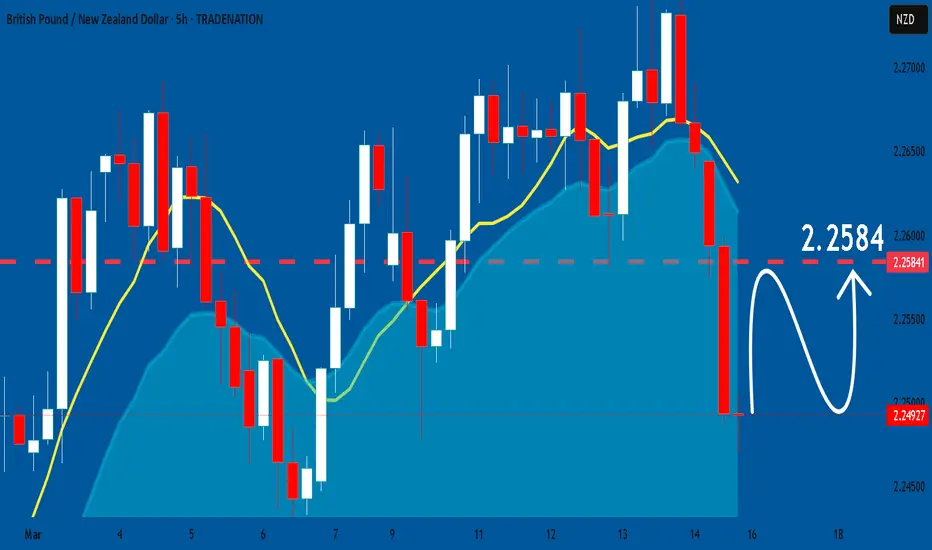
GBPNZD: Bulls Will Push Higher
Remember that we can not, and should not impose our will on the market but rather listen to its whims and make profit by following it. And thus shall be done today on the GBPNZD pair which is likely to be pushed up by the bulls so we will buy!
Disclosure: I am part of Trade Nation's Influencer program and receive a monthly fee for using their TradingView charts in my analysis.
❤️ Please, support our work with like & comment! ❤️
EURUSD: Weak Market & Bearish Forecast
The price of EURUSD will most likely collapse soon enough, due to the supply beginning to exceed demand which we can see by looking at the chart of the pair.
Disclosure: I am part of Trade Nation's Influencer program and receive a monthly fee for using their TradingView charts in my analysis.
❤️ Please, support our work with like & comment! ❤️

SPY: Long Trade Explained
SPY
- Classic bullish formation
- Our team expects pullback
SUGGESTED TRADE:
Swing Trade
Long SPY
Entry - 562.78
Sl - 550.29
Tp - 583.92
Our Risk - 1%
Start protection of your profits from lower levels
Disclosure: I am part of Trade Nation's Influencer program and receive a monthly fee for using their TradingView charts in my analysis.
❤️ Please, support our work with like & comment! ❤️

SILVER: Short Signal Explained
SILVER
- Classic bearish setup
- Our team expects bearish continuation
SUGGESTED TRADE:
Swing Trade
Short SILVER
Entry Point - 33.791
Stop Loss - 34.273
Take Profit - 32.758
Our Risk - 1%
Start protection of your profits from lower levels
Disclosure: I am part of Trade Nation's Influencer program and receive a monthly fee for using their TradingView charts in my analysis.
❤️ Please, support our work with like & comment! ❤️

APPLE: Expecting Bullish Continuation! Here is Why:
Looking at the chart of APPLE right now we are seeing some interesting price action on the lower timeframes. Thus a local move up seems to be quite likely.
Disclosure: I am part of Trade Nation's Influencer program and receive a monthly fee for using their TradingView charts in my analysis.
❤️ Please, support our work with like & comment! ❤️

USDCAD: Growth & Bullish Forecast
Remember that we can not, and should not impose our will on the market but rather listen to its whims and make profit by following it. And thus shall be done today on the USDCAD pair which is likely to be pushed up by the bulls so we will buy!
Disclosure: I am part of Trade Nation's Influencer program and receive a monthly fee for using their TradingView charts in my analysis.
❤️ Please, support our work with like & comment! ❤️

Gold (XAU/USD) 4H Chart Analysis: Resistance Test & Potential BrPrice Trend:
The chart shows a steady upward movement in the price of gold, starting from late February into March 2025. The price is currently around $2,917.25 and has reached near the resistance level marked on the chart.
Resistance Zone:
The resistance area, located between $2,911 and $2,920, seems to be a crucial level. Gold has faced difficulty breaking through this level multiple times, as seen in the sideways movement after hitting the resistance.
Target Level:
The target above this resistance zone is marked around $2,960, indicating the potential for further price appreciation if gold can break above the current resistance.
Price Action and Potential Breakout:
There's a potential for a breakout as the price appears to be forming a bullish structure near the resistance, indicating that if gold manages to break above this zone, it could continue its upward trajectory toward the target area.
Volume and Market Sentiment:
The volume indicators on the lower part of the chart are not heavily discussed here, but there might be a correlation with market strength. The chart suggests potential consolidation before a move upward if the resistance breaks.
Conclusion:
Gold is currently testing the resistance area, and if it successfully breaks through, it could aim for the target level around $2,960. Keep an eye on this price level as it could signal further bullish movement.

EURUSD: Short Trade with Entry/SL/TP
EURUSD
- Classic bearish formation
- Our team expects fall
SUGGESTED TRADE:
Swing Trade
Sell EURUSD
Entry Level - 1.0896
Sl - 1.0996
Tp - 1.0695
Our Risk - 1%
Start protection of your profits from lower levels
Disclosure: I am part of Trade Nation's Influencer program and receive a monthly fee for using their TradingView charts in my analysis.
❤️ Please, support our work with like & comment! ❤️

GBPJPY: Bearish Continuation & Short Signal
GBPJPY
- Classic bearish formation
- Our team expects pullback
SUGGESTED TRADE:
Swing Trade
Short GBPJPY
Entry - 192.49
Sl - 193.31
Tp - 191.06
Our Risk - 1%
Start protection of your profits from lower levels
Disclosure: I am part of Trade Nation's Influencer program and receive a monthly fee for using their TradingView charts in my analysis.
❤️ Please, support our work with like & comment! ❤️

NZDJPY: Expecting Bearish Movement! Here is Why:
The analysis of the NZDJPY chart clearly shows us that the pair is finally about to tank due to the rising pressure from the sellers.
Disclosure: I am part of Trade Nation's Influencer program and receive a monthly fee for using their TradingView charts in my analysis.
❤️ Please, support our work with like & comment! ❤️

GBPAUD: Bullish Forecast & Outlook
Balance of buyers and sellers on the GBPAUD pair, that is best felt when all the timeframes are analyzed properly is shifting in favor of the buyers, therefore is it only natural that we go long on the pair.
Disclosure: I am part of Trade Nation's Influencer program and receive a monthly fee for using their TradingView charts in my analysis.
❤️ Please, support our work with like & comment! ❤️

EURCHF: Short Trading Opportunity
EURCHF
- Classic bearish pattern
- Our team expects retracement
SUGGESTED TRADE:
Swing Trade
Sell EURCHF
Entry - 0.9606
Stop - 0.9661
Take - 0.9503
Our Risk - 1%
Start protection of your profits from lower levels
Disclosure: I am part of Trade Nation's Influencer program and receive a monthly fee for using their TradingView charts in my analysis.
❤️ Please, support our work with like & comment! ❤️

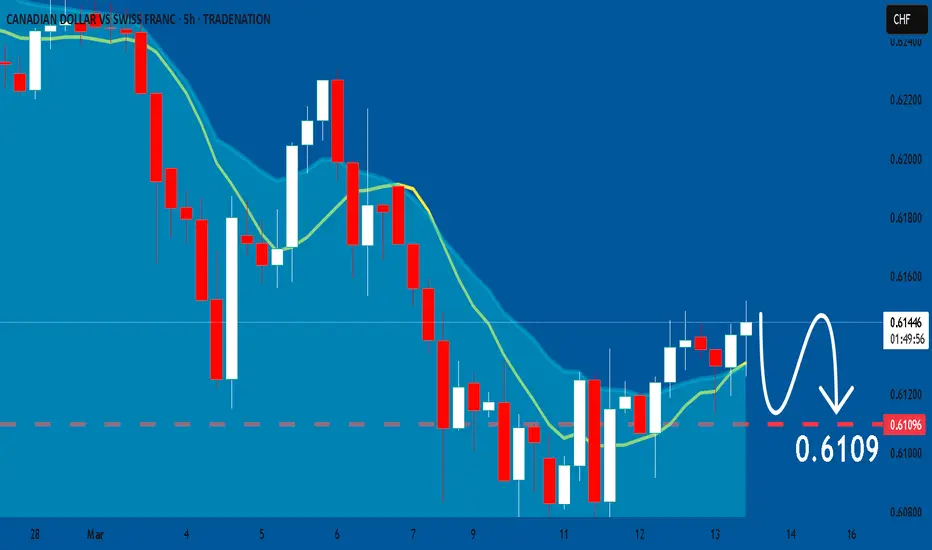
CADCHF: Bearish Forecast & Bearish Scenario
Looking at the chart of CADCHF right now we are seeing some interesting price action on the lower timeframes. Thus a local move down seems to be quite likely.
Disclosure: I am part of Trade Nation's Influencer program and receive a monthly fee for using their TradingView charts in my analysis.
❤️ Please, support our work with like & comment! ❤️
NZDUSD: Bullish Continuation
The charts are full of distraction, disturbance and are a graveyard of fear and greed which shall not cloud our judgement on the current state of affairs in the NZDUSD pair price action which suggests a high likelihood of a coming move up.
Disclosure: I am part of Trade Nation's Influencer program and receive a monthly fee for using their TradingView charts in my analysis.
❤️ Please, support our work with like & comment! ❤️

GOLD: Short Trade Explained
GOLD
- Classic bearish setup
- Our team expects bearish continuation
SUGGESTED TRADE:
Swing Trade
Short GOLD
Entry Point - 2967.6
Stop Loss - 2975.0
Take Profit - 2951.6
Our Risk - 1%
Start protection of your profits from lower levels
Disclosure: I am part of Trade Nation's Influencer program and receive a monthly fee for using their TradingView charts in my analysis.
❤️ Please, support our work with like & comment! ❤️

EURUSD: Trading Signal From Our Team
EURUSD
- Classic bearish formation
- Our team expects fall
SUGGESTED TRADE:
Swing Trade
Sell EURUSD
Entry Level - 1.0883
Sl - 1.0979
Tp - 1.0729
Our Risk - 1%
Start protection of your profits from lower levels
Disclosure: I am part of Trade Nation's Influencer program and receive a monthly fee for using their TradingView charts in my analysis.
❤️ Please, support our work with like & comment! ❤️
