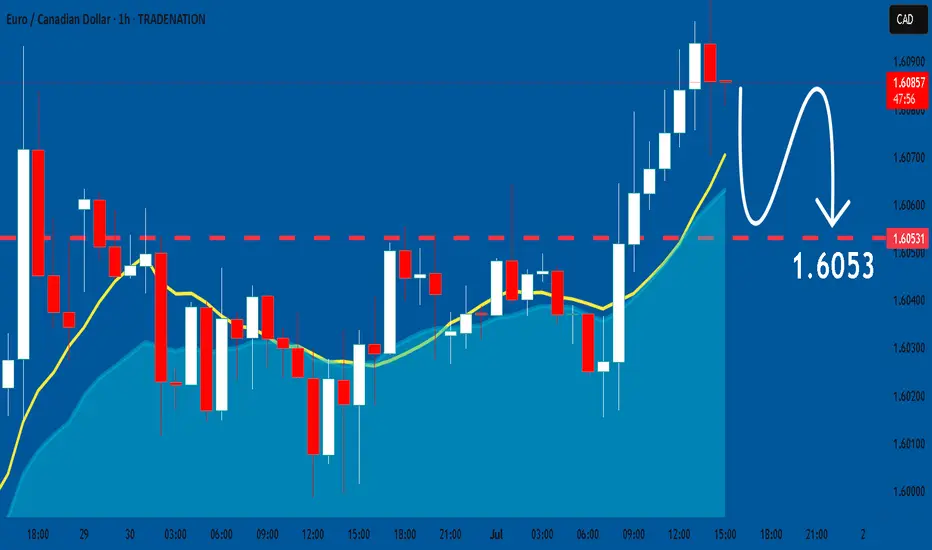
EURCAD: Expecting Bearish Continuation! Here is Why:
The recent price action on the EURCAD pair was keeping me on the fence, however, my bias is slowly but surely changing into the bearish one and I think we will see the price go down.
Disclosure: I am part of Trade Nation's Influencer program and receive a monthly fee for using their TradingView charts in my analysis.
❤️ Please, support our work with like & comment! ❤️
Prediction
AUDCAD: Short Trade with Entry/SL/TP
AUDCAD
- Classic bearish formation
- Our team expects fall
SUGGESTED TRADE:
Swing Trade
Sell AUDCAD
Entry Level - 0.8940
Sl - 0.8963
Tp - 0.8889
Our Risk - 1%
Start protection of your profits from lower levels
Disclosure: I am part of Trade Nation's Influencer program and receive a monthly fee for using their TradingView charts in my analysis.
❤️ Please, support our work with like & comment! ❤️

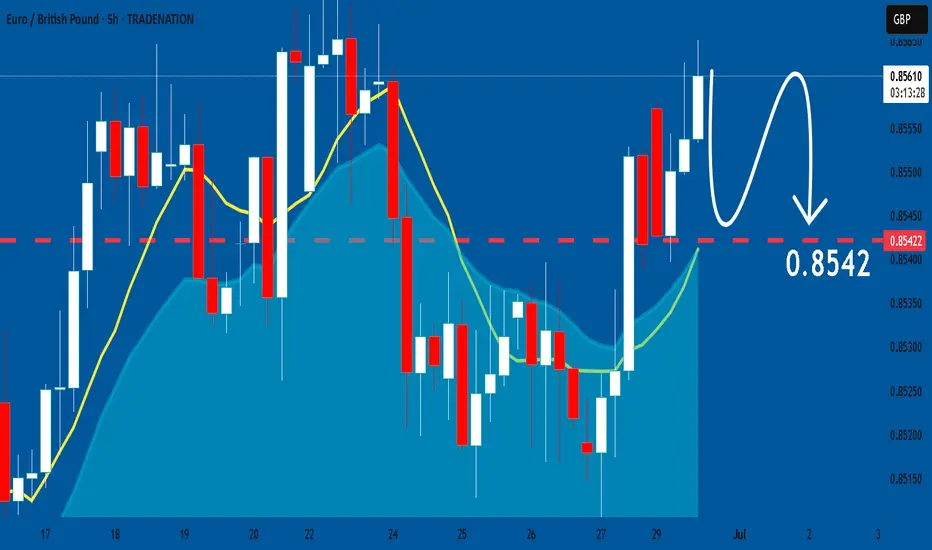
EURGBP: Will Start Falling! Here is Why:
It is essential that we apply multitimeframe technical analysis and there is no better example of why that is the case than the current EURGBP chart which, if analyzed properly, clearly points in the downward direction.
Disclosure: I am part of Trade Nation's Influencer program and receive a monthly fee for using their TradingView charts in my analysis.
❤️ Please, support our work with like & comment! ❤️
GBPAUD: Growth & Bullish Continuation
Balance of buyers and sellers on the GBPAUD pair, that is best felt when all the timeframes are analyzed properly is shifting in favor of the buyers, therefore is it only natural that we go long on the pair.
Disclosure: I am part of Trade Nation's Influencer program and receive a monthly fee for using their TradingView charts in my analysis.
❤️ Please, support our work with like & comment! ❤️

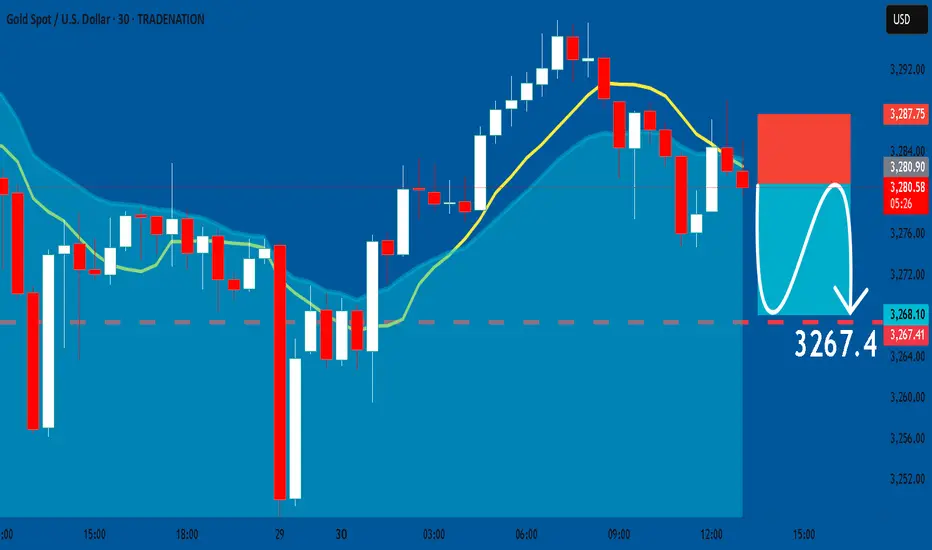
GOLD: Bearish Continuation & Short Signal
GOLD
- Classic bearish formation
- Our team expects pullback
SUGGESTED TRADE:
Swing Trade
Short GOLD
Entry - 3280.9
Sl - 3287.7
Tp - 3267.4
Our Risk - 1%
Start protection of your profits from lower levels
Disclosure: I am part of Trade Nation's Influencer program and receive a monthly fee for using their TradingView charts in my analysis.
❤️ Please, support our work with like & comment! ❤️
XAUUSD Analysis – June Monthly CloseGold starts the week with a weak bounce attempt after a strong bearish momentum on Friday, which pushed the market below the key 3254 support. The downtrend structure remains valid with a clear pattern of lower highs and lower lows on the 4H chart.
At the moment, price is trapped inside the 3254–3295 range. Despite the strong bearish pressure, we have yet to see a meaningful correction after the sharp drop on June 28th. This opens the door for a potential intraday pullback to test minor supply and moving average resistance near 3291–3297.
However, today is monthly candle close, which means increased volatility and possible false breakouts—especially during US sessions. Traders should be cautious with breakout traps, especially around 3305–3310, where stop hunting might occur.
The bigger picture still favors the bears unless gold manages to break and hold above the descending trendline and the EMA cluster.
📌 Trade Setup (Short Bias – Intraday Correction)
SELL zone: 3291 – 3297
SL: 3303 (Above supply & EMA test zone)
TP1: 3278
TP2: 3255
TP3: 3215
This is not a high-conviction swing setup but a tactical short based on potential rejection from previous supply and dynamic resistance. Small lot size is recommended due to the wider stop-loss and low R/R reward unless high volatility plays in our favor.
📊 Key Intraday Levels
R3: 3342
R2: 3322
R1: 3295
Pivot: 3254
S1: 3214
S2: 3180
S3: 3123

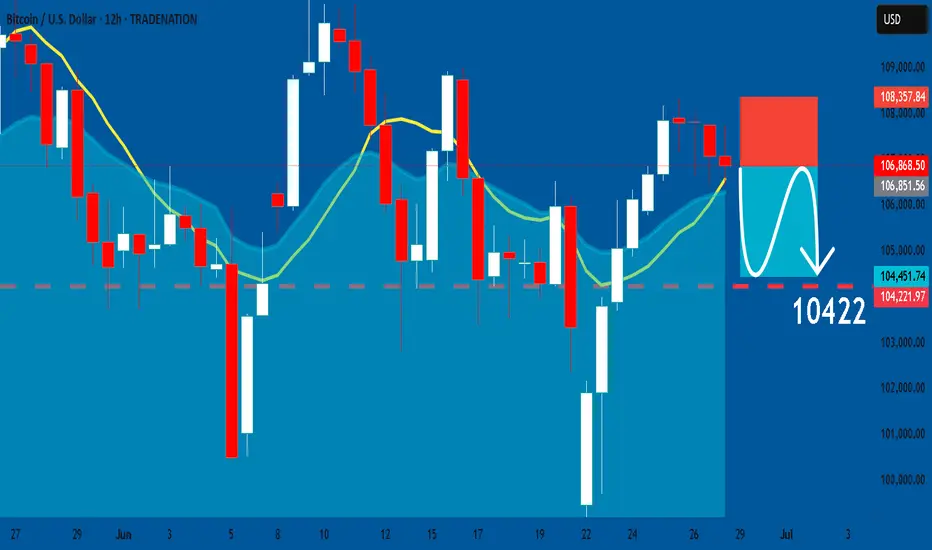
BTCUSD: Bearish Continuation & Short Signal
BTCUSD
- Classic bearish pattern
- Our team expects retracement
SUGGESTED TRADE:
Swing Trade
Sell BTCUSD
Entry - 10686
Stop - 10837
Take - 10422
Our Risk - 1%
Start protection of your profits from lower levels
Disclosure: I am part of Trade Nation's Influencer program and receive a monthly fee for using their TradingView charts in my analysis.
❤️ Please, support our work with like & comment! ❤️
SPY Technical Analysis! SELL!
My dear followers,
I analysed this chart on SPY and concluded the following:
The market is trading on 614.85 pivot level.
Bias - Bearish
Technical Indicators: Both Super Trend & Pivot HL indicate a highly probable Bearish continuation.
Target - 586.37
Safe Stop Loss - 631.68
About Used Indicators:
A super-trend indicator is plotted on either above or below the closing price to signal a buy or sell. The indicator changes color, based on whether or not you should be buying. If the super-trend indicator moves below the closing price, the indicator turns green, and it signals an entry point or points to buy.
Disclosure: I am part of Trade Nation's Influencer program and receive a monthly fee for using their TradingView charts in my analysis.
———————————
WISH YOU ALL LUCK

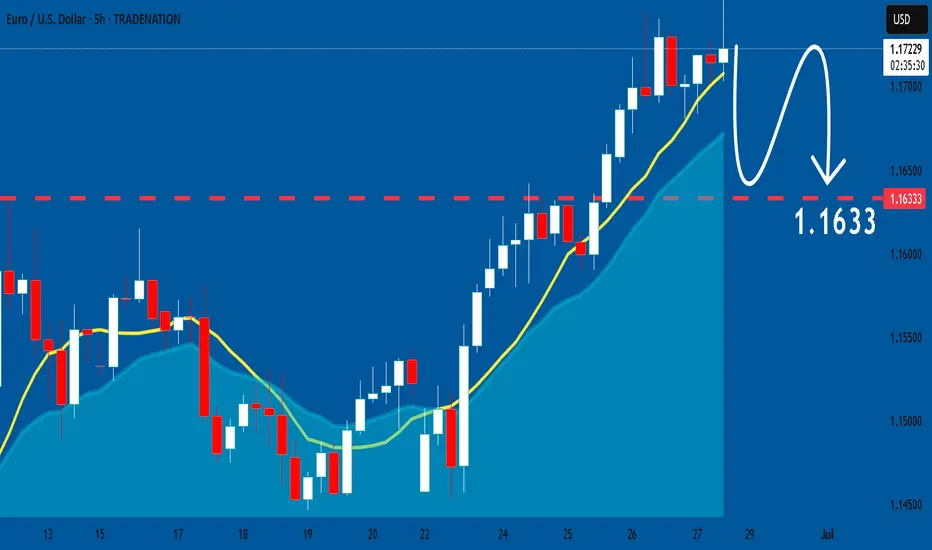
EURUSD: Short Trading Opportunity
EURUSD
- Classic bearish setup
- Our team expects bearish continuation
SUGGESTED TRADE:
Swing Trade
Short EURUSD
Entry Point - 1.1717
Stop Loss - 1.1764
Take Profit - 1.1614
Our Risk - 1%
Start protection of your profits from lower levels
Disclosure: I am part of Trade Nation's Influencer program and receive a monthly fee for using their TradingView charts in my analysis.
❤️ Please, support our work with like & comment! ❤️

GBPCHF: Will Start Growing! Here is Why
The charts are full of distraction, disturbance and are a graveyard of fear and greed which shall not cloud our judgement on the current state of affairs in the GBPCHF pair price action which suggests a high likelihood of a coming move up.
Disclosure: I am part of Trade Nation's Influencer program and receive a monthly fee for using their TradingView charts in my analysis.
❤️ Please, support our work with like & comment! ❤️

NATGAS: Forecast & Trading Plan
The analysis of the NATGAS chart clearly shows us that the pair is finally about to tank due to the rising pressure from the sellers.
Disclosure: I am part of Trade Nation's Influencer program and receive a monthly fee for using their TradingView charts in my analysis.
❤️ Please, support our work with like & comment! ❤️

USOIL: Long Trading Opportunity
USOIL
- Classic bullish pattern
- Our team expects retracement
SUGGESTED TRADE:
Swing Trade
Buy USOIL
Entry - 65.03
Stop - 62.60
Take - 69.73
Our Risk - 1%
Start protection of your profits from lower levels
Disclosure: I am part of Trade Nation's Influencer program and receive a monthly fee for using their TradingView charts in my analysis.
❤️ Please, support our work with like & comment! ❤️

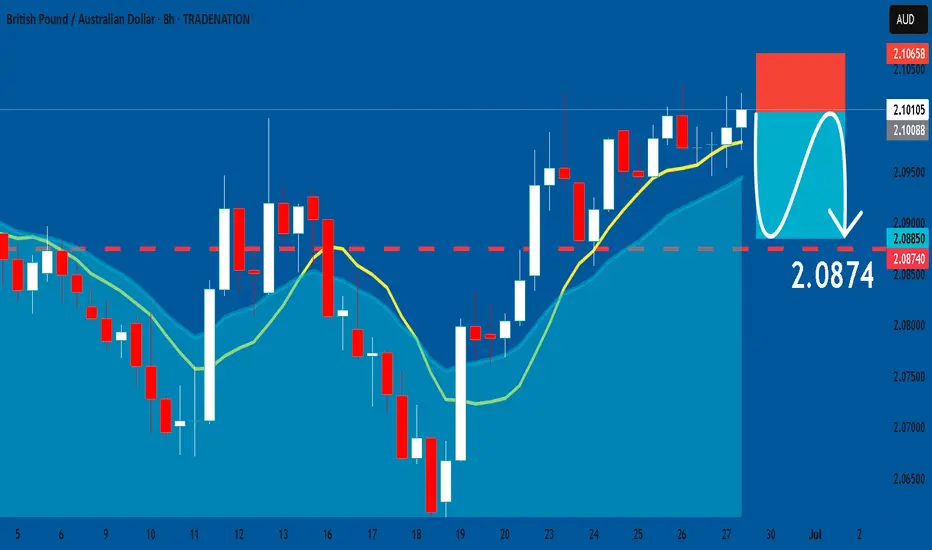
GBPAUD: Short Trade Explained
GBPAUD
- Classic bearish formation
- Our team expects fall
SUGGESTED TRADE:
Swing Trade
Sell GBPAUD
Entry Level - 2.1010
Sl - 2.1065
Tp - 2.0874
Our Risk - 1%
Start protection of your profits from lower levels
Disclosure: I am part of Trade Nation's Influencer program and receive a monthly fee for using their TradingView charts in my analysis.
❤️ Please, support our work with like & comment! ❤️
SPY: Bearish Continuation is Expected! Here is Why:
Looking at the chart of SPY right now we are seeing some interesting price action on the lower timeframes. Thus a local move down seems to be quite likely.
Disclosure: I am part of Trade Nation's Influencer program and receive a monthly fee for using their TradingView charts in my analysis.
❤️ Please, support our work with like & comment! ❤️

SILVER: Bulls Will Push
The price of SILVER will most likely increase soon enough, due to the demand beginning to exceed supply which we can see by looking at the chart of the pair.
Disclosure: I am part of Trade Nation's Influencer program and receive a monthly fee for using their TradingView charts in my analysis.
❤️ Please, support our work with like & comment! ❤️

Weekly Volatility SnapshotGood Morning --
I hope everyone had a good week of trading ranges -- although short, we saw some VOLATILITY .
Here we will step back with the year-to-date TVC:VIX in the background as we look towards a fresh week trading within the broader market ranges.
Let us begin --
Last week the S&P500 -- with the SP:SPX gapped up opening into strength of a short week at $6,007.46 and wicking up to $6,050.83 only to sell off during U.S. wartime engagement threats within the news cycle, closing the weeks range at $5,984.57. This provided a move of $96.96 and is most comparative to what IV (16.18%) stated entering last week -- that was predicting a range of +/- $101.24.
Now, looking towards this week -- IV (16.34%) is nearly unchanged as HV10 (9.75%) is showing a 'strength of IV' lowering at only 60% currently. IV within the yearly spectrum sits with an IVp of 74% -- fairly expensive as this can show the majority of money is spending up to protect downside uncertainties.
Understandable of course.
Our long-term trending volatility of HV63 (30.25%) is showing a 'strength of IV' at 185% which is correlating to an implied move of +/- $188.98 for the week. This is an advantage if reached of $86.90 over stated IV. A massive premium capture potential.
With the MACRO news cycle pointing EXTREMELY NEGATIVE, I will be watching for volatility expansion. I believe futures will open up gapping into quarterly marks -- this is just my humble opinion of course.
I see the opposite of last week happening, where we gap down and run up into the week. I don't hold a swing position, just an observation that psychologically retail will flip bearish on wartime news with a massive gap down, only to get trapped as broader markets expand upwards into the week.
That's all for now. Everyone have a good week trading ranges, and I will see you Saturday to review! As always, know you ABCs and stay hedged for whatever your bias may be!
CHEERS

EURNZD: Bearish Continuation & Short Trade
EURNZD
- Classic bearish formation
- Our team expects pullback
SUGGESTED TRADE:
Swing Trade
Short EURNZD
Entry - 1.9350
Sl - 1.9422
Tp - 1.9206
Our Risk - 1%
Start protection of your profits from lower levels
Disclosure: I am part of Trade Nation's Influencer program and receive a monthly fee for using their TradingView charts in my analysis.
❤️ Please, support our work with like & comment! ❤️

GBPUSD: Short Signal with Entry/SL/TP
GBPUSD
- Classic bearish pattern
- Our team expects retracement
SUGGESTED TRADE:
Swing Trade
Sell GBPUSD
Entry - 1.3710
Stop - 1.3765
Take - 1.3604
Our Risk - 1%
Start protection of your profits from lower levels
Disclosure: I am part of Trade Nation's Influencer program and receive a monthly fee for using their TradingView charts in my analysis.
❤️ Please, support our work with like & comment! ❤️

EURUSD: Will Keep Falling! Here is Why:
Balance of buyers and sellers on the EURUSD pair, that is best felt when all the timeframes are analyzed properly is shifting in favor of the sellers, therefore is it only natural that we go short on the pair.
Disclosure: I am part of Trade Nation's Influencer program and receive a monthly fee for using their TradingView charts in my analysis.
❤️ Please, support our work with like & comment! ❤️
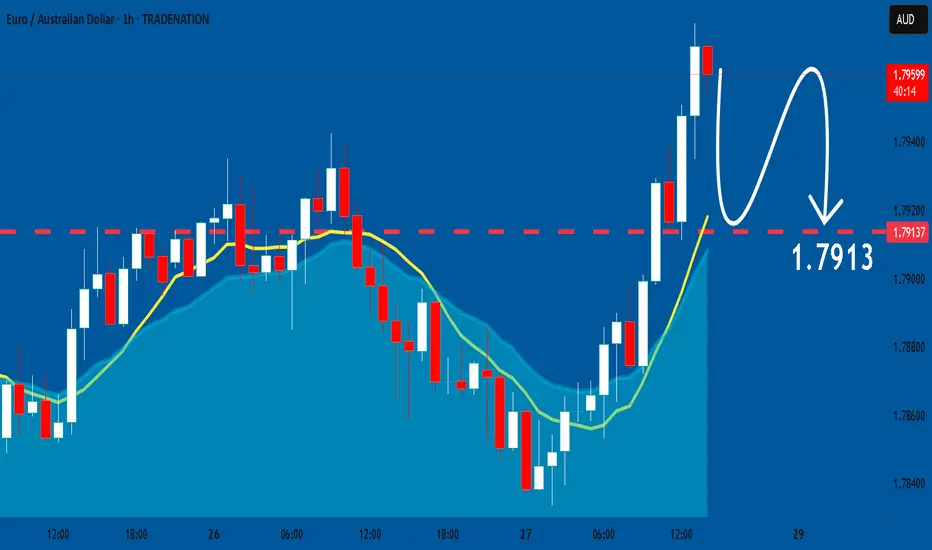
EURAUD: Weak Market & Bearish Continuation
The charts are full of distraction, disturbance and are a graveyard of fear and greed which shall not cloud our judgement on the current state of affairs in the EURAUD pair price action which suggests a high likelihood of a coming move down.
Disclosure: I am part of Trade Nation's Influencer program and receive a monthly fee for using their TradingView charts in my analysis.
❤️ Please, support our work with like & comment! ❤️
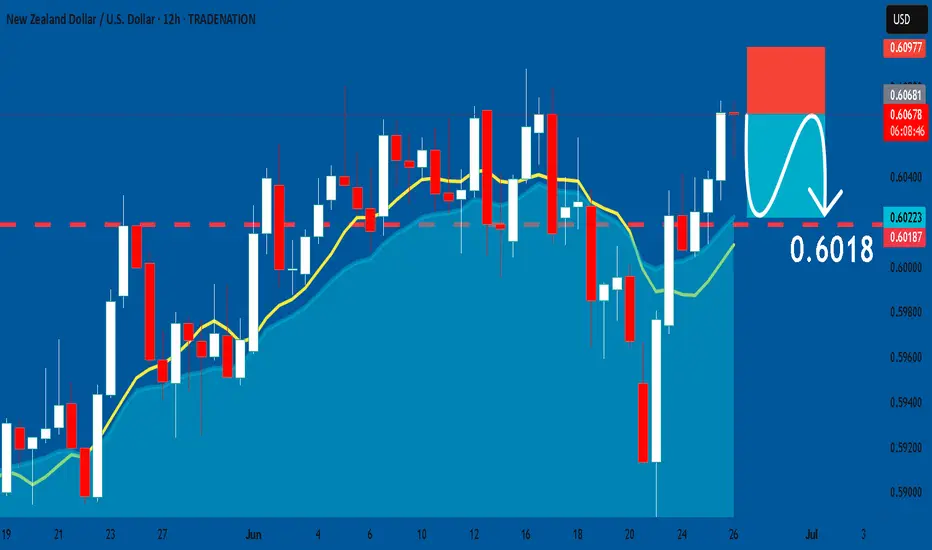
NZDUSD: Short Signal Explained
NZDUSD
- Classic bearish setup
- Our team expects bearish continuation
SUGGESTED TRADE:
Swing Trade
Short NZDUSD
Entry Point - 0.6067
Stop Loss - 0.6097
Take Profit - 0.6018
Our Risk - 1%
Start protection of your profits from lower levels
Disclosure: I am part of Trade Nation's Influencer program and receive a monthly fee for using their TradingView charts in my analysis.
❤️ Please, support our work with like & comment! ❤️
USDCAD: Bullish Continuation is Expected! Here is Why:
Our strategy, polished by years of trial and error has helped us identify what seems to be a great trading opportunity and we are here to share it with you as the time is ripe for us to buy USDCAD.
Disclosure: I am part of Trade Nation's Influencer program and receive a monthly fee for using their TradingView charts in my analysis.
❤️ Please, support our work with like & comment! ❤️

USDJPY: Bullish Forecast & Bullish Scenario
The recent price action on the USDJPY pair was keeping me on the fence, however, my bias is slowly but surely changing into the bullish one and I think we will see the price go up.
Disclosure: I am part of Trade Nation's Influencer program and receive a monthly fee for using their TradingView charts in my analysis.
❤️ Please, support our work with like & comment! ❤️
