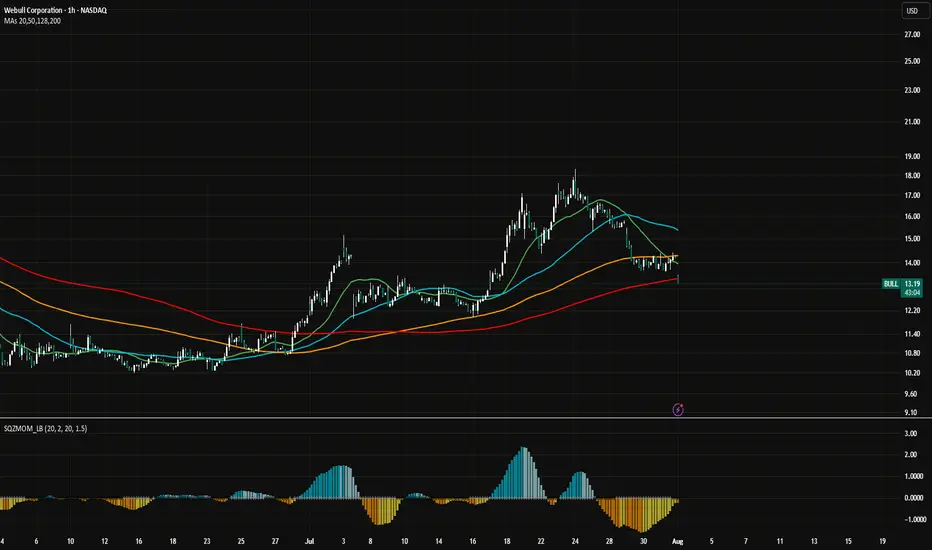
WeBull Look Ahead $BULLRecently took a look at WeBull and I believe there is a huge arbitrage opportunity from NASDAQ:HOOD to $Bull.
Although RobinHood is building something much much bigger than anticipated, including banking, I think WeBull can take some of $HOODS market share depending on their direction.
-Webull's total revenues grew 32% year-over-year to $117 million in the first quarter of 2025, according to SEC filings
-Customer assets increased 45% year-over-year, reaching $12.6 billion at the end of Q1 2025, according to Webull
-The number of registered users grew by 17% year-over-year, according to Webull
-Partnership with prediction market Kalshi will grow profits for WeBull exponentially.
www.nasdaq.com
This Might be the best price to get in today depending on WeBull's Success.
Predictionmarkets
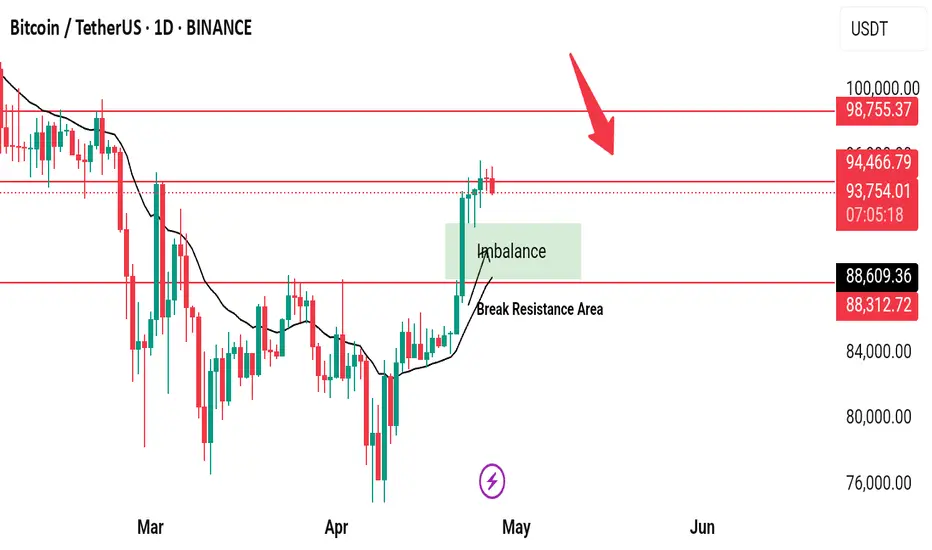
Watching closely $93,900 level.BTCUSDT Weekly Update
Bitcoin has successfully broken through its previous resistance area and is currently testing a new resistance zone. We are closely watching the $93,900 level. If the market provides confirmation of a rejection or reversal at this level, we will consider entering a short position targeting the marked FVG (Fair Value Gap) zone.
This FVG is a bullish imbalance zone, which previously contributed to market momentum. If the price moves lower, we plan to exit short positions near the FVG zone and look for confirmation to enter buy-side trades, aligning with the existing bullish market structure.
Let's closely monitor these levels throughout the week. If price action aligns, we anticipate strong trading opportunities on both sides of the market.
Mondelez at the Edge: Can Bulls Hold the Line?A Pivotal Moment for Mondelez – Will the Bulls Step Up?
Mondelez International (NASDAQ: MDLZ) is trading at $58.05, clawing back some ground but still down 26.1% from its all-time high of $78.59. The stock has been oscillating near a critical resistance level at $58.40, testing the patience of both bulls and bears. Technical indicators suggest a market at a crossroads: the 50-day MA sits at $57.63, while the RSI hovers at 52.97, keeping the stock in neutral momentum. Meanwhile, Money Flow Index (MFI) remains weak at 38.09, signaling a lack of strong accumulation.
Adding to the tension, the last few sessions have flashed sell-heavy VSA patterns, with a significant increase in selling volume on January 31st. This raises an important question: Is Mondelez on the brink of a breakdown, or will buyers defend the $57 zone and push for a breakout above $58.40?
The answer may come from broader market forces. Inflation remains a key macro factor, and any shifts in consumer sentiment could dictate the next leg for Mondelez. Traders should watch for confirmation: if bulls fail to reclaim ground above $58.40, the path downward toward $56.50 support may accelerate. But if the stock finds strength, a breakout could set sights on the next resistance near $59.86 and beyond.
One thing is certain—this is a defining moment for MDLZ. Are you ready for what’s next?
MDLZ Roadmap: Tracing the Footsteps of Market Makers
Mondelez (NASDAQ: MDLZ) has been dancing on the edge of key price levels, with a series of Volume Spread Analysis (VSA) patterns defining its trajectory. The past few sessions reveal a battle between buyers and sellers, but the roadmap is becoming clearer. Let’s break it down.
January 27 – Sell Volumes Max: This pattern signaled an aggressive sell-off, closing at $58.37 from an opening of $58.595. Given the magnitude of the sell pressure, it was crucial to watch the next sessions for validation.
January 28 – Buy Volumes Max: A reversal attempt came in with increased buy volumes, pushing the stock up to $56.88 from a low of $56.68. This bounce hinted at possible accumulation, but the lack of follow-through kept the market on edge.
January 29 – Sell Volumes: Sellers regained control, pushing MDLZ to $57.13, marking another bearish shift. This played into the broader downtrend, reinforcing that buyers weren’t ready to step in just yet.
January 30 – VSA Sell Patterns Dominate: The day saw a series of manipulation-based sell patterns, with MDLZ closing at $57.695. These patterns typically indicate smart money positioning for further downside.
January 31 – Sell Volumes Max Returns: Another spike in sell volumes appeared, reinforcing the previous direction and closing at $58.00. This was a strong confirmation that the previous bearish signals were working.
Key Takeaways: The main direction has remained bearish, and each sell-based VSA pattern has been validated by subsequent price action. Bulls attempted a fightback on January 28, but weak follow-through suggested it was merely a liquidity grab. Until we see a buy pattern confirming with sustained upward movement, the path of least resistance remains downward.
MDLZ traders should keep an eye on support zones near $56.50, as breaking this could trigger further downside momentum. Will buyers finally step in, or are we looking at another leg lower? Stay tuned.
Technical & Price Action Analysis: Key Levels to Watch
Mondelez (NASDAQ: MDLZ) is moving in a tight range, and key levels are setting up for potential breakout or breakdown plays. Whether you’re scalping the swings or positioning for a bigger move, here’s what matters right now.
Support Levels: If buyers want to step up, they’ll need to hold $56.51 and $55.72—otherwise, expect them to flip into resistance, making the path even harder for bulls.
Resistance Levels: The first roadblock for upside sits at $58.40, followed by $59.86 and $60.71. If these levels don’t hold sellers back, expect them to become the next battle zone for bulls trying to break through.
Powerful Support Levels: The real lifeline sits way higher at $65.27 and $69.65—far from current prices, but if the stock ever reclaims these zones, the trend structure could shift bullish again.
Powerful Resistance Levels: The ultimate ceiling remains $75.68, but let’s be real—MDLZ has a long way to go before challenging that zone again.
If support fails, those same levels will be a brick wall on the next bounce attempt. Traders should be watching price reactions closely—levels don’t break without a fight, and smart money is always one step ahead.
Trading Strategies Based on Rays: Optimistic & Pessimistic Scenarios
The "Rays from the Beginning of Movement" method provides a dynamic approach to market structure, using Fibonacci-based rays to map out price movements. Unlike static support and resistance, these rays adapt in real time, helping traders react to the market instead of predicting exact levels.
Each price interaction with a ray indicates one of two scenarios:
Reversal – A bounce off a ray signals a potential turn in trend.
Continuation – A breakout or clean movement along the ray suggests an extension toward the next key zone.
Trade entries are only valid after price interacts with a ray and confirms movement in the expected direction. The first ray hit acts as the initial target, with subsequent rays marking extended take-profit levels.
Optimistic Scenario: Bulls Take Control
If price holds $58.40 resistance and breaks above, we look toward $59.86 as the next target.
If momentum continues, $60.71 becomes the secondary take-profit zone.
If buyers manage to push beyond $66.07, we could see a structural shift towards the powerful resistance zone at $69.22.
Pessimistic Scenario: Bears Regain Control
A rejection at $58.40 or a break below $56.51 signals downside pressure.
If sellers dominate, the next key level is $55.72.
A further breakdown could push MDLZ toward the $54.72 absolute low, a must-hold zone for bulls.
Dynamic Moving Averages as Confirmation
Moving averages (MAs) will play a key role in defining momentum:
50 MA at $57.63 – A flip above this level supports bullish continuation.
100 MA at $57.45 – A break below signals a short-term bearish trend shift.
200 MA at $57.33 – The ultimate line in the sand; a loss here opens the door for deeper declines.
Potential Trade Setups Based on Ray Interactions
Long on Break Above $58.40 → Target $59.86, Stop Below $58.00
Short on Rejection from $58.40 → Target $56.51, Stop Above $58.70
Long on Bounce from $56.51 → Target $58.40, Stop Below $56.00
Short on Breakdown Below $56.51 → Target $55.72, Stop Above $56.80
As always, these setups work in confluence with the VSA rays already mapped out. Each move from ray to ray defines a structured trade, and positioning should only occur after confirmation of movement.
Let’s Talk: Your Thoughts & Custom Analysis Requests
Trading is all about levels and reactions, and now it’s your turn—drop your questions in the comments! Let’s discuss how MDLZ moves next, and whether the price will respect these mapped-out levels.
Hit Boost and save this idea so you can check back later—watch how the market moves exactly along the rays. That’s the key to profitable trading: knowing where price action matters before it happens.
By the way, my private indicator automatically plots all rays and key levels, but it’s only available in Private Access. If you’re interested in using it—send me a message.
Need an analysis for a different asset? No problem! I can chart any market—some setups I post for free, while others we can arrange privately. If you have a specific request, let me know in the comments and hit Boost—I’ll do my best to include it in upcoming ideas.
And of course, follow me here on TradingView so you don’t miss future updates. Let’s trade smart! 🚀

BTC Analisys Double bottom BOUNCE ! Just as predicted !
Bitcoin is doing exactly the double test we predicted in order to rebound with bullish momentum. We could see Bitcoin between 68 and 70 again in the coming days, maybe next week.
We are in the profit zone ! If you followed my analysis from weeks ago, you should be in the green with no problem! Congratulations!

Reliance Elliottwave update 9th June 2023Hello everyone,
Reliance is just completed corrective B wave, now C wave is starting, target is 2430.
Note: we have shared this info for education purpose only, not a recommendation, we are not responsible for your profits or losses, always trade with your own risk.

Simple Projection of Second Top (Hidden Bearish Trend) Simple Long-Term Prediction:
Since its highest price, BTC has been in a downtrend but It is hard to label it as a bear market. I am seeing it as a reaction that brought us to the significant support level which has been seen as the last pillar of hope with an enormous amount of fear.
If BTC can defeat the emotional level of 21.5k, It will give more buying opportunities to the bull runners. I believe that the real bearish market would be from the second top after the price reaches between the 30k-40k. I believe sellers lost a little bit of momentum. In addition to that, the U.S dollar index (20-year high of 114.78) is the major factor in driving the BTC price over the last few weeks which dropped below 111 points. As a result, It can boost market recovery for crypto and stock.
My previous BTC analysis was for the long-term strategy which pointed out the long duration of consolidation that means highly choppy trades.
To sum up;
I am still on the side of my second top scenario and not Fomo bungee jumping for 100k-300k price levels.
Thank you, guys!

Bye bye bitcoinHello everyone😢
I don't like to say end of the bullrun is so close, but in this situation we most be awake to stop our losses.
maybe next few weeks we hear good news but now I guess this winter is to cold.
HNY.
BYE🙋♂️

Prosper PROS/ETH - Cheap BUY! LP Staking starts tomorrow!!!
About Prosper
prosper.so
World's first prediction market with the on-chain liquidity aggregation.
Working Product - Currently only 4.5 million tokens in circulation 100 million in total
Partnerships with Binance Smart Chain, Chainlink, Polygon, Avalanche, Polkadot, Tron
Currently in Beta and running prediction mining event on the Binance Smart Chain at beta.prosper.so
LP Staking starting tomorrow April 8th, 2021 - Info here medium.com
Very little marketing / promoting up to now so very much under the radar
PROSPER'S LP staking program
From April 8th, 2021, 410,400 $PROS tokens will be rewarded , in addition to the current staking mining campaign of 291,600 $PROS tokens.
To elaborate, approximately $2,000,000 USD worth of $PROS tokens will be distributed via liquidity pools.
The rewards will be distributed on an hourly basis with a 7 days vesting period from the claim action.
The process will happen on our own platform,
Staking happens on the PROS/USDC pair,
Stakers will need ETH in order to pay the gas fees.
Total reward pool: 410,400 $PROS
Daily reward pool: 9,120 $PROS
Hourly reward pool: 380 $PROS
During the LP staking program, the user may choose the lockup duration, which will reflect on his reward ratio. The lock-up period starts from the moment of staking.
OPTION 1 14 days lock up: x0,75 reward return ratio;
OPTION 2 30 days lock up: x1 reward return ratio;
OPTION 3 45 days lock up: flexible return ratio;

Prosper PROS/ETH - Screaming BUY!! LP Staking starts tomorrow!!Great time to buy $pros - very good risk reward setup.
About Prosper
prosper.so
World's first prediction market with the on-chain liquidity aggregation.
Working Product - Currently only 4.5 million tokens in circulation 100 million in total
Partnerships with Binance Smart Chain, Chainlink, Polygon, Avalanche, Polkadot, Tron
Currently in Beta and running prediction mining events on the Binance Smart Chain at beta.prosper.so and on Polygon Network
LP Staking starting tomorrow April 8th, 2021 - Info here medium.com
Very little marketing / promoting up to now so very much under the radar
PROSPER'S LP staking program
From April 8th, 2021, 410,400 $PROS tokens will be rewarded , in addition to the current staking mining campaign of 291,600 $PROS tokens.
To elaborate, approximately $2,000,000 USD worth of $PROS tokens will be distributed via liquidity pools.
The rewards will be distributed on an hourly basis with a 7 days vesting period from the claim action.
The process will happen on our own platform,
Staking happens on the PROS/USDC pair,
Stakers will need ETH in order to pay the gas fees.
Total reward pool: 410,400 $PROS
Daily reward pool: 9,120 $PROS
Hourly reward pool: 380 $PROS
During the LP staking program, the user may choose the lockup duration, which will reflect on his reward ratio. The lock-up period starts from the moment of staking.
OPTION 1 14 days lock up: x0,75 reward return ratio;
OPTION 2 30 days lock up: x1 reward return ratio;
OPTION 3 45 days lock up: flexible return ratio;

BEPRO 🕹️ Buy the Dip 👨🚀 Ride the Ship 🚀There's a lot to like about this undervalued gaming crypto. While everyone is distracted by DeFi Swaps... go next-level and into DeFi Gaminig 3.0!
BEPRO did a crazy pump seemingly out of nowhere... but now that the dust has settled, it's time to do your research and possibly scale into this crypto gem. 💎
It's been under a major resistance level for 190+ days and indicators such as the On Balance Volume and Relative Strength Index shows clues... of resistance maybe flipping to support?
🚨 Please note: BEPRO can drop another 36% to $0.0028, but as a value investor, it's obvious that this can get to $0.01... 120% gain
(Risk to Reward 1:3)
"BEPRO Network aims to be the most useful codebase for building decentralized apps on Ethereum, Polkadot, and other blockchain-based ecosystems. Our job is to focus on building technology that adds value to entrepreneurs and product builders, so they can focus on making their startups a success. Our aim is to build a network around the BEPRO token and make it into a thriving decentralized economy."
⭐ Source:
www.bepro.network
⭐ Available on Kucoin:
www.kucoin.com

LONG REP: Bouncing of Lower Linear Reg ChannelLONG REP: Bouncing of Lower Linear Reg Channel
STOP @ 12.99
TARGET 1: 16.50: sell 1/2 move stop to BE
TARGET 2: 18.50 or trail with ATR stop
============================================
Augur is a decentralized prediction market project aiming to use “The Wisdom of the Crowds” to create an accurate forecasting platform. The team believes that by creating a fully decentralized prediction market they can overcome issues seen in centralized markets such as needing to trust that a result is correctly reported and that a payout is received. In addition, by creating a framework for the creation of these markets users can forecast the outcome of almost any event. Once a market is created trading begins immediately. The outcome of the event is determined by Augur’s oracles which are incentivized to report on event outcomes. Upon determination of the outcome, traders can close their positions and collect their payouts.

LONG BAND @ 200 Day SMA & POC SUPPORTLONG BAND @ 200 Day SMA & POC SUPPORT
Stop: 5.18
Profit Target 1: 7.5
Profit Target 2: 9:00 or Trail with a multiple of Lower Time Frame ATR
==============================================================
Band Protocol is a secure and scalable decentralized oracle serving as a layer-2 protocol on public blockchains. It allows dApps to leverage existing data on the internet without trusted intermediaries bridging the use cases between Web 2.0 and 3.0. Band’s unique multi-token model and staking mechanism hope to ensure that data is free from manipulation. By making data readily available and reusable on-chain Band Protocol offers a cheaper and faster solution compared with alternatives all without compromising security. Developers using Band Protocol will be able to build a wider range of dApps with integration to off-chain financial data reputation scores identity management systems and much more bringing blockchain closer to mass adoption.

LONG TRADE: oversold w/ bullish Squeeze @ POC SUPPORTLONG TRADE: oversold w/ bullish Squeeze @ POC SUPPORT.
Augur is a decentralized prediction market project aiming to use “The Wisdom of the Crowds” to create an accurate forecasting platform. Augur is creating a decentralized open-source prediction market platform and oracle service. Prediction markets on the platform will enable users to create a market for forecasting a specific future event, such as who will win the next election or which team will win the World Cup. Participants in the market will be able to buy “shares” of the specific outcome they see as most likely. At the end of a pre-determined period the outcome is checked and those that own shares in the correct result receive a monetary reward. Prediction markets can be useful tools in tracking the true sentiment for results, as typically only the most informed individuals will risk money when making a prediction.
The team believes that by creating a fully decentralized prediction market they can overcome issues seen in centralized markets such as needing to trust that a result is correctly reported and that a payout is received. In addition, by creating a framework for the creation of these markets users can forecast the outcome of almost any event. Once a market is created trading begins immediately. The outcome of the event is determined by Augur’s oracles which are incentivized to report on event outcomes. Upon determination of the outcome, traders can close their positions and collect their payouts.

LONG REP/USDT - setting up for possible breakout...Augur is a decentralized prediction market project aiming to use “The Wisdom of the Crowds” to create an accurate forecasting platform. Augur is creating a decentralized open-source prediction market platform and oracle service. The project was founded in 2014 and released an alpha version of the platform in June 2015. Due to issues with the Serpent language, which pre-dated Solidity, the team had to re-write their code in Solidity leading to a delay in development. Augur launched their beta in March 2016 and mainnet in July 2018.
Prediction markets on the platform will enable users to create a market for forecasting a specific future event, such as who will win the next election or which team will win the World Cup. Participants in the market will be able to buy “shares” of the specific outcome they see as most likely. At the end of a pre-determined period the outcome is checked and those that own shares in the correct result receive a monetary reward. Prediction markets can be useful tools in tracking the true sentiment for results, as typically only the most informed individuals will risk money when making a prediction.
The team believes that by creating a fully decentralized prediction market they can overcome issues seen in centralized markets such as needing to trust that a result is correctly reported and that a payout is received. In addition, by creating a framework for the creation of these markets users can forecast the outcome of almost any event. Once a market is created trading begins immediately. The outcome of the event is determined by Augur’s oracles which are incentivized to report on event outcomes. Upon determination of the outcome, traders can close their positions and collect their payouts.
