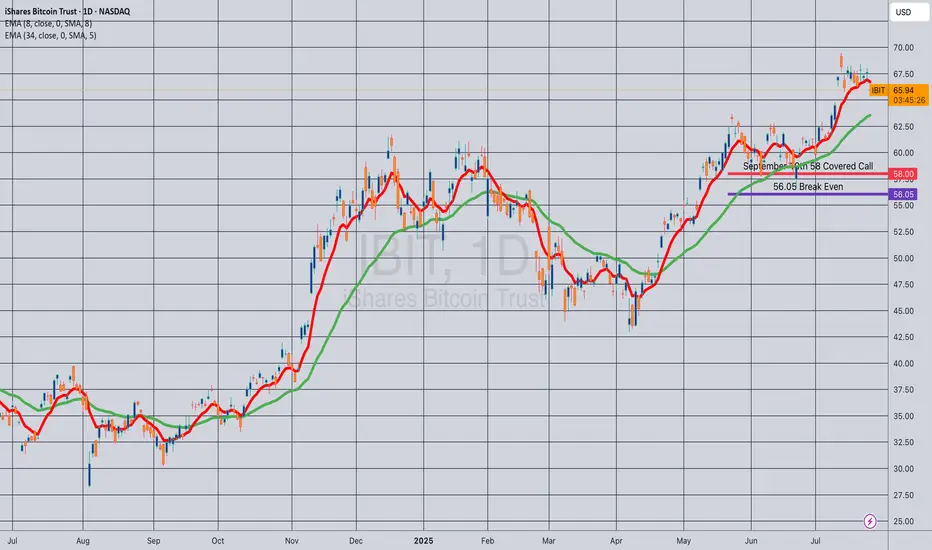
Opening (IRA): IBIT Sept 19th 58 Covered Call... for a 56.05 debit.
Comments: Selling the -75 delta call against shares to emulate the delta metrics of a +25 delta short put to take advantage of higher IV on the call side and the built-in defense of the short call.
Metrics:
Buying Power Effect/Break Even: 56.05
Max Profit: 1.95
ROC at Max: 3.48%
50% Max: .98
ROC at 50% Max: 1.74%
Will generally look to take profit at 50% max, add at intervals assuming I can get in at break evens better than what I have on.
Premiumselling
DG Trading Setup: Capitalizing on RangeDollar General has experienced a stabilization phase following its Q1 2025 results, with same-store sales increasing 2.4% and revenue growing 5.3% to $10.4 billion. The company has regained traction in the discount retail space, mitigating previous challenges related to shrink and operational inefficiencies.
Institutional Flow & Market Positioning
Recent institutional flow highlights large orders in DG’s 115 call and 110 put, signaling either:
- A range-bound setup, where smart money expects the stock to stay between $110-$115 in the near term.
- Potential volatility, with institutions hedging both directions ahead of an unexpected move.
Considering the ATR (18) and standard deviation (7.353), this aligns with a low-breakout probability, making range-based strategies the optimal play. The absence of earnings between now and July further supports sideways movement expectations.
Options Trade Setup: Iron Condor
To capitalize on premium decay and IV contraction, I’m structuring an iron condor:
- Sell 115 Call / Buy 120 Call
- Sell 110 Put / Buy 105 Put
This strategy ensures limited risk while collecting premium in a high-probability range trade.

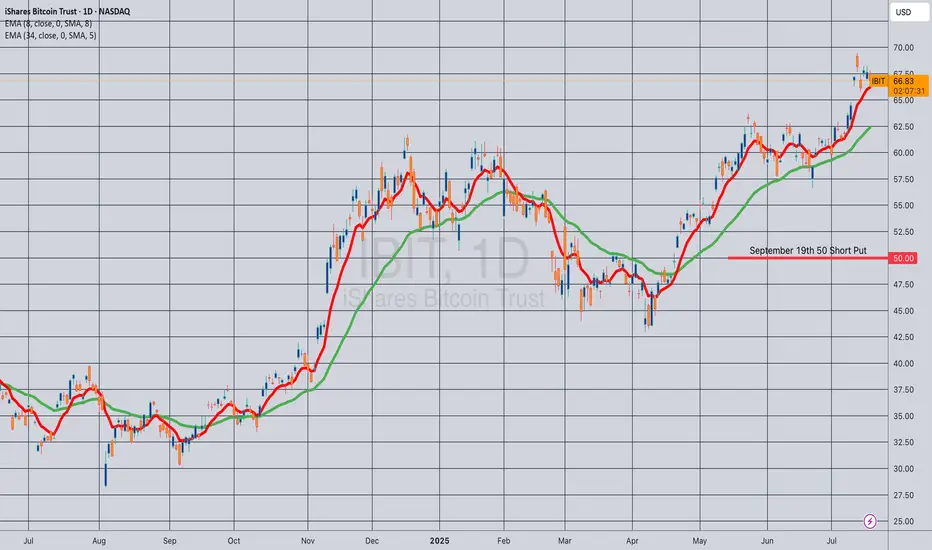
Opening (IRA): IBIT September 19th 50 Short Put... for a .52 credit.
Comments: Laddering out/adding at strikes better than what I currently have on, targeting the strike paying around 1% of the strike price in credit.
Will generally look to roll up at 50% max at > 45 DTE (Days 'Til Expiration).
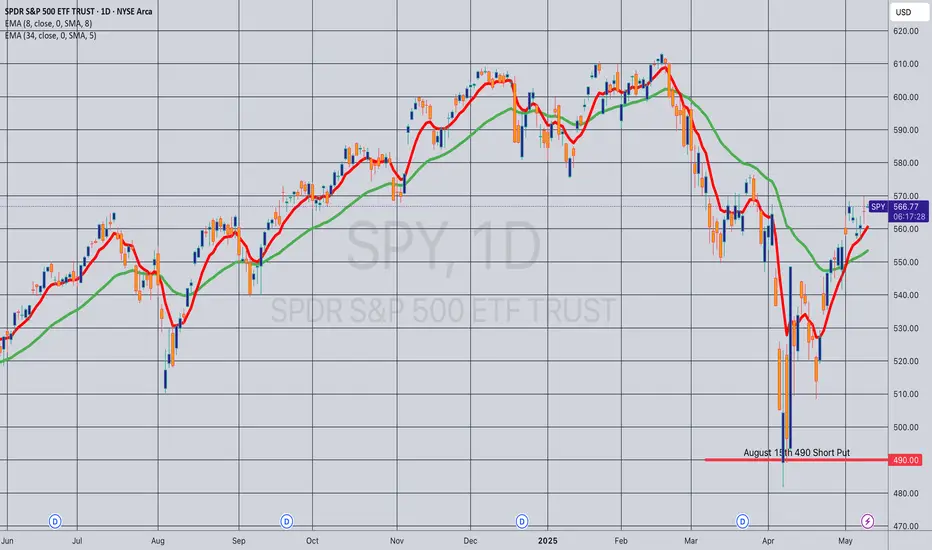
Opening (IRA): SPY August 15th 490 Short Put... for a 5.00 credit.
Comments: Laddering out, targeting the strike paying around 1% of the strike price in credit ... .
Will generally look to roll up to the shortest duration <16 delta strike paying 1% of the strike price if in profit.
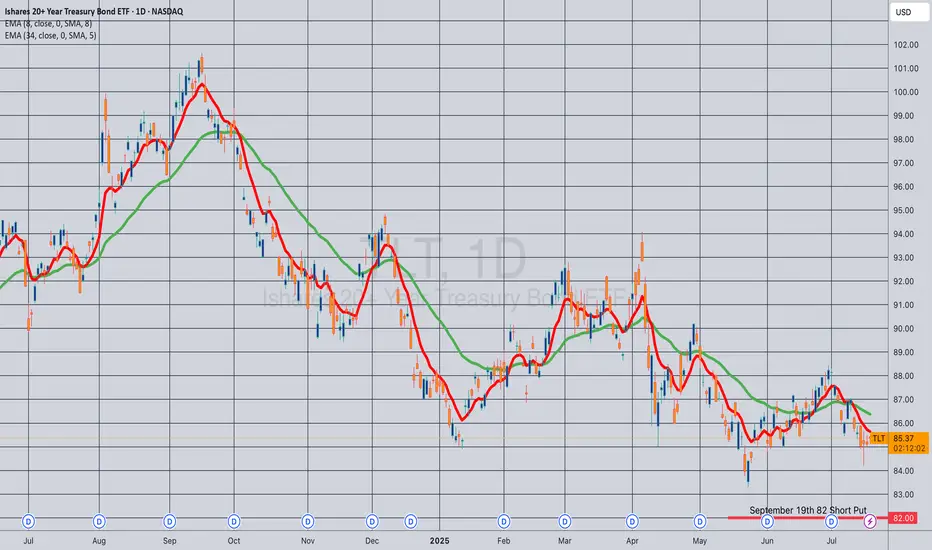
Opening (IRA): TLT September 19th 82 Short Put... for a .90 credit.
Comments: Adding to my position at strikes slightly better than what I currently have on ... .
Opening (IRA): IBIT July 25th 48 Short Put... for a .48 credit.
Comments: The highest 30-day IV on my ETF board (aside from USO and UNG). Laddering out, targeting the strike paying around 1% of the strike price in credit.

Opening (IRA): TLT Sept 19th 83 Short Put... for an .88 credit.
Comments: Camping out with a strike slightly below the 52-week low, where the options contract is paying a smidge more than 1% of the strike price in credit.
I don't really need more TLT, but wouldn't mind being assigned more at a lower price than the stock element of my covered calls.

Opening (IRA): IBIT July 18th 51 Short Put... for a .59 credit.
Comments: One of the higher IV ETF's on my board at the moment. A starter position, targeting the strike paying around 1% of the strike price in credit.
Will look to ladder out at intervals ... .

Opening (IRA): SPY July 18th 495 Short Put... for a 5.13 credit.
Comments: Targeting the <16 delta strike paying around 1% of the strike price in credit.
Max Profit: 5.13
ROC at Max as a Function of Strike Price: 1.04%
Will generally look to roll up if the short put is in profit at 45 DTE or greater, add at intervals if I can get in at strikes better than what I currently have on at the June 513's and July 495's, and/or consider a "window dressing" roll (i.e., a roll down to a strike that is paying about the same in credit) to milk the last drops out of the position.

Opening (IRA): SMH August 15th 215 Short Put... for a 2.50 credit.
Comments: A starter position in the semiconductor ETF on a smidge of weakness here, targeting the strike paying around 1% of the strike price in credit.
Will generally look to add at intervals if I can get it at a strike better than what I currently have on.

AAPL: Premium PlayApple beat expectations this quarter—revenue, profit, EPS—all slightly better than analysts hoped. But the stock dropped to $196.26, down from $212.83. Why? Investors are still worried about tariffs, margin pressure, and supply chain changes.
Tim Cook talked about strong product sales (iPhone, Mac, iPad) and all-time high Services revenue. But he also admitted tariffs and regulatory issues are weighing on Apple’s outlook.
My Covered Call Strategy
I’m selling the $202.5 call and buying the $210 call for June 27, 2025. Big money seems to be doing the same—there was a huge premium sale over $2 million, likely betting Apple stays range-bound short term.
- Why this works:
- Resistance near $202.50 gives me a clear ceiling
- Apple fundamentals are strong, but macro risk caps upside
Chart Notes
- Resistance: $202.50 and $210
- Support: Around $192.50
Bottom line:
I like this trade as a way to bring in income while defining my risk. If Apple grinds sideways or pushes a bit higher, the trade still pays. Clean structure, high odds.

GBPUSD - Technical Outlook (Long + Short Term)In this article, I’ll share my current outlook on GBPUSD, highlighting both higher time frame (HTF) and intraday considerations.
Higher Time Frame Analysis
The overall trend remains bearish. Price is still trading within the previous structural leg, with the key level at 1.42500. Unless we see a decisive break above this level, my bias will remain bearish for this pair.
Recently, we’ve witnessed what looks like institutional manipulation to the upside, followed by a sharp bearish reaction from the weekly supply zone. This price action aligns with a classic Wyckoff distribution cycle, which often signals that the prevailing trend is likely to continue.
Intraday Advice
For short-term traders, it’s best to wait for lower time frame (LTF) pullbacks and signs of manipulation before considering short positions. If price continues to push lower, there should be opportunities to ride the trend down over the coming weeks, with multiple entry points along the way.
Trading Considerations
If this analysis plays out, there’s potential to maximize gains through both swing and intraday trades. However, patience and risk management are key. Losses are inevitable - what matters is managing risk and staying disciplined.
Key Points to Remember:
Wait for clear pullbacks before entering trades.
Stick to your risk management plan.
Stay patient and let the market come to you.
This is an exciting time to trade FX:GBPUSD , but always assess if the risk is worth the reward before entering any position.
Happy hunting predators...
Apex out!

Opening (IRA): SMH July 18th 195 Short Put... for a 2.23 credit.
Comments: Adding at a strike better than what I currently have on at the 205 ... .

Opening (IRA): SPY August 15th 502 Short Put... for a 5.10 credit.
Comments: Adding at a strike better than what I currently have on in August at the 535 strike, targeting the <16 delta paying around 1% of the strike price in credit.

Opening (IRA): SPY September 19th 500 Short Put... for a 5.02 credit.
Comments: Adding at intervals at strikes better than what I currently have on, targeting the <16 delta strike paying around 1% of the strike price in credit. Will look to manage positions as I come to them.

Opening (IRA): SMH July 18th 205 Short Put... for a 2.21 credit.
Comments: Doing some higher IV premium-selling in the ETF space, targeting the <16 delta strike paying around 1% of the strike price in credit.
Will look to add at intervals if I can get in at strikes better than what I currently have on ... .

Opening (IRA): SPY September 19th 510 Short Put... for a 5.21 credit.
Comments: Laddering out, targeting the <16 delta strike paying around 1% of the strike price in credit.
Still looking to add in shorter intervals at strikes better than what I have on, but we've been in a grind-up ... .

Opening (IRA): SPY June 20th 490 Short Put... for a 5.26 credit.
Comments: Targeting the strike that is both at 16 delta or below and that is paying 1% of the strike price in credit ... .
Metrics:
Buying Power Effect/Break Even: 484.72
Max Profit: 5.26
ROC at Max: 1.09%
Will generally look to ladder out at intervals, assuming I can get in at prices better than what I currently have on, roll out at 50% max ... .

NAS100USD: Price Respects Bearish Structure at 62% FibGreetings Traders,
In today’s analysis on NAS100USD, we observe sustained bearish institutional order flow, and we aim to align with this directional bias by identifying high-probability selling opportunities.
KEY OBSERVATIONS:
1. Retracement into Premium Resistance:
Price has recently retraced into premium pricing levels, reaching the 62% Fibonacci retracement zone—a level that often acts as dynamic resistance. This retracement also aligned with a bearish breaker block, confirming institutional resistance at that level. The market has since shown signs of rejection, reinforcing the bearish narrative.
2. Emergence of Fair Value Gap (FVG) as a Key Resistance Array:
Following the rejection, a new FVG has formed, acting as a potential short-term resistance zone. This area provides a refined point of interest where institutions may look to re-engage in selling activity. The alignment of the FVG with previous resistance adds further confluence to the bearish setup.
TRADING PLAN:
We will monitor the newly formed FVG zone for signs of bearish confirmation. Upon confirmation, the plan is to execute short positions targeting liquidity pools in discounted price zones, in line with institutional price delivery patterns.
Remain focused, wait for confirmation, and make sure this idea aligns with your overall trading plan.
Kind Regards,
The Architect

NAS100USD: Institutional Selling Initiated at Premium LevelsGreetings Traders,
Today on NAS100USD, the market is currently operating within a clear bearish institutional order flow. In alignment with this directional bias, we are seeking selling opportunities supported by several key confluences.
Key Observations:
1. Liquidity Sweep at Premium Pricing:
Price has retraced deeply into a premium zone, sweeping the buy stops above a recent swing high. This suggests smart money is executing sell-side order pairing at extreme premium levels, utilizing retail liquidity for institutional distribution. When this occurs, price typically seeks rebalancing at fair value zones and continues toward discount levels.
2. Resistance at Fair Value Gap:
Following the liquidity sweep, price encountered resistance at a previously identified fair value gap (FVG). This FVG has held effectively, reinforcing the bearish outlook and acting as a high-probability rejection zone.
3. Market Structure Shift (MSS):
The market has now confirmed a bearish market structure shift, further validating the downside bias. This shift positions us to anticipate a continuation move.
4. Mitigation Block as Entry Zone:
We are currently watching a mitigation block for potential re-entries. These blocks represent zones where smart money mitigates previous long positions and introduces new short positions in alignment with the prevailing trend. If confirmed, they offer a strategic point to enter short trades.
Trading Plan:
Monitor the mitigation block for confirmation and look to enter with the broader institutional trend. Targets will include fair value regions and deeper liquidity pools at discount prices.
Remain patient and disciplined, and always ensure your analysis aligns with your trading plan.
Kind Regards,
The Architect

Opening (IRA): TLT June 20th 79 Short Put... for a 1.61 credit.
Comments: High IVR. Starting to ladder out here, selling the 25 delta put ... .
Since I'm interested in acquiring more shares at 85 or below, I may let this run to expiry or approaching worthless (e.g., .05) ... . Can't believe it breaks 84.50 (which would be correspondent with a 5% yield on the 10-year T note), but you never know in this environment.

Opening (IRA): SPY June 20th 375 Short Put... for a 3.74 credit
Comments: High IVR/>21 IV. Starting to ladder out here, targeting the strike paying around 1% of the strike price in credit.
Will generally look to roll up at 50% max to the strike paying around 1% of the strike price in credit if >45 DTE remain in the expiry and IVR/IV remains sufficient to collect 1% of the strike price in credit at 16 delta or less.

Opening (IRA): SPY May 16th 385 Short Put... for a 4.04 credit.
Comments: High IVR, >21 IV. Sticking a little pickle in here, targeting the strike paying around 1% of the strike price in credit which is quite a bit out of the money at the 8 delta.
Metrics:
Buying Power Effect/Break Even: 380.96
Max Profit: 4.04
ROC at Max: 1.06%
50% Max: 2.02
ROC at 50% Max: .54%
