BTCUSD : SELL IN 4HR CHARTBTCUSD SELL @ 106000 or below
Target : 100000
Stoploss : 107500
BTCUSD formed a perfect sell trend in 4hr chart. I am short on BTCUSD
Priceaction

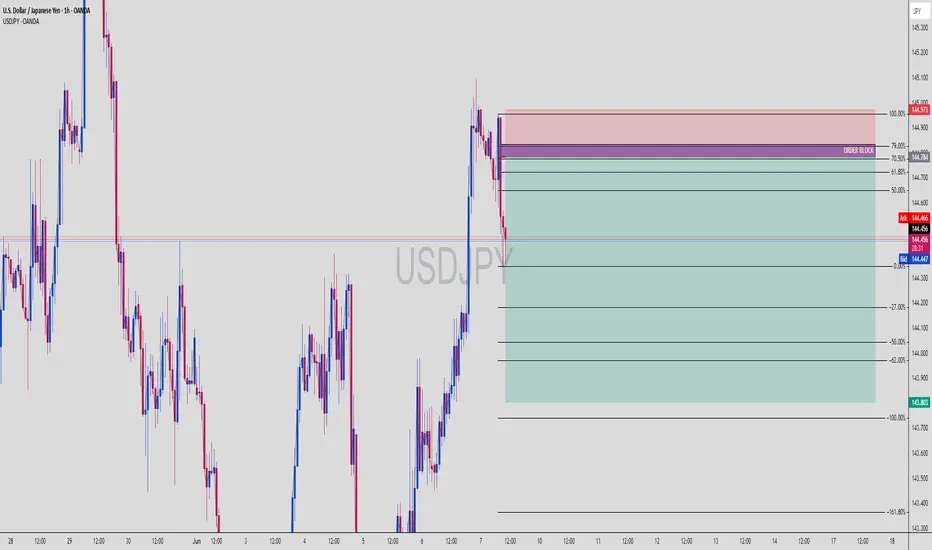
USDJPY Short Setup: OB Rejection + Fib Premium Sell-Off IncomingUSDJPY (1H Chart) | Institutional Short Setup with OB + Fib Confluence
The market is showing clear Smart Money Distribution behavior — with a rejection from a high-confluence zone combining Order Block, Premium Fib Levels, and bearish momentum shift.
🔍 Smart Money Setup Breakdown:
🔻 Bearish Order Block Zone (OB)
Price wicked into OB zone and got instantly rejected
OB located precisely at the 70.5% – 79% premium range
Mark of institutional sell-side interest
📐 Fibonacci Retracement + Premium Zone
Retracement from swing high (144.973) to swing low (144.436)
Premium zone between 61.8% to 79% aligns with OB (144.700–144.973)
Entry taken from this zone for high-probability sell setup
📉 Bearish Confirmation
Aggressive bearish reaction post-OB tap
Market structure flipping bearish
Momentum candle breaks previous bullish leg
🔻 Target Zones (Measured Fib Extensions)
-27%: 144.200
-62%: 144.000
-100%: 143.803
-161.8%: 143.300 (extended liquidity draw)
🧠 Chart Ninja Entry Plan:
🔹 Entry Zone 144.784 – 144.973 (OB + Premium Fib + FVG rejection)
🔻 SL Above 145.000 (above OB wick)
📉 TP 1 144.200 (first fib extension)
📉 TP 2 143.803 (full -100% extension)
⚖️ RRR Approx. 1:4+ — stealthy sniper precision
💬 Pro Tip from the Ninja Dojo:
The market doesn’t move because of indicators — it moves because of liquidity.
Find the OB. Wait for the imbalance. Strike where Smart Money hides. 🥷📊
This isn’t retail — this is calculated execution.
🎯 Save this chart before price melts to 143.8
💬 Drop your entry zone & SL idea in comments
USDCAD weekly overviewHello Traders,
War in Persian Gulf could change the direction of this analysis. Any conflict in the Middle ease could make out two white zones be red and suitable for shot trades. in normal situation, only 1.37732 is prepared for long trades.
***********************************************************
The indicated levels are determined based on the most reaction points and the assumption of approximately equal distance between the zones.
Some of these points can also be confirmed by the mathematical intervals of Murray.
You can enter with/without confirmation. IF you want to take confirmation you can use LTF analysis, Spike move confirmation, Trend Strength confirmation and ETC.
SL could be placed below the zone or regarding the LTF swings.
TP is the next zone or the nearest moving S&R, which are median and borders of the drawn channels.
*******************************************************************
Role of different zones:
GREEN: Just long trades allowed on them.
RED: Just Short trades allowed on them.
BLUE: both long and short trades allowed on them.
WHITE: No trades allowed on them! just use them as TP points

#202523 - priceactiontds - weekly update - dax futuresGood Day and I hope you are well.
comment: Last week I wrongly wrote that earnings season will start in June, sorry about that. It’s mid July. So what to do at 24300? Market finds acceptance above 24000 but we have made 500 points to the upside in the past 3 weeks. At some point bulls will let it go and reality will set in. Market is holding above the daily 20ema and until that changes, bears are not favored for anything. Be that as it may, I would rather look for some short scalps closer to 24400/24500 than longing above 24200. For next week I expect 24500 to get hit again, as well as 24000. Anything below 23800 would be a huge surprise though.
current market cycle: bull wedge and on the weekly tf it’s a broad bull channel and we are at the very top
key levels for next week: 23000 - 25000
bull case: Nothing changed so my comment remains the same.
25000 is the next big round number but I highly doubt we get there. I was wrong last week and until we leave bear gaps behind us, bulls are favored for everything because the reality is that buying every dip has been profitable for months now. Bulls have to keep printing higher lows though.
Invalidation is below 23700
bear case: We are basically where we were one week ago, so my comment from last week also applies to the bears.
I doubt we have much more upside in store but we could very well spike to 25000 before we can expect more bulls to stop buying every dip. Bears get spikes and zero follow-through, which leads to many bear traps. Scalping both sides was fine the past 2 weeks but bears have to take quick profits or they vanish quickly. Bears need a daily close below 23700 for more downside and until then, swing shorts are account destroyers. We need a big gap down which does not close to stop the BTFD crowd. So if we get a decent one next week and market only corrects sideways, that will be the trigger for more selling.
One thing that changed is that the current wedge has not a lot more room to go and I think if bulls fail to print 25000 next week (will align with all markets ripping higher), they likely won’t get it,
Invalidation is above 24550
short term: Neutral. Still scalping both sides. Best bears can get is a trading range 23500 - 24500 and anything outside of this range is a surprise. 24550 and higher would be less of a surprise though.
medium-long term from 2025-05-25: My rough guess from early May was down over the summer and up into year end. POTUS certainly helped with the 50% tariffs. Markets were not positioned for any risk what so ever. Now we got the atomic trade bomb. This view has not changed, just the time horizon which aligns better with Q2 earnings and my expectation that we will see the tariff madness coming through. Markets can ignore risks for longer than you can maintain your account but that does not change the reality and if you think this tariff war has a happy ending, you have not paid attention to anyone but the US government or their echo chamber.

#202523 - priceactiontds - weekly update - nasdaq e-mini futuresGood Day and I hope you are well.
comment: Same as last week, markets are all very similar. Nq is also in a wedge right under the big round number. I doubt bears can prevent the bulls from printing 22000 but bulls have certainly tried long enough now. Either they get it next week, or it won’t happen for couple of weeks/months.
current market cycle: trading range on the weekly tf, bull wedge on the daily tf
key levels for next week: 20700 - 22000
bull case: Can bulls find enough buyers above 21900 next week to push for 22000 or even a new ath above 22656? Right now bulls are still favored for everything but that does not mean buying above 21500 is a good trade. If you were to buy right now at 21789, your stop has to be 21720 or better 21655. You would be buying at the very top of an ascending triangle we have been in since Thursday. It’s certainly not a good short but I wouldn’t buy it either.
Invalidation is below 21300
bear case: Bears need to close the gap down to 21300 and then we can talk about the highs being in, maybe. For now they fail at making lower lows and letting the bulls make higher highs. They are selling new highs but market is still grinding higher. For couple of weeks now I have been writing that for bears to change the character of the market, they would need a strong gap down or sell spike and leave an open gap. I do think it’s not bad by the bears that we have still not printed 22000, which everyone expected on Thursday but instead bulls had to give up again and we sold for 700 points. Long story short, bears have nothing and no one would be surprised if we print 23000 next week.
Invalidation is above 22100
short term: Neutral around 21800. Longs closer to the wedge trend line 21600 are likely decent. I expect at least 22000 to get hit before we could maybe turn. Most insane thing would be to see a giant melt-up next week and continuing for 23000 over the next 2-3 weeks. Certainly much higher possibility of that happening than a weekly close below 21000.
medium-long term - Update from 2024-06-07: Market is refusing to go down but I can not see this going much more up. Maybe we hit 22000 maybe we don’t. My assumption is still that latest around mid/end of July we begin to decline over the summer.

#202523 - priceactiontds - weekly update - wti crude oilGood Day and I hope you are well.
comment: Time to be very cautious as a bear and hopeful as a bull. 3 clear legs down and the third could not make a new low. Now the market closed at the weekly high and it’s a fitting place for a reversal. 65 should be the highest bears should allow it. If bulls get follow-through beyond, this is a buy with stop 59.5. The target above 65 is obviously 70 and maybe even the bigger bear trend line around 73.
current market cycle: monthly time frame is a broad bear channel - weekly tf is a bear wedge - daily is a trading range
key levels: 59 - 65
bull case: Bulls got their first daily close above the weekly20 ema since February. Bears tried to get the market below 60 but failed to keep it below - 3 times now since April. Markets will try one thing only so much until they try something else. 65 is the next target which will likely get hit early next week but I expect a bit more sideways until one side clearly gives up. Technically this is a double bottom April/May lows and now a higher low and bulls want to get the major trend reversal.
Invalidation is below 65.5
bear case: Bears are hopeful that the bear wedge is still enough resistance that we test down to 60 but they need a strong reversal below 65 to make it happen and when a weekly bar closes at the very high, it’s probably not a good time to be a bear. Best bears can hope for here is to stay below 65 and continue inside the current range 60-65.
Invalidation is above 65.5
short term: Bullish. I think a bull breakout is much more likely than hitting 60 again. Buying 64.58 with a stop 59.5 is likely a decent trade already. Confirmation for the breakout is 65.5ish.
medium-long term - Update from 2025-06-08: Market finds no acceptance below 60 since 2021 and now we have 3 clear legs down, a higher low and a breakout above prior high with a weekly close at the highs and the weekly 20ema. This is likely as good of a swing long as you can get.

#202523 - priceactiontds - weekly update - bitcoinGood Day and I hope you are well.
comment: 3 legs down, bull flag trend line break but confirmation is only above 106840. It’s still much more bullish than bearish, since bears could not close the gap down to the April high 97915. Market expects a re-test of 110000 or higher and this breakout of the bull flag is as textbook perfect as it gets. Only a daily close below 100000 will change my bias and I will begin to look for lower targets again.
current market cycle: Broad bull channel on the weekly tf. Market is about to re-test the ath and will likely transition into a trading range afterwards or we are already in one.
key levels: 100k - 115k
bull case: Confirmation for the bull flag breakout is 106840, stop has to be 100300. 110000 is expected and you never know in advance if you get a a higher or lower high from double tops/test of the extremes.
Invalidation is a daily close below 100k
bear case: Bears tried 3 times and are likely to give up until we have a credible double top and more signs that the bulls are exhausted and can not push much beyond 110k. Can you sell 106k now and hope for a failed breakout? I don’t think that is a good trade at all. As a bear I would wait.
Invalidation is above 116k
short term: Bullish for 110k, invalidation is below 100k. I don’t expect much above 110k, maybe 115k.
medium-long term - Update from 2025-06-08: Need to see a clear sign that bulls can not push it beyond 112k and once we turn again from closer to the ath, I will comment on bear targets for the next months.

EURUSD - Where to next?I managed to catch a nice 1:21 RR on EU
I am now triggered into a long position taking price back up to the previous highs and potentially beyond.
Price is at a very key area on the HTF and we are at a key area of Supply.
As price sits I'm still expecting it to continue higher, however, if we break the 4HR orderflow to the downside there is a strong possibility price will move lower.
We will keep an eye on this one this week!

USDJPY Pullback? Watch OB + Fib Confluence for the Next Buy WaveUSDJPY | 30-Min Chart – Smart Money Buy Setup in Progress
After a sharp bullish rally, USDJPY is setting up for a classic retracement buy scenario. We're now watching a key confluence zone between Fibonacci levels, a bullish order block, and internal trend structure — all lining up for a high-probability long setup.
🔍 Trade Breakdown:
📉 Pullback Expected Before Next Rally:
Price rejected near short-term resistance and is retracing from local highs.
Retracement aligns with key OB + 61.8–79% Fib zone = institutional entry zone.
🟣 Order Block (OB) Demand Zone: 143.086 – 142.828
Last bullish candle before explosive rally = demand OB.
OB sits within premium Fib retracement = Smart Money buy zone.
📐 Fibonacci Levels (Swing Low to High):
61.8% ≈ 143.200
70.5% ≈ 143.000
79% ≈ 142.828
This is the kill zone for institutional longs — where Smart Money typically enters before expansion.
🔵 Projected Play:
Retracement to OB/Fib confluence.
Bullish rejection from OB zone.
Impulse move targeting previous highs and beyond.
💡 Target Level: 144.396 (sits just above prior high and aligns with -27% Fib extension)
📉 Current Bias:
Short-term retracement ➝ Mid-term bullish continuation
Expecting price to dip into OB then launch.
🧠 Chart Ninja Entry Plan:
🔹 Entry Zone: 143.086 – 142.828
🔻 SL Below: 142.650 (below OB/Fib + structure wick)
📈 Target: 144.396
⚖️ RRR: 1:3+ — high confluence risk-managed buy
🔍 Technical Confluence Checklist:
✅ OB demand zone
✅ 61.8–79% retracement
✅ Bullish market structure
✅ Internal channel support
✅ Momentum slow before entry
📍 Save this chart — don’t chase, let price come to you
💬 Comment if you're watching this OB too
👣 Follow @ChartNinjas88 for precision-based setups daily

BTCUSD at Decision Point – Rejection or Breakout Ahead? (4H)Bitcoin is currently trading around $103,500, and the price action is presenting a textbook technical scenario with multiple confluences. This chart is rich in structure — from rejection zones and trendlines to channel breakdowns and historical support retests — making it a critical area for traders to observe.
🔍 1. Previous Reversal Zone
The chart shows that Bitcoin previously faced a strong rejection near the $110,500–111,000 level. This created the first lower high, signaling the end of bullish momentum and the start of a trend shift. Every subsequent touch of that zone resulted in rejection, confirming it as a major supply zone.
📉 2. Descending Trendline – Dynamic Resistance
After multiple failed attempts to break above, price has formed a clean descending trendline that is acting as dynamic resistance. Each touch along this trendline has led to a short-term selloff, and price is now approaching this line again, near the Next Reversal Zone.
📌 This confluence increases the probability of another rejection unless there's a strong bullish breakout with volume.
📊 3. Bearish Channel & Breakdown
Before the recent fall, Bitcoin was trading inside a small bearish channel. This type of consolidation often results in continuation — which we saw with the downside breakout. This breakdown also increased bearish momentum and pushed BTC into the major support area.
🧊 4. Major Support Zone – The Battle Ground
Marked around the $101,000–102,000 range, this zone has acted as a strong demand area multiple times. The most recent bounce suggests that buyers are still active here. This could be the last defense for bulls in the short term.
🧠 If this zone breaks, we could see price falling toward the psychological level of $100,000 or even lower.
🌀 5. Ellipse Zone – Accumulation Structure
Early on the chart, an ellipse highlights a horizontal accumulation zone where price moved sideways before breaking out upward. This shows how smart money often enters during quiet phases before explosive moves. Watching for similar signs can provide strong trade setups.
🔄 6. Next Reversal Zone – Watch Closely
Price is now approaching the Next Reversal Zone near $104,500–105,000, which aligns perfectly with the descending trendline. This is a high-probability rejection zone where traders should be watching for bearish confirmations like wicks, pin bars, or bearish engulfing candles.
📌 Two Possible Scenarios
🟥 Bearish Scenario (High Probability):
Price touches the Next Reversal Zone and gets rejected.
We could see a drop back to the Major Support Zone.
If support breaks, expect a move toward $100K–99K in the coming sessions.
🟩 Bullish Scenario (Low Probability Without Volume):
Price breaks and closes above the trendline with strong bullish candles and increased volume.
In that case, BTC could rally toward the $107K–108K resistance and potentially flip the trend bullish.
💡 Trading Insight:
Fridays usually have low volume, leading to unexpected wicks and false breakouts. That’s why it’s important to:
Use small lot sizes
Wait for confirmations
Avoid overtrading before weekend closes
🧠 Final Thoughts:
This is a classic setup — consolidation after trend, rejection zones, trendline resistance, and strong support areas all in one chart. Whether you’re a price action trader or a structure-based analyst, this chart offers a powerful decision point.
Stay patient. Let the market reveal its hand. The next few candles around this trendline will likely dictate the next 1–3 day direction for BTC.

GU-Fri-6/06/25 TDA-This week mostly after news driven PA!Analysis done directly on the chart
Follow for more, possible live trades update!
PA= price action
This week unless you're good fundamental
analyst or taking good advantage of fundamental news,
it was not easy to trade normal price action. (at least for me)
Since I trade only London session, and majority of moves
happen in NY session after news release.
This week was not the best for me, keeping myself low risk
max medium risk trades.
Active in London session!
Not financial advice, DYOR.
Market Flow Strategy
Mister Y

GJ-Fri-6/06/25 TDA-Money flowing out of safe have assets, YEN!Analysis done directly on the chart
Follow for more, possible live trades update!
For those who don't understand safe haven assets
like YEN-Gold, it's gonna be really difficult to trade
these pairs.
These assets are heavily influenced by global events,
global tensions, trade wars, crisis.
Active in London session!
Not financial advice, DYOR.
Market Flow Strategy
Mister Y

06.06.25 Morning ForecastPairs on Watch -
FX:EURUSD
FX:AUDUSD
FX:USDJPY
FX:AUDCAD
A short overview of the instruments I am looking at for today, multi-timeframe analysis down to what I will be looking at for an entry. Enjoy!

3,367% or $3 to $124 in 1 week!🚀 $3 to $124 in 1 week or +3,367% is the kind of stock we all live for!
NASDAQ:SBET was May's power mover, let's see which one does this in June!

2025-06-05 - priceactiontds - daily update - nasdaqGood Evening and I hope you are well.
comment: Good day for the bears but if you look at the daily or 4h chart, do you really want to sell this? Of course not. Most traders will wait and see where the bears fail to long this for another try at 22000. Technically we had at least 3 legs up in this wedge and 21936 qualifies as a top. I would still not sell this yet. Favoring the bulls for some bounce, can be higher or lower high. Below 21390 I would be neutral and we could try to test down to 21200 or 21000.
current market cycle: trading range
key levels: 20700 - 22000
bull case: Bulls will likely be eager to buy close to the bull trend line which we have not touched since early Monday. Question then is, will we get a lower high or finally the 22000 print? You never know in advance. What you can know is that selling below 21600 is most likely a bad trade.
Invalidation is below 21390.
bear case: Bears getting more confident in shorting new highs since they make decent money doing so. Until we see 21000 again, they will still likely only scalp and not hold on to positions for longer. The bull wedge is too obvious to hold short and pray for a break. If bears would stay below 21700 tomorrow, that would certainly change their outlook and more bulls would start doubting that we can get to 22000. Daily 20ema is around 21200 and the bull trend line around 21400, those are the next targets for bears.
Invalidation is above 22100.
short term: Neutral but if I had to have a position, I’d be long with stop 21050. I will sit on hands and wait for bears to give up and scalp some longs tomorrow. If bears continue down, it will be without me because I don't like getting trapped.
medium-long term - Update from 2024-05-24: Will update this section more after the coming week but in general the thesis is as for dax. Down over the summer and sideways to up into year end. I don’t think the lows for this year are in.
trade of the day: Longing 21700 was a good trade a couple of times today. You could have made decent money doing so and then getting stopped out on the break below 21630 but that would have been still a profitable day. Get comfortable losing.

GOLD (XAUUSD) Technical Analysis – MMC Strategy Breakdown🧠 Conceptual Foundation:
This analysis is rooted in Market Maker Concepts (MMC), focusing on how smart money manipulates liquidity, traps retail traders, and shifts structure before making big moves. The GOLD market today gave us a high-probability setup that combined several key technical elements: SR interchanges, structure shifts, trendline breaks, and a major arc pattern.
Let’s dissect it step-by-step:
1️⃣ Initial Downtrend & Liquidity Sweep
In the early part of the chart, GOLD was in a clear bearish trend, forming lower highs and lower lows, consistently respecting a descending trendline. This downtrend attracted retail sellers who kept entering shorts, reinforcing the bearish sentiment.
🔻 However, right before the reversal, GOLD made a sharp move down to grab liquidity below previous lows near the $3,361–$3,364 support zone. This is a classic MMC liquidity trap — clearing out stop-losses of early buyers before initiating a reversal.
2️⃣ SR Interchange Zones (Smart Money Play)
Around the levels of $3,361 and $3,364, we noticed strong Support-Resistance Interchange (SR Flip) behavior:
These zones were first used as support during the initial decline.
Once broken, they acted as resistance, and again flipped to support post-breakout.
This flip signals institutional involvement — smart money often builds positions in these zones.
These interchanges also acted as the base of accumulation, preparing for a bullish breakout.
3️⃣ Trendline Breakout – Early Reversal Confirmation
As the price consolidated and coiled around the SR zones, it finally broke the descending trendline — a major reversal signal.
This breakout was accompanied by strong bullish candles, showing a sudden shift in momentum. It's likely that smart money stepped in aggressively, initiating a structure shift.
4️⃣ Arc Pattern Formation – Visual Clue of Accumulation
The most eye-catching part of this chart is the arc pattern — a rounded bottom formation. This type of pattern typically indicates accumulation phase, where institutions quietly enter positions while retail sentiment is confused or bearish.
🟡 The arc acts like a pressure cooker: as price coils and liquidity builds, it eventually explodes in the direction of accumulation — in this case, bullish.
5️⃣ Structure Shift – Confirmation of Bullish Intent
Once price broke above the internal structure (previous lower highs), it confirmed a structure shift from bearish to bullish.
📈 This is one of the most critical elements in MMC:
It tells us that smart money has reversed the flow.
The shift often leads to expansive moves in the new direction (as we saw here).
6️⃣ Next Reversal Area (Key Supply Zone)
Price continued surging upward and reached a predefined Reversal Area around $3,405–$3,410. This zone is likely to contain historical supply and institutional sell orders.
As expected:
Price showed early rejection signs from this level.
A potential short-term pullback or distribution phase may now be underway.
If bulls reclaim this zone, it may lead to further upside toward $3,420–$3,430.
📌 Key Technical Highlights:
Component Observation
Trendline Clean break signals momentum shift
SR Interchange Zones Strong demand re-entry near $3,361–$3,364
Arc Pattern Indicates bottoming and accumulation phase
Structure Shift Broke prior lower highs confirming bullish bias
Reversal Zone $3,405–$3,410 acting as resistance; possible rejection/pullback point
🔮 What to Expect Next?
If price rejects the $3,405–$3,410 zone again and forms a lower high, expect a pullback to $3,375–$3,380.
A break above the reversal zone with strong volume may open the door to new highs, targeting $3,420+.
Use caution around news events or high-impact fundamentals (e.g., USD data releases).
💡 Trading Strategy Ideas:
✅ Long Scenario (Already Played Out):
Entry: Post-trendline break + arc confirmation
TP1: Reversal Zone at $3,405
SL: Below $3,361 SR Flip
🔁 Potential Short Setup:
Entry: On bearish confirmation from $3,405–$3,410
TP1: $3,375
TP2: $3,364
SL: Above $3,412 (reversal zone high)
📢 Final Thoughts:
This chart is a great example of how MMC (Market Maker Concepts), when combined with clean price action tools like trendlines, SR zones, and structure shifts, can offer high-accuracy trades.
Don't chase price. Wait for zones to react. Let the market show its hand before taking action.

Gold Price ActionHello traders, hope you're all doing well!
Here's a straightforward setup that could yield 100–200 pips with ease.
Price has entered the inducement or "trap" area, but the true sell zone lies just above.
Look to enter short positions from that higher level and aim to capture some solid pips.

Is This the Optimal Entry After a PDL Sweep and FVG Retest?A clean structural development on CHFJPY (1H TF)
After sweeping the Previous Day’s Low (PDL), price created a bullish Break of Structure (BOS) to the upside , shifting short-term sentiment. This BOS was followed by a precise retest into a Fair Value Gap (FVG), suggesting possible continuation as liquidity shifts from weak hands to strong.
🧠 Educational Notes :
CRT Sweep Logic: Market often sweeps the previous day's high or low before making its true move. In this case, a clean PDL sweep was followed by a strong bullish reaction.
Break of Structure (BOS): Confirmed bullish intent after the sweep, validating a shift in order flow.
FVG Retest: Institutional pricing inefficiency filled — a classic SMC continuation behavior.
Entry Thesis: Based on reaction from FVG + BOS confirmation, with invalidation below the swept low and TP near the previous swing high.
This setup is not financial advice, but a clear visual case study for traders applying SMC + CRT logic.

EURAUD - Bearish... but not for long!Hello TradingView Family / Fellow Traders. This is Richard, also known as theSignalyst.
As per our last EURAUD analysis, attached on the chart, it rejected the upper bound of the blue channel and traded lower.
What's next?
📈EURAUD is now retesting the lower bound of the channel.
Moreover, the blue zone is a strong demand.
🏹 Thus, the highlighted blue circle is a strong area to look for buy setups as it is the intersection of the lower blue trendline and demand.
📚 As per my trading style:
As #EURAUD is around the blue circle zone, I will be looking for bullish reversal setups (like a double bottom pattern, trendline break , and so on...)
📚 Always follow your trading plan regarding entry, risk management, and trade management.
Good luck!
All Strategies Are Good; If Managed Properly!
~Rich
Disclosure: I am part of Trade Nation's Influencer program and receive a monthly fee for using their TradingView charts in my analysis.

05.06.25 Morning ForecastPairs on Watch -
FX:AUDUSD
OANDA:XPTUSD
A short overview of the instruments I am looking at for today, multi-timeframe analysis down to what I will be looking at for an entry. Enjoy!

EURAUD - Bullish... but not for long!Hello TradingView Family / Fellow Traders. This is Richard, also known as theSignalyst.
📈EURAUD has been overall bullish trading within the rising channel marked in blue. However, it is currently retesting the upper bound of the channel.
Moreover, the green zone is a strong structure and resistance.
🏹 Thus, the highlighted red circle is a strong area to look for sell setups as it is the intersection of the upper blue trendline and resistance.
📚 As per my trading style:
As #EURAUD is around the red circle zone, I will be looking for bearish reversal setups (like a double top pattern, trendline break , and so on...)
📚 Always follow your trading plan regarding entry, risk management, and trade management.
Good luck!
All Strategies Are Good; If Managed Properly!
~Rich
Disclosure: I am part of Trade Nation's Influencer program and receive a monthly fee for using their TradingView charts in my analysis.

GJ-Thu-5/06/25 TDA-Big pump and dump, pre and after US news!Analysis done directly on the chart
Follow for more, possible live trades update!
Trading news is not profitable long term, unless
you are really good fundamental analysis!
Yes, you might get lucky sometime that price
goes to your favor, but without a clear understanding,
bad risk management, no strategy you'll likely to lose
all the profits you make.
It's not just about making profits, you have to consistently
making it and keep the profits you make.
Active in London session!
Not financial advice, DYOR.
Market Flow Strategy
Mister Y

GU-Thu-5/06/25 TDA-US bad data report, GU tapped WR 1.35790!Analysis done directly on the chart
Follow for more, possible live trades update!
Market conditions shift, you have to learn to
adapt to it. Trading price action, you learn to
react to the market. The way the candles moves
differently it might indicates shift of market
dynamics.
Active in London session!
Not financial advice, DYOR.
Market Flow Strategy
Mister Y
