#M30 BUYING MODULEIn this analysis we're focusing on M30 time frame for GOLD. Here we see clearly that price creates Bullish trendline and also price give respect to the trendline. According to price action and my analysis I'm expecting that price come back and retest my zone, and observe the reaction of price. If price give any bullish confirmation than we'll execute our trade. This is M30 time frame analysis once price reaches our zone switch to the lower time frame to find perfect entry point. Let's delve deeper into these levels and potential outcomes.
Always use stoploss for your trade.
Always use proper money management and proper risk to reward ratio.
This is my analysis.
#XAUUSD 30M Technical Analysis Expected Move.
Priceaction

#GBPJPY UPDATES AND ANALYSISGBPJPY 4H Chart Analysis
GBPJPY is exhibiting strong bullish structure on the 4H timeframe, with price currently forming higher lows and holding above a key ascending trendline. The marked demand zone around 189.94 has acted as a support area, suggesting potential accumulation before the next leg up.
A bullish continuation is anticipated with three structured targets aligned at:
Target 1: 191.773
Target 2: 193.320
Target 3: 194.832
The setup provides a favorable risk to reward scenario. A break and close below the demand zone and ascending trendline support would invalidate this bias. This is a higher time frame key levels. When price enters in our zone, look for confirmation in smaller time frame before executing your trades. Confirmation is key.
This just my analysis. Use proper stoploss and proper money management for your trade.
#GBPJPY 4H Technical Analysis Expected Move.

AAL in a massive Weekly Demand! OptionsMastery:
🔉Sound on!🔉
📣Make sure to watch fullscreen!📣
Thank you as always for watching my videos. I hope that you learned something very educational! Please feel free to like, share, and comment on this post. Remember only risk what you are willing to lose. Trading is very risky but it can change your life!

GOLD(XAUUSD) -Weekly Forecast,Technical Analysis & Trading IdeasMidterm forecast:
2772.38 is a major support, while this level is not broken, the Midterm wave will be uptrend.
TVC:GOLD OANDA:XAUUSD
Technical analysis:
A trough is formed in daily chart at 2956.50 on 04/07/2025, so more gains to resistance(s) 3357.00, 3500.00 and more heights is expected.
Take Profits:
2833.00
2879.11
2955.00
3057.40
3160.00
3257.03
3357.00
3500.00
__________________________________________________________________
❤️ If you find this helpful and want more FREE forecasts in TradingView,
. . . . . . . . Hit the 'BOOST' button 👍
. . . . . . . . . . . Drop some feedback in the comments below! (e.g., What did you find most useful? How can we improve?)
🙏 Your support is appreciated!
Now, it's your turn!
Be sure to leave a comment; let us know how you see this opportunity and forecast.
Have a successful week,
ForecastCity Support Team

2025-05-05 - priceactiontds - daily update - daxGood Evening and I hope you are well.
comment: Historic rally we are witnessing. This move is as unlikely, climactic and overdone as can be. Yet we only move higher. Can’t short this yet. Bulls in full control, don’t fight it.
current market cycle: trading range
key levels: 21000 - 24000
bull case: Bulls will likely go for 24000 over the next days. Since no bears are around, try to find any decent pullback to long until it stops working. I think bulls should keep this above the 1h 20ema or we might test down to the bigger trend line around 23000.
Invalidation is below 23300.
bear case: Bears need consecutive closes below the 1h 20ema. Simple as that. Then they can test the big bull trend line around 23000. Unless we get a huge news bomb bear surprise, this will most likely continue higher or at least the next bigger pullback gets bought. Bears are not making money at all, so don’t try to be the hero bear.
Invalidation is above 23550.
short term: Neutral. Will only long on a pullback to 15m or 1h 20ema and if market refuses to go down, as it did today with the 15m 20ema. I will become bearish below 23000 but only after market retested the highs and printed a credible top. A big bear news could change that but for now it’s unlikely.
medium-long term from 2024-03-16: Bear trend is over. My rough guess for now is that we will stay inside this trading range 19000 - 24000 for much longer or until economic data becomes the shitshow I expect it to become over the next months.
trade of the day: Buying near the 15m 20ema.

BTCUSD – Discount Zone Play | Long Setup Loading📉 BTCUSD – 15-Minute SMC Breakdown | May 3, 2025
Bitcoin is cooking up something spicy inside this discount zone. All the ingredients are there for a bullish reversal — we just need the final confirmation to execute the long.
🧠 SMC Breakdown:
POI Identified: Price has broken into a key OB discount zone (61.8%–79%), tapping 70.5% and chilling near the 79% fib retracement.
Weak High: Noted above at ~96,950 – a liquidity target ready to get swept.
Price Structure: Series of lower highs and lows forming bearish structure, but no momentum break yet. We're in accumulation range.
🎯 Entry Criteria (Potential):
Wait for CHoCH (Change of Character) on lower timeframes (e.g., 1min or 5min) to confirm reversal intent.
Ideal entry = bullish engulfing or BOS from within the 70–79% zone
SL = below 95,900 (clear invalidation level)
TP = Weak High → 96,950+
RR Potential = ~1:5+
📌 Why This Matters:
Price is deep in premium vs. discount logic.
Smart Money loves entries in the 70–79% retracement zones — it’s the sniper's nest.
That Weak High = unfinished business. Expecting bullish expansion if this zone holds.
📊 Pro Tips:
Wait for confirmation, don’t blindly buy in the zone.
Look for signs of absorption or bullish reaction candles.
Always map invalidation level BEFORE entering.
🔥 Final Note:
This is the “load-the-clip” zone for Smart Money. No hype, just structure. If BTC reacts here, we could see a clean 1:5 RR into that Weak High.
💬 What do YOU think happens next?
💾 Save this setup – it’s textbook.
🔁 Share this with your trading squad & don’t miss the next wave.

EURUSD directional bias: BuyPrice has closed above a key 4h resistance level. Based on the higher timeframe direction, I am expecting price to continue upwards to the recent high (1.5568).
Please be aware that we have a USD Interest Rate release on Wednesday which could cause a lot of volatility in the market. Keep this in mind if you decide to trade this direction.

One Last Drop Before Take Off?Price is still in a pullback phase, and the next potential target zone is around 0.07488 – 0.07334.
We might see one last dip before BINANCE:STPTUSDT resumes its uptrend.
If the price reaches this pullback zone with a bullish divergence, that would be a strong confirmation for a possible reversal.
But even without divergence, we can still rely on candlestick patterns to signal a potential reversal at that level.
What do you think — will BINANCE:STPTUSDT bounce from this zone or break lower?

CHFJPY: Pullback From Support 🇨🇭🇯🇵
There is a high chance that CHFJPY will pull back from
the underlined intraday horizontal support.
As a confirmation, I see a bullish imbalance candle
after a release of today's Swiss CPI data.
Goal - 175.37
❤️Please, support my work with like, thank you!❤️
I am part of Trade Nation's Influencer program and receive a monthly fee for using their TradingView charts in my analysis.

ORDIUSDT — channel, high risks, high rewards.ORDI is the first BRC-20 token based on the Ordinals protocol on Bitcoin. Since its launch in March 2023, the token quickly gained popularity and a significant market cap, being integrated into the Bitcoin blockchain. This integration is made possible through the Ordinals protocol developed by Casey Rodarmor. The protocol allows inscriptions - text, images, audio, or video - to be made directly on satoshis, the smallest unit of Bitcoin, giving Bitcoin new functionality that was not originally envisioned. You can now create NFTs and other digital assets and trade them directly on the blockchain.
____________
The token was listed at a fortunate time - late 2023 - amid overall market growth and positive sentiment. At the time, everything looked promising, but now the price has dropped by 94% from the zones where “hype was being sold.”
🔻 Structure:
The token is moving within a large descending channel. Recently, the price tested the outer support of this channel.
A local downtrend channel was also broken - its retest and a rise within the main trend are possible.
📊 Scenarios:
Retest and upward movement as part of a correction.
Consolidation in the current zone with a possible breakout to the upside.
Further decline amid overall negative market sentiment.
💥 Risks:
The token is traded on all major exchanges, including Binance. However, if it gets delisted (which has been happening more often recently), this is the main risk: loss of liquidity!
🎯 Approach:
With such tokens, it’s crucial to distribute volume wisely and accept risk in advance. I mark out interesting zones and place limit orders accordingly.
Considering the overall market and news backdrop, the token does have bounce potential, especially now that faith in the project is nearly lost.
💭 Opinion:
From my years of experience, I’ll say it again: the goal isn’t to guess where the price will go - it’s to be ready for it. Not everyone will understand that, but then again, not everyone consistently makes money in this market.
_________
📌 Not financial advice. This material reflects personal observations and a risk management approach.

GJ-Mon-5/05/25 TDA-No sense of direction at the moment!Analysis done directly on the chart
Respect to all those who struggle, try, fail,
try again and repeat over and over again.
If we don't fail, we won't even succeed!
Journal your journey, compared to yourself
1 week ago, 1 month ago, 3 months ago,
6 months ago, 1 year, 2 years, 3 years and so
on. The question is have your noticed some
good changes or improvements? If not, what
are you doing wrong and what can you improve?
From somewhere we have to start, right?
Comment down below your thoughts!
Not financial advice, DYOR.
Market Flow Strategy
Mister Y

GU-Mon-5/05/25 TDA-Slowly approaching to daily support 1.32496Analysis done directly on the chart
Fed and BoE rate decision this week affecting
heavily on GU and other dollar and gbp related pairs.
Trade safe, stay informed with basic economic calendar
check. I personally use FXstreet economic calendar.
You can be very good at technical analysis but without
fundamental understanding you'll likely get a lot of stop
losses.
Not financial advice, DYOR.
Market Flow Strategy
Mister Y

05.05.25 Morning ForecastPairs on Watch -
FX:USDCHF
FX:AUDUSD
FX:AUDCAD
FOREXCOM:COFFEE
A short overview of the instruments I am looking at for today, multi-timeframe analysis down to what I will be looking at for an entry. Enjoy!

Institutions Are Loading EUR/NZDIn the current market context, EURNZD is showing a highly compelling technical and fundamental structure for both short- and medium-term opportunities. After a prolonged retracement from the March highs, the price has strongly reacted from a clearly defined weekly demand zone between 1.8712 and 1.8600.
From a technical perspective, this reaction aligns with a moderate RSI divergence and a still intact macro bullish market structure, despite the corrective nature of recent weeks.
However, what truly validates this setup goes beyond price action alone. The latest Commitment of Traders (COT) data strongly supports the long thesis. On the euro side, we observe a significant increase in commercial long positions (+14,659 contracts), signaling institutional hedging activity. At the same time, non-commercials (speculators) have been cutting their short positions, suggesting growing expectations of euro strength.
On the NZD side, the picture is even more decisive: non-commercials maintain a net short position of -40,444 contracts, with a further reduction in long positions. The speculative sentiment toward the NZD is clearly bearish and shows no signs of short-term reversal.
Adding to this, retail sentiment data currently shows that 59% of retail traders are short on EURNZD. From a contrarian perspective, this is particularly bullish — the crowd is selling while smart money is buying.
Seasonality also supports the setup: historically, the months of May and June have been positive for the euro and negative for the NZD, adding an additional statistical layer of confluence to the trade idea.
🎯 Conclusion
We may be witnessing the early stages of a new bullish leg on EURNZD. The 1.89 area represents a potential re-entry zone in the event of a retest. The medium-term target is set between 1.9300 and 1.9500.
Technical structure, institutional positioning, retail sentiment, and seasonality all align in favor of a clear bullish bias in the coming weeks.

Gold: Will 3,260 Flip From Supply to Springboard?Micro Gold Futures — 30 min chart
BULLISH ABOVE 3,260 | BEARISH BELOW
🗺️ Structure in Focus
Macro bias (4 h/1 D): remains bearish — lower highs & lows since late‑April.
Intraday context: price climbing in a rising channel; buyers defend each channel low since 1 May.
Grey zone 3 255‑3 260:
• 61 %‑78 % Fib retrace of the last leg down
• Breakdown base now acting as supply
• Mid‑channel + intraday VWAP overhead
A decisive H1 close above 3 260 plus a bullish retest flips the bias long toward ≈ 3 280.
🧭 Trade Map
🔴 Base‑case short
• Trigger – bearish reaction inside / below 3 255‑60
• Targets – 3 230, then 3 210 (-27 % Fib extension)
• Invalidation – H1/H4 close > 3 260
🟢 Flip‑bull plan
• Trigger – H1 close above 3 260 and zone holds as support
• Target – 3 280 supply (channel top + prior S/R)
• Invalidation – H1 close back under 3 250
(Risk ≤ 1 % per idea; scale out at interim levels.)
📊 Narrative to Watch
Fed speakers & US data could jolt real yields and gold flow.
Asia session often sets the tone—watch Shanghai physical premium chatter.
Softening DXY gives the upside‑break thesis a tail‑wind.
What’s your play—fade the zone or ride the breakout? Smash the boost 🔥 and follow for live updates!
Not financial advice; just sharing my plan.
Tags: #Gold #XAUUSD #Futures #PriceAction #Fib #TechnicalAnalysis

#202518 - priceactiontds - weekly update - bitcoinGood Evening and I hope you are well.
comment: Only Thursday was bullish and right now market is trying to decide if this breakout was legit or not. If bulls can stay above 95000, the breakout above has a higher chance of being succesful. Below 94000 it has likely failed and I favor the bears for more downside.
current market cycle: weekly chart says continuation of the bull trend but i highly doubt it. much more likely we are in a big trading range 73000 - 110000
key levels: 85k - 100k (if bears somehow manage to get below 85k again, we test 80k next)
bull case: Bulls want this breakout to be the start of the third leg up for 100000. That’s all there really is to it. Bull trends need higher lows and higher highs and if bulls fail to prevent the market from falling below the breakout bar under 94000, this was likely a bull trap.
Invalidation is below 94000.
bear case: Bears want a trading range 70000 - 98000 and not let market hit 100000 again because that would for sure attract more degenerates again. Bears really don’t have much here until they print a decent bear bar that gets below 94000. This looks as bullish as can be and above 98000 I expect 100k to be hit.
Invalidation is above 101k.
short term: Neutral. Below 94000 it’s likely a failed breakout and above 97000 we can expect 100000 or more. Above 100000 there would not be a reason not to go for a new ath, same as for other markets like dax.
medium-long term - Update from 2025-04-13: Bear targets for this year are met. Now we likely range before we get new impulse to either side. I wait for market reaction around 100000 before I write more here. For now my assumption is still that this will be a trading range 73000 - 100000 for longer than a retest or even new highs.

#202518 - priceactiontds - weekly update - oilGood Evening and I hope you are well.
comment: Bears defended the breakout area and kept the market in a bear trend. Bulls tried to print a higher low with a decent bull reversal bar on Thursday. Now what? No idea. Oil below 60 is a big thing and staying below is somewhat low probability, given the past 6 years. The chart is still pretty bearish and if you want to be a bull and look at this, would you be thrilled to buy it at 58? I’m not sure. If you could hold below 53 and add lower as well, sure but as of now, bulls have not done enough to convice me this is a credible bottom.
current market cycle: trading range on monthly tf and bear trend on the daily
key levels: 54 - 65
bull case: Bulls want to keep Thursday the higher low and go up from here. Above 60 they are slightly favored to test 62/64 again but one could also draw another bear trend line from 71.66 to 63.9 from last Monday. So buying here is not favorable, no matter how you look at this chart. Only above 65 do bulls take control again and can test the next bigger bear trend line around 67.
Invalidation is below 54.
bear case: Bears kept the bounce around the breakout area from the W1 low. Now they need to make lower lows to confirm the acceleration of this bear trend. If they fail, this will become fuel for the bulls to test back up to either 67 or even the W2 high at 71.66. My line in the sand for the bears is a daily bull bar close above the daily 20ema. If bulls can get that, I think more bears will give up. Until then, bears are slightly favored, especially below 56.29 to test 54.48 again.
Invalidation is a daily close above 62 and for sure anything above 65.
short term: Neutral around 58. Below 56.29 I think we can do 54.48 or lower and above 62 I expect more upside for 64 or higher.
medium-long term - Update from 2025-04-27: This does look like another bear trap below 60, which was to be expected.

#202518 - priceactiontds - weekly update - nasdaqGood Evening and I hope you are well.
comment: Bulls want at least 20536 now and run all the stops from before the big sell-off. Bears are not doing anything at all, so bulls will likely get it. This could be a breakout-retest and I marked the area for that with the red rectangle. Small chance bears come around next week but for now it’s too early to short and buying into 9 consecutive bull days is statistically beyond moronic.
current market cycle: trading range
key levels: 15500 - 23000 (upper range is a guess, could also become 21000 but for now we don’t know so I assume the higher price)
bull case: 20536 and then 21000. Those are the next targets and bulls are in full control of the market. The measured move from the buy spike at the lows is around 22350 and it’s possible that we get there. I think we need to see a pullback and how deep that will be. If we get only another sell spike and immediate buying for higher highs, we can also assume much higher prices. Above 21100 there is no reason not to go for 23000.
Invalidation is below 19100.
bear case: Bears have nothing. Below 19100 market is neutral but until then, selling this is dumb. Wait for more bears to appear or at least seeing something that resembles a topping pattern. Like a lower high on the 1h chart. Don’t try to be the lucky bear who shorted the exact high.
Invalidation is above 21100.
short term: Neutral. No interest in buying such a buy climax but it’s way too early for shorts. Patience is key.
medium-long term - Update from 2024-04-26: My most bearish target for 2025 was 17500ish. Now I assume we will be in a trading range 16000 - 23000 for much longer.

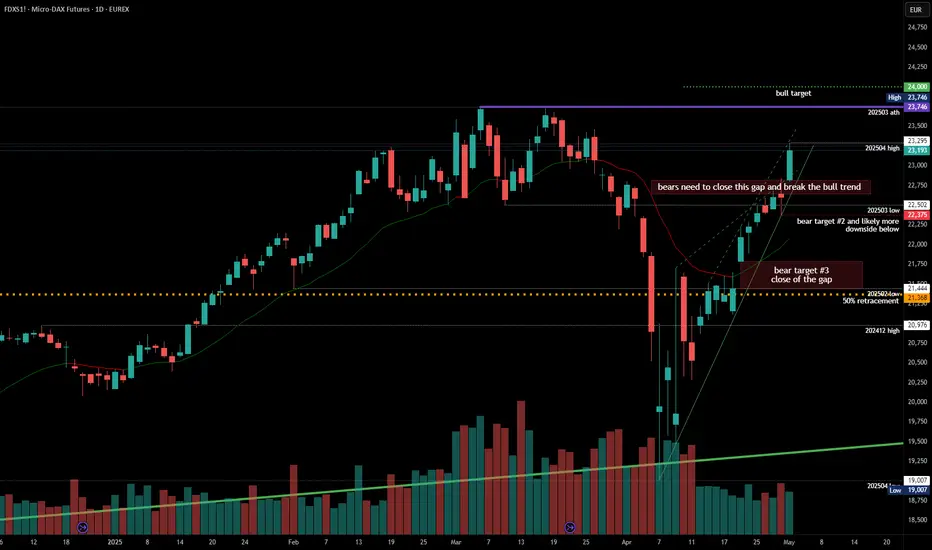
#202518 - priceactiontds - weekly update - daxGood Evening and I hope you are well.
comment: No one knows if this will be a lower high or a new ath. It does not matter. Buying up here is bad no matter how you look at it. Sure it can be good for a scalp but any bull stop is far away. Until bears start closing gaps, bulls remain in full control. Make no mistake, this is one of those instances where economic reality and market is so far apart that you will look back in hindsight for not going bigger on the shorts once it turns. Can become easily the trade of the year.
current market cycle: trading range
key levels: 19000 - 24000
bull case: Another strong breakout by the bulls on Friday. We are in a clear third leg which could get us to 24000 or become a lower high, you never know in advance. Move is on low volume and climactic that once this turns, it will most likely be violent. There are no reasons for bulls to be up here except a short squeeze. So naturally I doubt we could go much above 24000 if we get there at all.
Invalidation is below 21900.
bear case: Bears still have nothing. No selling pressure what so ever, so path of least resistance is up. The first pullback will likely be bought but that depends on how deep it is and if we get one at all. Bears know this is as very tight and unsustainable bull channel up but that does not matter because market already made 22% from the lows. Which by itself is beyond insane. I do think bears need bad news to ignite the selling. We could easily stay another couple of weeks up here before it turns again.
Invalidation is above 24100.
short term: Neutral. Getting bullish after this parabolic buy climax is moronic but we are not seeing any selling pressure, so I will just sit on hands.
medium-long term from 2024-03-16: Bear trend is over. My rough guess for now is that we will stay inside this trading range 19000 - 24000 for much longer or until economic data becomes the excrementshow I expect it to become over the next months
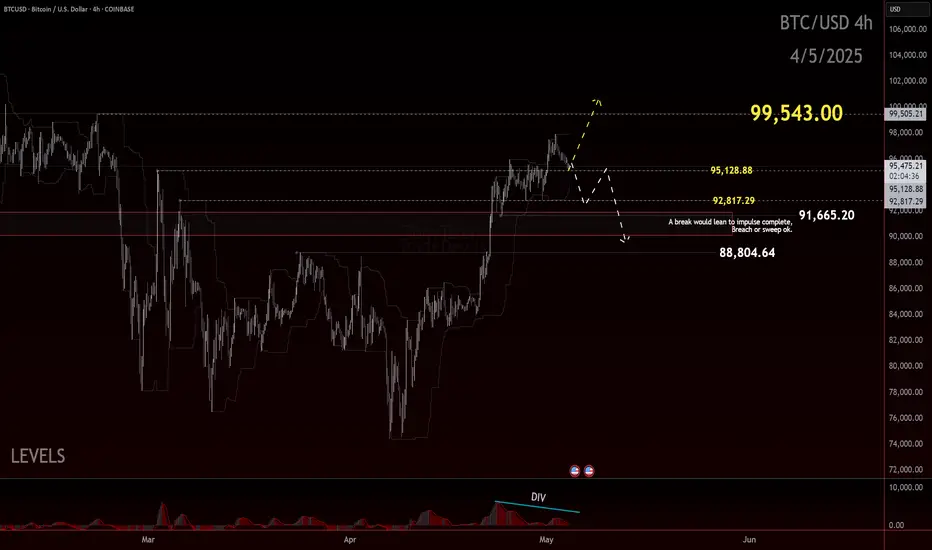
BTC: Balancing on the EdgeBitcoin held the $90.5K level and managed to flip prior resistance into support—an encouraging development, especially given how close price was hovering to the so-called danger zone. That flip marked a technical win for bulls, signaling potential strength in the short-term structure.
However, we’re not entirely out of the woods just yet.
While price is holding above support and showing some resilience, we’re still trading uncomfortably close to the edge of the recent consolidation zone. For now, $91.5K stands as the ideal level to hold.
The concern? If price starts slipping back below this newly established support, especially with conviction, that could be a signal of deeper retracement on the table. The bullish narrative would weaken significantly if we revisit and fail to defend those levels, potentially opening the door for a more sustained correction.
So, while the short-term structure remains cautiously optimistic, this isn’t the time for complacency. The market’s still in a precarious spot, and clarity will only come with either continued strength—or a confirmed break below support.
Eyes on $91.5K for now. Hold that, and the momentum favors the bulls. Lose it, and the deeper pullback scenario comes back into play.
Trade Safe, Trade Clarity.
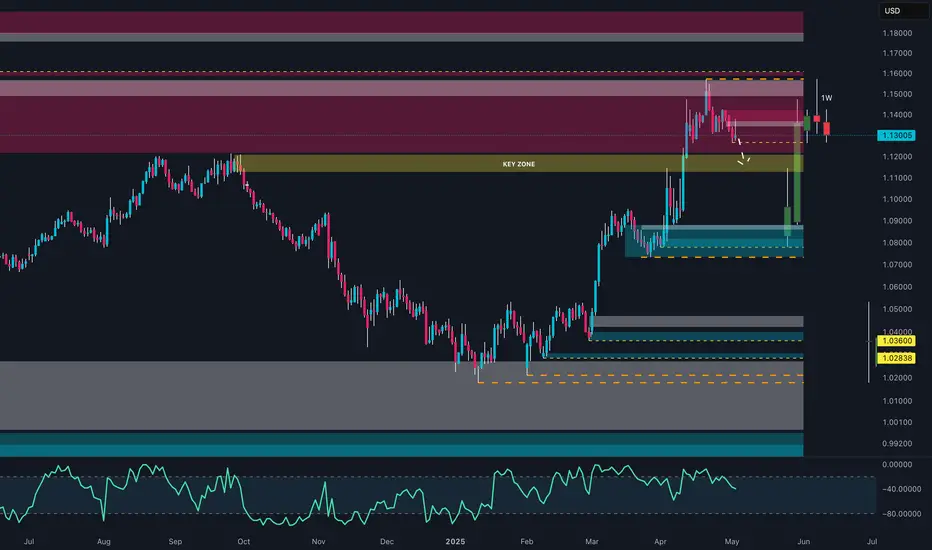
Did They Buy the Bottom? EUR/USD Set for Another Reversal!After an explosive bounce from the 1.0800–1.0850 demand zone, EUR/USD is now in a key structural retest around 1.1300. The COT data shows a net increase in long positions by Non-Commercials, but with the Dollar still holding structural strength in its own COT report and an RSI showing bearish divergence, this area may act as a key zone for price discovery.
📊 WHAT THE DATA SAYS:
📉 Price Action: Clear rejection from the 1.1450–1.1550 supply zone. Retest at key structure near 1.1300.
📑 COT (EURO): Net long positions up by +183 (196,388 long vs 120,591 short) = bullish tone.
📑 COT (USD): Still balanced, but Non-Commercials are reducing net longs → potential weakening.
📊 Retail Sentiment (MyFXBook): 70% retail traders are short = contrarian long bias remains.
🌱 Seasonality (May): Historically negative for EUR/USD (–0.0088) = potential downside pressure ahead.
📌 Key Levels:
Resistance: 1.1450 / 1.1550 (Supply Zone)
Support: 1.1300 (Structural retest) — 1.0850 (Strong demand)
📉 BASE SCENARIO: Pullback toward 1.1100–1.1050 before renewed long accumulation.
📈 ALTERNATIVE SCENARIO: Break above 1.1450 could target 1.1600–1.1720 zone.
🔍 Watch out for May's seasonal inversion and extreme speculative positioning — fakeouts may precede real directional moves.
"Bitcoin traders... The real money is made BEFORE the breakout"🚨 Bitcoin (BTCUSD) Showing Smart Money Blueprint in Action!
Let's break it down clearly:
📈 Context:
After a period of compression, we got a strong liquidity sweep at the highs.
Price quickly rejected, causing a sharp market structure break.
📉 Downward Trendline + Liquidity Build-Up:
Notice how price has been hugging a descending line while leaving clear liquidity pockets ($$$) above.
This means Smart Money is trapping buyers into bad longs before the expansion.
📍 Critical Level: CRT Low (Current Range Low)
Price has aggressively returned to mitigate near the CRT Low area (marked red).
Perfect zone for Smart Money to reload before the next expansion.
📍 Entry Confirmation:
Watch for bullish reaction signs off the CRT Low.
If price holds above, we are likely to witness an explosive upside move targeting the previous liquidity pools.
🎯 Target Zones:
Immediate liquidity above (around $94,700 - $95,000).
Secondary target at CRT High area ($95,400+).
🧠 Market Psychology at Play:
CRT Low is a beautiful example of engineered liquidity, where emotional sellers are stopped out and Smart Money absorbs entries.
The goal is to trap the impatient and reward the patient.
⚡ Game Plan:
Be reactive, not predictive: Wait for bullish price action confirmation.
Partial profits at first liquidity zone, trail stop for extended targets.
R:R ratio on this setup is beautifully in our favor.
🚀 Risk Management Tip:
Risk only what you're willing to lose.
Even the best setups can fail — it’s part of the game.
Good trading is consistent execution, not perfection.
✍️ To sum up:
This BTCUSD chart is textbook Smart Money play:
Liquidity sweep ➡️ Break of structure ➡️ Mitigation ➡️ Expansion
If you time your entry well, this could be one of the cleanest setups into the weekly close! 🔥
➡️ Comment "BTC READY" if you're eyeing this move with me!
➡️ Save this post for future Smart Money analysis references!

"BTC Just Slammed Into a Major OB! Will Bears Strike Back Hard?"⚡ BTCUSD Analysis - 4H Timeframe | April 28, 2025
📈 What's Happening:
BTC has pushed deep into the Premium Area and wicked into a key Order Block (OB).
Strong bearish reactions are starting to show = potential trap for late buyers! 🚨
🚨 Critical Levels Highlighted:
Strong High = Main invalidation level (~99,999).
Order Block (OB) = Primary supply zone where Smart Money could step in.
Weak Low = Major liquidity target (~74,458).
🧠 Key Observations:
Smart Money hunted liquidity by forcing price into Premium.
OB Reaction shows potential rejection = perfect sniper hunting zone!
If bears step in, that Weak Low will be the magnet 🧲.
🎯 2-SCENARIO PLAN:
Plan A — Short Setup (Main Bias):
✅ Watch for strong bearish reaction inside the OB.
✅ Confirm short entries with bearish structure shift on M15/M5.
✅ TP1 = Minor lows around 88,000–90,000. TP2 = Full Weak Low sweep (~74,458).
✅ SL = Above Strong High (~99,999).
Plan B — Breaker Play (Alternative):
✅ If BTC breaks Strong High cleanly, flip bias to bullish.
✅ Look for Breaker retest setups targeting new highs.
📊 Risk Management Tip:
"Patience at Premium Zones = Maximum Risk-to-Reward setups. No chasing allowed."
🧘♂️ Summary:
✅ Liquidity Swept
✅ OB Reaction Starting
✅ Premium Area Reached
✅ Weak Low Target In Sight
🔥 Smart Money has a saying: "Trap first, profit second."
➡️ Save this setup to your playbook!
➡️ Comment "TRAP THEN ATTACK" if you're locking in for that premium sniper shot! 🧨
