BTCUSD Weekly Structure Analysis – Bearish Trend + Target🔍 Overview:
Bitcoin has shown us a classic market structure shift, moving from bullish strength into a clear bearish retracement, all while respecting major zones and smart money concepts. This current price action highlights a Bearish Break of Structure (BOS), followed by a continuation move toward a key demand zone, which we are eyeing for the next potential reversal opportunity.
🧩 1. TRC Breakout & Early Bull Run
The chart shows a strong bullish phase starting from November 2024, which peaked in late May 2025.
The TRC (Trendline Resistance Channel) Breakout marked the shift from lower highs to higher highs.
This breakout was the initial sign of bullish strength, leading to a break of structure (BOS) around the $108,000–$110,000 level.
⚠️ 2. BOS Confirmed – Structure Starts to Crumble
Once price reached the reversal area near $112,000 (supply zone), we saw a failure to form new highs.
The Bearish BOS was confirmed when price failed to hold support and aggressively broke below the previous higher low.
This BOS is our first confirmation of trend exhaustion and a transition into bearish structure.
🧠 3. Structural Analysis & Smart Money Behavior
Notice how price moved sideways near the top before dropping — a typical distribution phase.
This is where smart money distributes positions to retail buyers at the top before the markdown.
After the BOS, each lower high confirmed the bearish market structure, with no strong bullish CHoCH in sight.
🧱 4. Major CHoCH & Interchange Zone
Look lower on the chart — the SR Interchange Zone around the $76,000–$78,000 area is significant.
This acted as resistance in early 2025, flipped into support later, and now stands as a potential Major CHoCH (Change of Character) if price revisits and reverses here.
If price respects this zone again, it could mark the next bullish accumulation phase.
🎯 5. Current Target: $83,000–$85,000 Zone
Based on structural behavior, liquidity voids, and past interaction, our short-term target is the $83,000–$85,000 demand zone.
This area is marked as “Target + Next Reversal” on the chart.
We expect either:
A reaction and reversal from this zone
Or a deeper push toward SR Interchange depending on volume and macro triggers
🧮 Key Technical Breakdown:
Component Observation
Trendline Break TRC Breakout in February
Bullish BOS Confirmed around $108,000
Reversal Area ~$112,000 (Supply/Distribution)
Structure Shift Bearish BOS confirmed
Current Target $83,000–$85,000
CHoCH Potential $76,000–$78,000
Bias Bearish short-term
🧠 Trading Wisdom:
“Structure tells the story — price action confirms it.”
Always analyze shifts in structure, not just candle patterns. BOS and CHoCH are some of the most reliable tools in understanding true market intent, especially when aligned with high-volume reversal areas.
✅ Final Thoughts:
Bitcoin is currently in a controlled retracement phase, and we are watching closely how price behaves near the $83K–$85K demand zone. If that fails, the deeper SR Interchange at ~$76K becomes the next high-probability zone for long entries.
This is a time to be patient, analyze clean structure, and ride with smart money, not against it.
Priceaction

Gold Analysis Weekly (XAU/USD) – Bullish Pennant + Target🔍 Overview:
The XAU/USD (Gold) chart is displaying a textbook Pennant Pattern, and we are witnessing a powerful bullish breakout from this structure. This is a great example of how price consolidates before continuing its larger trend — in this case, upward.
Let’s break down each major component of the pattern and price behavior:
🧩 1. The Pennant Pattern – Continuation Structure
A Pennant typically forms after a strong impulsive move (flagpole), followed by a period of consolidation where price creates lower highs and higher lows, forming a triangle-like shape. This structure reflects market indecision, but it’s usually a pause before continuation.
In our case:
The rally in March–April built the flagpole
The April–May consolidation formed the pennant
The recent breakout signals trend continuation
🎭 2. Fake First Move – Classic Trap!
One of the key traits of pennants is the initial fake breakout—and that’s exactly what happened here.
The chart shows an early bearish break, which was a liquidity grab or fake move meant to trap retail traders who entered short too early.
Smart money often uses such tactics to create imbalance and then reverse the market in the opposite direction.
🔄 3. Major CHoCH (Change of Character)
Following the fake move, price reversed aggressively, breaking internal structure and forming a Major Change of Character (CHoCH).
This was the first signal that the bulls were back in control and that the bearish pressure was only temporary.
🧱 4. Major BOS (Break of Structure) & Trendline Break
The decisive move came next — when price broke above the upper trendline of the pennant and took out previous highs.
This break is what we call a Major BOS (Break of Structure) — a strong confirmation that the market is shifting from consolidation back into trend mode.
The breakout was backed by momentum candles, indicating institutional activity.
🎯 5. Target Zone: $3,700–$3,750 (Reversal Area)
Using the measured move technique (height of the flagpole projected from breakout point), the calculated target zone lies between $3,700 and $3,750.
This area is also marked as a potential reversal or profit-taking zone, so we might expect:
Partial pullback
Sideways action
Or even a deeper correction before continuation
📚 Key Technical Insights:
Component Observation
Pattern Bullish Pennant
First Move Bearish Fakeout
Confirmation Signal CHoCH + BOS
Trendline Break Yes, confirmed
Target Zone $3,700 – $3,750
Current Price ~$3,290 (at time of writing)
Bias Strong Bullish (short to mid-term)
🧠 Educational Takeaway:
“The first move is often the fake move.”
This is a golden rule in trading consolidation patterns like triangles and pennants. Always wait for confirmation (CHoCH + BOS) before committing capital to a trade. This strategy avoids traps and puts you on the right side of the market.
✅ Conclusion:
Gold (XAU/USD) has completed a successful bullish pennant breakout, and all key confirmations are in place.
We’re now eyeing the $3,700–$3,750 zone as the next target — with the potential for either reversal or continuation depending on how price reacts.
Keep an eye on this chart — the next few sessions could offer great setups for both swing and position traders.

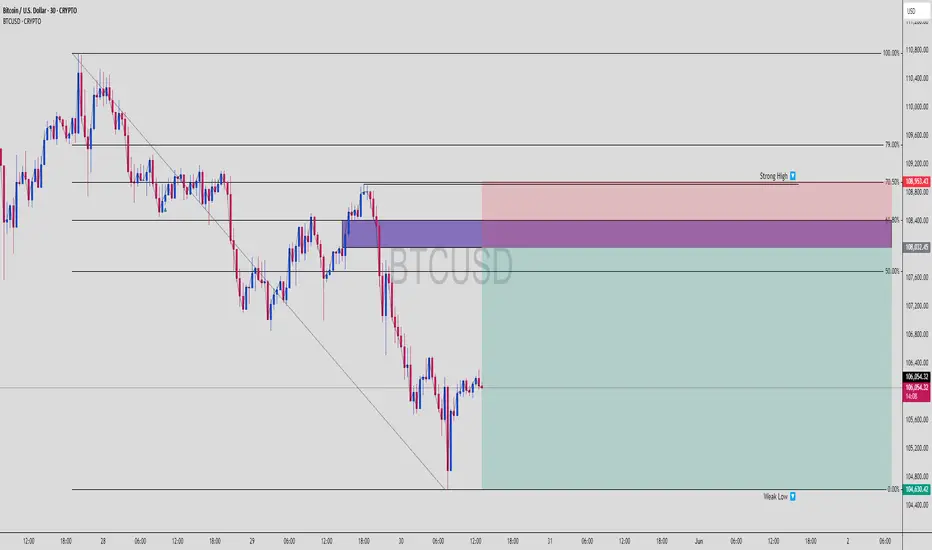
BTCUSD SMC Short | 70.5% Fib + OB Rejection Incoming?BTCUSD | High Risk-Reward Setup at Key Supply Zone 🔥
This Bitcoin setup is setting up for a potential clean short opportunity, right from a key Order Block zone confluenced with 61.8–70.5% Fib retracement and a Strong High liquidity magnet above.
🧠 1. Why This Trade Setup is 🔥
This BTCUSD chart shows Smart Money preparing a trap:
🔺 Impulse down ➝ forming market structure shift
📉 Retracement back to a refined OB (purple zone)
📍 Aligned perfectly with:
✅ 61.8–70.5% Fib retracement zone
✅ Strong High = liquidity trap
✅ Bearish engulfing rejection from supply zone
This is textbook SMC confluence. Price could sweep the high one more time, then tank hard.
📌 2. Zone Breakdown
OB Entry Zone (purple): ~108,000 to 108,400
SL Above Strong High: ~109,000
TP at Weak Low: ~104,600
✅ Entry around 108,000
✅ RRR: ~1:5 👑
📈 3. Market Structure
HTF Bias: Bearish
LTF Structure: Retracing to premium zone
Expecting BOS downward if rejection confirms
⚙️ 4. Trade Plan
Wait for price to tap 61.8–70.5% zone
Look for M5/M15 bearish structure break
Enter on pullback to M15 OB
SL = Above the High
TP = Weak Low (104,630)
🛑 5. Risk Management Tips
Never enter blindly at 61.8%
Always wait for confirmation on LTF (M5/M15)
If price blows past 70.5%, let it go — don’t chase 🧘
🧠 Save this trade plan
📈 Comment “BTC SMC ENTRY” if you caught this
👀 Follow for more Smart Money chart breakdowns
Understanding Market StructureIn this video, I break down market structure in a simple and easy-to-digest way, helping you understand how to identify whether the market is in an uptrend or downtrend.
Recognizing market direction is a key skill for any trader, it allows you to trade in alignment with price action and make more confident, higher-probability decisions.
✅ If you're new to trading or want to sharpen your edge, this video will give you the insights needed to read market trends more clearly.
📈 Hope you find value in this breakdown!
👉 Don’t forget to like, comment, and subscribe to support the channel and stay tuned for more educational content.

EUR/USD Technical Outlook (Read Caption)📈 EUR/USD Technical Outlook
🗓️ Date: May 28, 2025
🕒 Timeframe: Likely 4H
💵 Current Price: 1.13387
📍 Chart Zones & Market Structure
🟣 Support Zone (1.1280 – 1.1310)
🟢 Buyers Active!
✅ Strong demand visible with multiple bullish rejections (marked by green arrows).
🛡️ Market respects this zone – accumulation possible.
🧲 Acts as a springboard for upward moves.
🔴 Resistance Zone (1.1420 – 1.1450)
🔻 Sell Pressure High!
Repeated rejection at this level (red arrows 📉).
🚫 Strong resistance; previous highs couldn’t sustain.
⚠️ Price may pause or reverse here again.
📊 Price Action Pattern
📐 W-Pattern / Double Bottom Formation
The chart outlines a potential W-shaped recovery from support.
🔄 Suggests possible bullish reversal if neckline breaks around 1.1380.
🎯 Target post-breakout aligns with resistance zone (1.1420+).
🔮 Bullish Scenario (Blue Arrow)
💡 Plan: Break + Retest at 1.1380 = 🚀 Long Opportunity
📈 Target: 1.1420–1.1450 zone
📦 Entry confirmation: Bullish engulfing or strong breakout candle
🛑 SL: Below 1.1310
🧠 What to Watch
🔔 Key Economic Events Coming (🎯🇺🇸 & 🇪🇺 icons):
High volatility expected — align trades with fundamentals.
📅 News catalysts can validate or invalidate the technical setup.
🧭 Professional Tip
📌 "Structure first, signals second"
Let the price react at key zones before entering.
Patience + Reaction = Precision Trades 🧠📊
✅ Conclusion
The market is in a neutral-to-bullish phase, trading between well-defined support and resistance. With a clean structure forming and economic events lining up, it’s a great moment to stay alert, plan your entries, and execute only with clear confirmation. 🎯📉📈

Breakdown Alert: Crypto Market Cap Tests Major Demand ZoneThe total crypto market cap is testing a key support zone around $3.23T. This area has acted as a demand zone in the past, and now price is hovering right above it.
The current structure suggests a possible breakdown–retest–continuation setup. If price retests this zone from below and fails to reclaim it, further downside toward $3.0T could be likely.
This idea is based on price action and structure only — no indicators used.
❗ This is a personal analysis for educational purposes only. Not financial advice.
Feel free to share your thoughts or technical perspective in the comments

Gold Forming a Bulllish Flag- Wacthing for Breakout ConfirmationThis chart shows a potential bullish flag pattern forming on the daily timeframe for Gold Spot (XAU/USD). The pattern is composed of a strong flagpole (an impulsive upward move), followed by a descending consolidation channel, which represents a correction phase.
The price is currently moving within the flag’s range. A breakout above the flag’s resistance trendline would confirm the bullish continuation pattern, potentially targeting levels above 3,500 USD. Until a confirmed breakout occurs, price action may continue to consolidate within the flag structure.
Flagpole: Sharp upward rally from mid-March to mid-April 2025
Correction: Downward sloping parallel channel
Breakout Level: Around 3,300–3,320 USD
Volume: Decreasing during the correction, which aligns with bullish flag behavior
Suggested Action: Monitor for breakout confirmation before entering long positions
This chart is for educational and technical analysis purposes only. Always use proper risk management.

EURGBP Bullish Structure Analysis – Channel Breakout + Target🧱 1. Market Structure Breakdown
EURGBP has been trading within a descending channel, forming consistent lower highs and lower lows, which indicates a short-term bearish trend. However, price action recently broke out above the upper boundary of this channel, suggesting a potential bullish reversal or trend correction.
This breakout marks a significant structural shift in market behavior.
🔵 Old Structure: Bearish, confined within the channel
🟢 New Structure: Bullish breakout above trendline + key resistance zone
🧩 Implication: Change in directional bias; potential for long opportunities
📍 2. Breakout Confirmation
The breakout was confirmed by:
A strong bullish impulse candle that closed above the descending trendline
Price sustaining above previous resistance (~0.8405)
Increase in bullish volume at the breakout point (if volume indicator is used)
This suggests that the breakout is genuine, not a false spike or liquidity grab.
🌀 3. Retest Phase – The Critical Zone
After breaking out, the market is now pulling back to retest the previous structure. This is a textbook price action move:
🔄 What’s Being Retested?
✅ Upper boundary of the descending channel
✅ Major horizontal support/resistance zone (~0.8405–0.8415)
✅ Broken trendline from previous lower highs
✅ QFL base (Quasimodo level that was swept)
✅ 50% Fibonacci retracement of the breakout move
This zone forms a multi-level confluence area, making it a strong support for potential long entries.
🔍 4. Key Technical Observations
Element Description
📐 Descending Channel Defined the prior bearish structure. Breakout invalidates this bias.
🧱 Trendline Retest Acts as dynamic support; price currently sitting on it.
🔃 SR Flip Zone Old resistance (~0.8405) turned into support—critical level.
📊 Fib 50% Retracement Provides technical alignment with potential buying interest.
📌 QFL/Order Block Zone Historical demand was swept and now being respected again.
🎯 5. Target Levels & Trade Plan
If the structure holds and the price responds bullishly from the current zone, the next levels of interest are:
✅ Primary Target – 0.8460
A clear supply/liquidity zone from previous structure highs
Also aligns with psychological round number and Fib extension
⚠️ Interim Target – 0.8430
Previous intra-channel resistance level
May serve as a short-term reaction point
❌ Invalidation Level
A clean break and close below 0.8390 would invalidate the breakout structure
This would reintroduce bearish pressure and signal a potential fakeout
🧠 6. Trade Idea (Not Financial Advice)
Entry: Around 0.8405–0.8415 on bullish confirmation (e.g., engulfing candle, pin bar, break of minor downtrend)
Stop-Loss: Below 0.8390 (beneath structure & invalidation point)
Take-Profit 1: 0.8430
Take-Profit 2: 0.8460
This offers a high R:R opportunity if managed with proper confirmation.
🧭 7. Risk Management & Considerations
Avoid entering prematurely without a bullish signal (e.g., pin bar, engulfing, RSI divergence).
Monitor macroeconomic news—especially from BoE or ECB—as they can disrupt technical setups.
Scaling into the position or using a split TP strategy can help protect profits.
✅ Conclusion
This EURGBP setup is a textbook case of market structure trading:
A well-defined channel breakout
Followed by a clean pullback to structure
With confluence across horizontal, diagonal, and Fibonacci levels
If price respects this zone, bulls could drive toward 0.8460, offering a solid opportunity for traders who understand structure-based setups.
📌 Always wait for confirmation—structure gives us context, but entries need price action signals to minimize risk.

JPYUSD Technical Analysis | (MMC) in Play + Target🟦 1. Structure & Price Action Overview
The chart is of JPY/USD on the 2-hour timeframe, showing a clear picture of price movement over several weeks.
We see three major market phases:
Range/Resistance Phase (Left side of chart)
Uptrend Phase (Middle – rising channel)
Reversal Setup (Right side – potential bearish move forming)
📈 2. Uptrend Channel (Accumulation to Expansion Phase)
From around May 13th, price started forming higher highs and higher lows, respecting a bullish channel (light blue shaded area).
This is a classic ascending channel, often seen during a controlled uptrend where buyers are still in control but momentum is slowing.
The channel took price directly into the resistance zone (marked in purple at the top).
🚫 3. Resistance Zone Rejection (Key Supply Zone)
Once price hit the resistance zone (~0.00705), it failed to break higher.
This level had previously caused sharp drops, so it's a well-established supply zone.
Price was rejected and dropped sharply, breaking out of the ascending channel – a strong bearish signal.
🔄 4. Mirror Market Concept (MMC) – Curve Bending Pattern
After the initial drop, price attempted a bounce, but couldn't even reach previous highs.
The curved arrow labeled "Curve Bending" shows how the market is “bending” its momentum – not pushing upward anymore but turning into a reversal.
This forms the mirror of the previous rise – indicating the market is ready to “mirror” that previous bullish leg, but to the downside.
🔄 5. SR Interchange (Support Flipped Resistance)
The previous demand zone (around 0.006950–0.007000), where buyers pushed price higher during the uptrend, is now acting as resistance.
This is called an SR Flip (Support becomes Resistance) – a very reliable technical sign of trend reversal.
🎯 6. Bearish Target Projection
Based on MMC and symmetry of past movements, the chart is projecting a strong drop toward the 0.006800 support zone.
This zone is also historically significant and acted as a demand area earlier.
The black arrow and target box show this expected move, which aligns with the mirror structure.
🧩 Conclusion & Trade Plan
Bias: Strong Bearish
Confirmation : Channel break + rejection at resistance + curve bending
Trigger: Price fails to reclaim 0.00700 and breaks below 0.006930
Target: 0.006800
Invalidation : Clean break & hold above 0.007050
🛡️ Pro Tips:
Don’t just jump in — wait for bearish confirmation (like a bearish engulfing candle, or a failed retest).
Always set your SL (Stop Loss) above the resistance zone (~0.007050).
Let the setup come to you — don’t force trades.

WTI Crude Oil – Bearish Elliott Wave SetupOn the 15-minute chart, I’m tracking a corrective rally in wave (ii) heading toward the 0.618 Fib zone (around 62.2–62.3) before the next major leg lower.
🔻 Bearish target: 52.00
📈 Looking for the final push up before confirming downside continuation.
💬 What are your thoughts on this Elliott Wave count?
For more updates and ideas, check my profile bio!
#WTI #CrudeOil #elliottwave #priceaction #technicalanalysis

Dhanuka ,1DPattern Is looking very good for Breakout , Nifty is also Supporting also all the stocks for Bullish Breakouts , This Is best time to enter in breakout stocks .
Consider Only those stocks that seems Technically strong with Good Volume Breakouts and Strong close .
Risk According to your capacity and aim for 40% and Risk upto 4-5% for this trade , Mainly you have to give the Room to Fluctuate the Stock , according to this flucations you have to decide your Stop loss .
Take Only A+ Setups , so that your Accuracy Should Be High and Returns also High
Follow for more Swing Ideas Like this

XAGUSD Analysis Using MMC | Breakout & Reversal + Target🧠 What the Chart is Telling Us:
Today’s Silver (XAGUSD) price action presents a powerful combination of structural breakout, pattern continuation, and mirror market behavior. Let’s break it down step-by-step so you understand the full picture.
🔸 1. Black Mind Curve Resistance Breakout
At the top-left of the chart, we see a curved descending resistance line (referred to as “Black Mind Curve”). This line has acted as a long-term dynamic resistance, consistently rejecting price action across multiple sessions.
However, after several failed attempts, the price finally broke above this resistance curve—a highly bullish signal. This breakout marks the beginning of a structural shift, where the bearish control starts to weaken and buyers gain momentum.
🔸 2. Support Level and Accumulation
Near mid-May, the price formed a solid horizontal support level. This level was tested multiple times but held firm, suggesting strong accumulation by smart money. According to MMC principles, these accumulation zones are mirrored later as breakout points—which is what we see play out in the chart.
🔸 3. Pennant Pattern Emergence
After the initial curve breakout, the market entered a tight consolidation, forming a Pennant Pattern. This is a continuation pattern formed when the market briefly pauses after a big move.
This pennant acts as a resting phase before another strong impulse—buyers are catching their breath, preparing for a second attack.
🔸 4. Breakout and Candle After Effect (AE)
Once price broke the pennant pattern, we saw an aggressive breakout candle (marked as AE – After Effect). This large candle is a classic liquidity candle that confirms buyer dominance.
In MMC terms, this AE candle reflects momentum that mirrors the impulse leading into the pennant, indicating that the second move will often match the first one in structure or magnitude.
🔸 5. Major Resistance + Break of Structure (BOS)
Above the breakout zone lies a key resistance area, which has now been broken. This is a Break of Structure (BOS) confirming that the market has flipped from a bearish to bullish structure.
This zone, once resistance, may now act as support in future pullbacks—a concept central to Mirror Market Theory, where historical resistance becomes future support (and vice versa).
🔸 6. Reversal Zone Target
The chart shows a projected move toward the Reversal Zone between $34.00–$34.50. This zone aligns with:
Previous highs from historical market structure.
Mirror levels when flipped across the midrange of the price action.
Possible liquidity zones where large institutions may look to reverse or take profits.
This Reversal Zone is where we can expect potential exhaustion in the bullish run, signaling a pause or a minor correction.
📌 Summary of Analysis:
✅ Bullish Confirmation Points:
✅ Breakout above long-term resistance curve
✅ Bullish Pennant Pattern followed by AE breakout
✅ Break of major horizontal resistance (BOS confirmed)
✅ Target toward reversal zone in line with MMC reflection logic
⚠️ What to Watch:
Price action behavior near $34.00–$34.50
Potential bearish engulfing or liquidity sweep in the reversal zone
RSI/Volume divergence signals near top zones
🎯 Final Thoughts:
The Silver market is showing clear bullish momentum supported by strong technical confluence and MMC-based mapping. The current structure favors continuation to the upside, but traders should manage risk as we approach reversal zones where large players may start offloading positions.
🧠 Mirror Market Concept Reminder:
MMC is a strategy based on the mirroring of market behavior—where price levels, patterns, and reactions tend to reflect past structures either directly or inversely. It’s highly effective in spotting key reaction zones, target extensions, and reversals.
💬 What’s Your Take?
Do you agree with this bullish projection, or do you see weakness ahead? Let me know in the comments! And don’t forget to like & share this idea if you found value in it. 🚀

Gold 1M & 15M Bearish Breaker Block Setup, Targeting 3,202 ZoneI’ve marked a bearish breaker block on the 1-minute chart (3,316–3,319), also visible on the 15M timeframe.
✅ Last bullish push before the sharp downside breakout.
✅ Price retested this zone, wicked through it, and then sold off aggressively — reinforcing bearish order flow and the potential for deeper downside.
I’m tracking this move as the final C wave of an ABC corrective pattern.
✅ The C wave started from the 3,319 high and is unfolding in a 5-wave substructure.
✅ 1-Minute breaker block around 3,316–3,319 — I’m watching for rejection here, which aligns with the 0.618 Fib retracement as an estimated end of wave 2.
✅ My current expectation: wave (3) and (5) of C could extend lower to the 3,256–3,202 zone.
🧩 Key Confluences:
Bearish breaker block rejection
15M downtrend structure remains intact
#XAUUSD #gold #forex #elliottwave #bearishbreakerblock #orderflow #priceaction

BTCUSD Breakdown from Pennant – MMC Structure Analysis + Target🧠 Introduction: Why This Chart Matters
Bitcoin recently provided a textbook example of market manipulation, where the price action formed a bullish-looking pattern (Pennant), trapped traders with a fake breakout, and then reversed strongly to the downside. By using Mirror Market Concepts (MMC), we can clearly see the logic behind this move—how the market mirrored a previous pattern and fulfilled a predictable target zone.
This analysis breaks it all down, step-by-step, for both educational and practical trading purposes.
🔍 Detailed Chart Breakdown:
1️⃣ The Illusion – Bullish Pennant Formation
Initially, BTC/USD formed what looked like a bullish pennant—a common continuation pattern in technical analysis. The pattern appeared after a sharp upward move, followed by converging trendlines suggesting consolidation.
Retail traders often anticipate a breakout above the pennant as a sign of bullish continuation. This is where the trap begins.
Why It’s a Trap: The pattern looked clean and reliable—but the context told another story. This move was designed to lure breakout traders into long positions right before a reversal.
2️⃣ The Fakeout – Liquidity Grab Above the Pattern
Shortly after the pennant formed, price pushed above the upper trendline, triggering breakout entries and stop losses of short-sellers. But instead of continuing up:
The price reversed sharply.
This aggressive move confirmed the fakeout.
This is a classic example of a liquidity hunt, where the market moves briefly in one direction to gather orders before executing the real move.
📌 MMC Insight: This behavior mirrors a prior setup—price previously faked upward, then dropped to a key demand zone. The mirror pattern gives a clue that the same outcome might repeat.
3️⃣ CHoCH – Change of Character Confirmed
After the fakeout, BTC broke below a key internal support and trendline structure, signaling a CHoCH (Change of Character)—a shift from bullish to bearish market control.
This moment is crucial:
It confirms the smart money’s intention.
It signals that the previous bullish move was just a setup.
Sellers now have control.
💡 Pro Tip: CHoCH is one of the earliest and most reliable signs of a reversal when combined with liquidity patterns.
4️⃣ Trendline Break & Structural Sell-Off
The break of the trendline following CHoCH solidified the bearish direction. This was the best confirmation-based entry point, as the structure flipped and began forming lower highs and lower lows.
5️⃣ Target Fulfilled – Previous Demand Zone Hit
The price then continued down aggressively and hit the marked MMC target zone. This area coincided with:
A previous demand zone (where buyers stepped in before).
A Mirror Market reversal point, seen earlier in the chart.
This fulfillment of the MMC target validates the entire analysis—from trap to reversal to target.
🎯 Key Zones:
Fakeout High: $69,600 area (liquidity sweep)
CHoCH Break Level: Around $69,100
Trendline Break Confirmation: $69,000
Final Target Zone: $68,500–$68,700
📈 Trading Strategy Recap:
Entry Idea: Enter short after CHoCH and trendline break
Stop Loss: Above fakeout high ($69,600+)
Take Profit: MMC demand zone ($68,500–$68,700)
This trade offered excellent risk-to-reward and confluence using multiple tools (MMC, CHoCH, structure, liquidity sweep).
🧠 What You Can Learn from This Setup:
Patterns Can Lie: A pattern like a pennant isn’t enough—context is key.
Liquidity Is King: Understand where the market needs to go to collect orders.
Mirror Market Concepts Work: Historical behavior often repeats in reverse. Use MMC to forecast likely outcomes.
CHoCH is Powerful: It's your early alert system for trend changes.
🔎 Final Thoughts:
This BTC/USD chart is a powerful example of how smart money operates—with manipulation, pattern traps, and mirrored market behavior. If you’re a price action trader or use MMC, this breakdown is a must-study.
Don't just trade patterns—trade context. Look for traps. Use MMC. Watch CHoCH. And always have a mapped target based on structure.

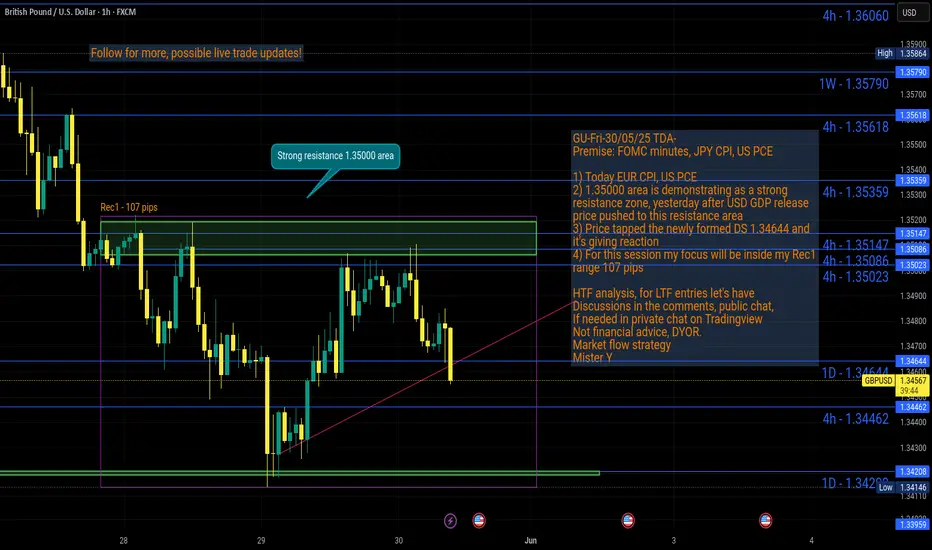
GU-Fri-30/05/25 TDA-Strong resistance 1.35000 zone! Analysis done directly on the chart
Follow for more, possible live trades update!
I trade zone to zone, from support to resistance,
and vice versa. Once I see price entering my
zone of interest, I see how candle reacts to the
level.
Not financial advice, DYOR.
Market Flow Strategy
Mister Y
XAU/USD – Gold Analysis Using MMC & Structural Mapping + Target🔎 Market Narrative:
Today’s GOLD analysis is crafted through the lens of Mirror Market Concepts (MMC)—a powerful strategy where historical price behavior is mirrored in the current chart structure. This is combined with traditional structural analysis, offering a clear view of current price behavior, key breakouts, and target levels.
We’re currently seeing an interesting scenario unfold where the market structure is shifting from bearish to bullish, aligning with mirrored reactions from previous key zones.
🧠 MMC Breakdown & Price Psychology:
🔄 Mirror Reaction:
Notice how the market mirrored a previous aggressive sell-off with a similar bullish recovery. This “reflection” is a hallmark of MMC—where market sentiment repeats itself, but in opposite directions.
The "Previous Targets" zone acted as a key SR Interchange (support-turned-resistance / resistance-turned-support). Price dropped into this zone and bounced with strong bullish momentum, signaling smart money accumulation or potential liquidity grab before reversal.
🧱 Structural Analysis:
🔹 Trendline Observation:
A key trendline (drawn from the recent swing highs) was clearly broken, confirming that the bearish structure has shifted into a bullish one. The breakout was followed by a retest, further strengthening the validity of this move.
🔹 Support/Resistance Flip (SR Interchange Zone):
The Blue Ray zone marked on the chart is critical. This area held as support in the past and again acted as a launchpad for the recent upside move.
🔹 Previous Targets Reclaimed:
After hitting the previous support zone, price reversed sharply—another MMC principle in play. These zones often serve as liquidity magnets and reaction zones, where institutional traders are active.
📍 Key Levels To Watch:
✅ Current Support: $3,289–$3,295 (Previously broken resistance, now acting as support)
🎯 Immediate Target Zone: $3,310–$3,320
(This is where the price is expected to face short-term resistance. If broken, the next mirror move could extend further.)
🔻 Trendline Confirmation Level: $3,296
(Holding above this confirms bullish bias short-term)
🛠️ Trading Plan / Bias:
Bias: Bullish
Entry Idea: Look for bullish continuation above $3,296 after minor consolidation or retest
Risk Management: Place stop-loss just below $3,289 (previous demand zone)
Take-Profit: $3,310 – $3,320 zone initially
⚠️ Risk Consideration:
Gold can be volatile, especially during news events. Always assess macroeconomic factors (like Fed policy, NFP, CPI, etc.) and manage your trades with solid risk-to-reward ratios.
🧠 Final Thoughts:
This chart is a great example of how Mirror Market Concepts (MMC) can work hand-in-hand with price action and structure to provide clean, repeatable setups. By understanding the psychology behind price mirroring, we can better anticipate turning points and entry zones—especially when the structure confirms it.
Whether you’re a day trader or swing trader, this concept adds a layer of confluence to your technical analysis toolkit.

GJ-Fri-30/05/25 TDA-Massive dump on GJ, now what?Analysis done directly on the chart
Follow for more, possible live trades update!
Time to reset, recharge!
Just like you train your body, it needs
recovery time.
Also your brain needs recovery time.
Not financial advice, DYOR.
Market Flow Strategy
Mister Y

Link, 1DAs BTC is Falling And BTC is given Breakout of Pattern in 4Hr , then Remaining coins will also fall drastically .
in 1D pattern of ADA USDT , it is Breaking Down as BTC is also given Break Down of Pattern
Follow for More Ideas like This

XLM ,1DAs BTC is Falling And BTC is given Breakout of Pattern in 4Hr , then Remaining coins will also fall drastically .
in 1D pattern of XLMUSDT , it is Breaking Down as BTC is also given Break Down of Pattern
Follow for More Ideas like This

GBPJPY - Bearish Control, Again!Hello TradingView Family / Fellow Traders. This is Richard, also known as theSignalyst.
📉As per our last GBPJPY analysis (attached on the chart), it rejected the upper red trendline and traded lower.
What's next?
GBPJPY is currently retesting the upper bound of the falling red channel again.
Moreover, the green zone is a strong structure and resistance.
🏹 Thus, the highlighted red circle is a strong area to look for sell setups as it is the intersection of structure and upper red trendline acting as a non-horizontal resistance.
📚 As per my trading style:
As #GBPJPY is around the red circle zone, I will be looking for bearish reversal setups (like a double top pattern, trendline break , and so on...)
📚 Always follow your trading plan regarding entry, risk management, and trade management.
Good luck!
All Strategies Are Good; If Managed Properly!
~Rich
Disclosure: I am part of Trade Nation's Influencer program and receive a monthly fee for using their TradingView charts in my analysis.

30.05.25 Morning ForecastPairs on Watch -
FX:EURUSD
A short overview of the instruments I am looking at for today, multi-timeframe analysis down to what I will be looking at for an entry. Enjoy!

KO 1D — A Diamond Not Yet Broken, But Already CrackingOn the daily chart of Coca-Cola, a classic diamond top structure is forming — not yet completed, but clearly visible. The market expanded its range in the initial stage, then began to compress into a tighter zone, creating the typical shape of a diamond. This isn’t a continuation pattern — it’s the setup phase for redistribution.
The key level sits at $68.50 — the base of the diamond. As long as this line holds, the pattern remains inactive. But current price behavior says more than enough: weakening momentum, falling volume, and a lack of aggressive follow-through on recent highs. This isn’t accumulation — it’s preparation.
Price is currently trading between the MA50 and MA200, signaling a neutral phase with downside risk. The moving averages are narrowing, but no crossover has occurred yet. That’s critical — the trend isn’t broken, but it’s clearly losing energy. If $68.50 gives way, the measured move from the pattern projects a decline toward $61.82.
From a fundamental standpoint, Coca-Cola remains stable — but uninspiring. Earnings met expectations, revenue was steady, and no major catalysts are visible. In this type of environment, technical structure often becomes the tool for institutional rotation — not because the story collapsed, but because the setup makes sense.
The edges of the diamond are in place. All that’s missing is the break. If the neckline fails, the downside scenario is already built — structurally and logically.

CHFJPY SHORTCHFJPY is expected to continue tanking to complete the ABCDE triangle corrected before the up-surge to follow the dominant trend. shorting on current price action to complete the triangle wave correction
