2025-05-29 - priceactiontds - daily update - nasdaqGood Evening and I hope you are well.
comment: I don’t know what’s more likely to happen tomorrow and every time I feel that way, market is in a trading range and most likely neutral. Big up, big down, big confusion. Read some Al Brooks. Volume was big today but given that bears only managed to close 60 points below Wednesday, what did they achieve? RTH session closed the gap but not more. Futures obviously had a nasty reversal but we can still draw a decent bull wedge with lows either 21300 or 21100 and that would mean bulls would be favored to trade back up.
current market cycle: trading range
key levels: 21000 - 22000
bull case: Bulls who want to buy 21400 would likely need a stop 20700 and scale in. Is this a good trade? I don’t think so. You either wait for better confirmation that today’s low is credible and will hold or you wait for lower prices closer to 21000 before going long. I doubt this bull wedge will just end like this and that we top out with 21858. I expect at least some form of double top with a print up to 21700 or higher. The middle of the current range is 21300 and market bottomed out there today. Maybe this fact makes it a bit more favorable for the bulls.
Invalidation is below 21300.
bear case: Below 21300 bears could try to go for 21000 or even last weeks low at 20727. How likely is that? Today’s selling was very strong and it was at the moment everything was max bullish and perfect aligned. You do not see these type of reversals in a strong bull trend. We are very likely in the last days of it before we go down lower. That being said, I just don’t think we will go down further from here without another try of 21800+. I have two potential bull wedges on my chart and bears would need a strong move below 21300 and stay around 21000 for me to abandon that structure.
Invalidation is above 22100.
short term: Neutral and need a very good signal to either side for me to take it. Bears want 21000 and bulls at least 21800. My line in the sand is 21300.
medium-long term - Update from 2024-05-24: Will update this section more after the coming week but in general the thesis is as for dax. Down over the summer and sideways to up into year end. I don’t think the lows for this year are in.
trade of the day: Buying Globex open was the obvious trade but shorting the highs certainly was not and I think everyone was surprised by this bear strength today.
Priceaction

"SOL Market Cap Breakdown Setup| Bearish Retest Targeting 83.3B"SOL Market Cap is showing signs of a potential breakdown after a series of lower highs and a bearish retest of previous support. Price is currently retesting the breakdown level. If confirmed, the next support zone is near 83.3B.
This is a technical analysis-based observation, not financial advice. Always manage risk and confirm with your own strategy before making any decisions.

"PEPE 1H Analysis - Breakout Incoming? 📊 *PEPE/USDT – 1H Technical Analysis*
An ascending triangle pattern is developing on the 1-hour timeframe, which often indicates potential bullish momentum.
🟢 Price is approaching a key resistance near *0.00001516*.
🟡 A clean breakout above this level with strong volume may open the door for further upside.
🔴 Watch for *confirmation* before considering any move.
🔍 This chart is purely for educational and analytical purposes.
No financial advice. Do your own research before making any trading decisions.
#PEPE #PEPEUSDT #Crypto #TechnicalAnalysis #TradingView #Altcoins

DOGE|Bearish Triangle Formation On30-Min Chart-Breakdown Ahead?📉 DOGE Bearish Triangle Breakdown | 30-Min Chart
This chart highlights a classic *bearish triangle formation* in DOGE's market cap on the 30-minute timeframe. The pattern shows a series of lower highs with horizontal support around the 32.45B zone.
🔍 Key Observations:
- Pattern: Bearish Triangle
- Resistance: ~34.7B
- Support Zone: ~32.45B
- Target Zone (Post-Breakdown): ~31.3B
A breakdown below the support level could signal further downside movement. However, confirmation is key — traders should watch for volume and candle close below support.
🕒 Timeframe: 30-Minute Chart
📆 Analysis Date: May 29, 2025
---
⚠ *Disclaimer:*
This analysis is shared purely for *educational purposes* and does not constitute financial advice. Please do your own research and risk management before making any trading decisions.

BTC - Let's Do It Again!!Hello TradingView Family / Fellow Traders. This is Richard, also known as theSignalyst.
📈 As per our last analysis (attached on the chart), BTC rejected the lower orange trendline and moved higher as expected! ✅
🔄 BTC is now retesting the lower trendline again, so we’ll be looking for new trend-following buy setups as long as the red structure at $105,000 holds!
📚 Always follow your trading plan regarding entry, risk management, and trade management.
Good luck!
All Strategies Are Good; If Managed Properly!
~Rich

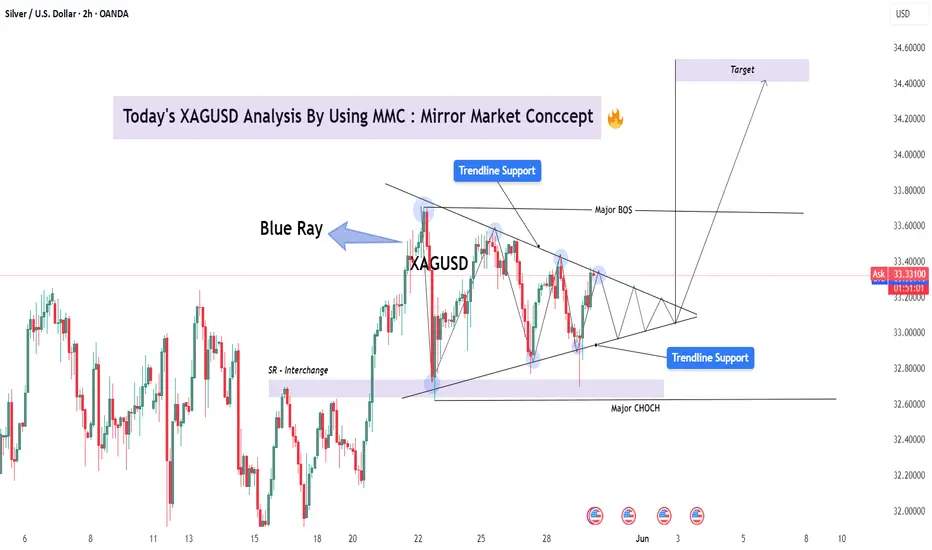
XAGUSD Analysis with MMC | Trendline + CHoCH Insight + Target🔍 Overview
This XAGUSD chart presents a classic Mirror Market Concept (MMC) pattern – a fractal, symmetrical market behavior often observed at key inflection points. The structure is currently forming a tight triangle pattern within two converging trendlines, signaling a compression phase before a significant breakout.
Mirror Market Concept relies on the idea that historical emotional market structures tend to repeat or reflect, especially in psychologically sensitive zones such as trendline tests, liquidity pools, and BOS/CHoCH areas.
📐 Technical Structure Breakdown
🔷 1. Trendline Resistance & Support (Triangle Compression)
Upper trendline connects successive lower highs, reflecting consistent seller pressure.
Lower trendline aligns with higher lows, showing bullish defense and accumulation pressure.
The result is a symmetrical triangle, often preceding explosive directional moves.
🔹 2. Blue Ray Zone
The "Blue Ray" acts as a historical liquidity pivot — a region where large wicks and rejections happened in both directions.
Price has respected this zone repeatedly, making it a likely impulse trigger area if revisited.
🔄 3. BOS (Break of Structure) and CHoCH (Change of Character)
Major BOS near the $33.60 area indicates a shift in market structure to bullish. The break above previous swing highs suggests buyers gained control temporarily.
Major CHoCH at the base of the triangle reflects where market sentiment shifted, initiating the current series of higher lows.
📍 4. SR Interchange Zone
Previous resistance around $32.80–$33.00 is now acting as support (interchange level), creating a confluence zone with the lower trendline and CHoCH point.
🎯 Forecast & Targets
✅ Bullish Scenario (Primary):
A breakout above the upper triangle trendline and confirmation above $33.60 will validate the bullish breakout setup.
Price Target: $34.40 – $34.60 (based on triangle height + measured move theory)
Expect impulsive follow-through as trapped shorts exit and fresh longs enter.
🚫 Bearish Alternative:
A breakdown below $33.00 with strong volume and bearish retest may invalidate the bullish setup.
In such case, a fall toward $32.20–32.40 is possible — completing a deeper retracement before any resumption of the upward move.
🔍 Market Psychology Behind the Pattern
This triangle represents market indecision, a "coil" where both bulls and bears are losing volatility while absorbing liquidity. The MMC concept teaches us that price often mirrors previous patterns — and the compressed energy inside triangles typically resolves in sharp momentum moves, mirroring the prior impulse.
Expect a strong breakout that "mirrors" the breakout leg from May 22 to May 23. This type of reflection-based logic is a cornerstone of MMC.
🔔 Trading Plan & Strategy
Entry: Wait for breakout and retest of the triangle boundary (ideally on 1H/2H close).
Stop Loss: Below the most recent swing low inside the triangle.
TP1: $34.10
TP2: $34.40
TP3: $34.60 (psychological level and measured move)
⚠️ Risk & News Considerations
Upcoming U.S. economic data events (highlighted on the chart) could act as catalysts. Be prepared for volatility spikes and fakeouts. Always use solid risk management.
29.05.25 Morning ForecastPairs on Watch -
FX:AUDCAD
FX:EURUSD
TVC:USOIL
FX:GBPJPY
A short overview of the instruments I am looking at for today, multi-timeframe analysis down to what I will be looking at for an entry. Enjoy!

GU-Thu-29/05/25 TDA-Zone of conflict of interest, Bull and Bear!Analysis done directly on the chart
Follow for more, possible live trades update!
Predicting the market is impossible, you react
to how price is forming and telling you the volume
strength, potential push/consolidation/pullback.
Not financial advice, DYOR.
Market Flow Strategy
Mister Y

BTCUSD Analysis – Mirror Market Concepts (MMC) Action + Target🧭 Mirror Market Concepts (MMC) Explained
Mirror Market Concepts analyze repeating emotional and structural patterns in the market—like looking at a price “mirror” that reflects past movements into the present. Core tools include:
Mind Curve Resistance/Support
CHoCH (Change of Character)
BOS (Break of Structure)
Price Reflection Zones
These tools let us understand not just what price is doing—but why it's reacting at specific levels.
📊 Technical Breakdown of the Chart
🔹 1. Black Mind Curve Support & Resistance
The chart is framed between a rising support curve and a descending resistance curve, forming a psychological squeeze zone.
These mind curves represent subconscious institutional memory—where reactions often repeat based on historical liquidity and risk-off/on behavior.
🔹 2. Major CHoCH (Change of Character)
Price broke below a previous minor higher low, shifting sentiment from bullish to neutral/bearish.
This CHoCH happened within the mind curve boundary, signaling that we’re transitioning into a decision phase.
🔹 3. Major BOS (Break of Structure)
The BOS occurred during the recent drop, confirming sellers took temporary control.
However, price respected the lower mind curve support, which may still hold as the "mirror zone."
🔹 4. Key Compression Pattern (MMC Symmetry)
Price is forming a symmetrical wedge between the two curves, often seen in MMC just before a major explosive move.
The pattern resembles past behavior where price compressed before breaking out in either direction.
🎯 Potential Scenarios (Plotted on Chart)
📈 Bullish Path:
If BTC breaks above the descending curve + confirms above 109,000, we may see:
✅ Target 1: 111,000 (BOS retest)
✅ Target 2: 112,500–113,000 zone (previous emotional high + liquidity sweep)
📉 Bearish Path:
A breakdown below 107,000 and curve support suggests sellers regain control:
⚠️ Target 1: 105,000 (local demand zone)
⚠️ Target 2: 102,500–103,000 (full MMC retrace)
⚠️ Watchlist Considerations:
Two key economic news events (highlighted on chart) could serve as catalysts.
Wait for confirmation and volume breakout before committing to either side.
This is a textbook MMC compression pattern, and patience is key before reacting.
🧠 What Makes This an MMC Setup?
🔄 Mirror Reflection of past rallies and drops forming current wedge
🧩 Mind Curve Boundaries acting like subconscious trend guides
🔁 CHoCH + BOS sequencing for momentum shift detection
💡 Psychological memory zones holding strong reactions
📌 Summary
BTC is caught in a psychological squeeze between mind curve support and resistance.
Structure favors a coming breakout or breakdown, but confirmation is critical.
MMC tools show a high-probability setup—either toward 112K or 103K based on where the breakout happens.
📣 Community CTA (Call-to-Action):
📊 How are you trading this BTC curve compression?
💬 Share your charts, setups, or alternate views below. Let’s decode the market mirror together.

GJ-Thu-29/05/25 TDA-Possible buy above 4hR 196.283Analysis done directly on the chart
Follow for more, possible live trades update!
Asian session gave a good push, if you feel
missing out (FOMO). Don't worry, opportunities
will always be there.
Not financial advice, DYOR.
Market Flow Strategy
Mister Y

GOLD (XAUUSD) Full Analysis – MMC Strategy in Action + Target🧠 What is Mirror Market Concepts (MMC)?
MMC is a psychological and technical framework that interprets market movements as mirrors of past behaviors, often using curves, rays, and emotional imprints to forecast price flow. It assumes that price reacts not just to levels but to memory zones left by institutional actions.
🧭 Chart Overview and Interpretation
1. Black Mind Curve Resistance:
The black curved line represents a dynamic resistance zone where the market previously showed sensitivity.
It aligns with psychological levels where institutional interest faded, marking a high-probability rejection point.
Note the smooth arc — MMC suggests such curves reflect subconscious market resistance.
2. Blue Ray – Institutional Reaction Line:
The blue ray points to a previous impulsive reaction zone near 3,320, marking an emotional high.
Price sharply rejected this area again, creating a mirror rejection.
This symmetry is key in MMC — the present move is reflecting the structure of the past.
3. SR Interchange Zone (Support-turned-Resistance):
Around the 3,290 level, price previously bounced from this zone (demand), but it has now flipped to act as resistance.
This SR Interchange is significant in MMC as it represents a "mental switch" — demand has turned into fear-based supply.
4. Break of Market Structure + Retest:
A clean break below the short-term bullish trendline followed by a rejection retest confirms the shift in structure.
This breakdown confirms bears are in control for now.
The recent candles show clear rejection wicks from the retest zone.
🎯 Trade Plan (Bearish Setup)
Entry Zone:
🔹 Enter between 3,275 – 3,285, where price is rejecting the SR flip and mind curve.
Target Zone:
🎯 First TP: 3,250 (MMC Support Zone – highlighted in purple below)
🛑 Optional Second TP: 3,240 if momentum continues post-news event.
Stop Loss:
🔺 Above 3,300 to allow space for false spikes, just beyond the curve rejection zone.
📉 Why This Setup Works (Psychological Flow)
The current price action is mirroring the left side of the chart — the same way price impulsively rose from a zone, it's now impulsively falling back into it.
The rejection from the Black Curve and Blue Ray are not just technical — they are emotional resistance zones, meaning institutions remember the reaction.
This creates internal balance that MMC traders look to exploit, riding the memory of the market.
🔔 Risk Factors & Considerations
Watch for the USD-related news event on the calendar (noted on chart). If high-impact, it can cause volatility and short-term spikes.
If price breaks and holds above 3,300, the bearish idea becomes invalid — don’t fight the market.
🧵 MMC Concepts Highlighted in This Chart
Black Mind Curve Zone – Dynamic psychological resistance
Blue Ray – Emotional ray from institutional rejection
SR Interchange – Support becomes resistance
Mirror Symmetry – Price behavior is reflecting the past
Emotional Imprint Zones – Past reactions leave future footprints
🗨️ Community Call-to-Action (CTA)
💬 What’s your view on GOLD today? Are you using Mirror Market Concepts in your trading?
Drop your thoughts, charts, or alternate views below — let’s build solid MMC case studies together!

XAUUSD Bearish Breakdown| Trend Reversal Bearish Setup Price has broken below the rising channel, showing early signs of a potential bearish reversal.
Key Resistance: 3364
Current Price: 3334
Support Levels to Watch:
3282 (first support)
3250 (major target)
If price fails to reclaim the channel and retests 3364 without strength, we could see a deeper drop below 3282. A bounce from 3282 might offer short-term buy setups, but momentum favors bears for now.
Trade Plan:
Short below 3325 with SL above 3364
Target: 3282, extended to 3250
Let me know your thoughts! Are you bullish or bearish here?
#technicalanalysis #priceaction #tradingview #USD #bearishsetup

Gold isn't breaking out — it’s breaking down.What we're seeing in gold right now is not a temporary pause — it's a calculated, smart money-driven transition from impulsive expansion into controlled redistribution. The rally from 3120 to 3357 wasn’t organic or trend-based — it was mechanical, steep, and uncorrected. And that’s the first red flag. When price travels that far without building any real base or demand, it’s often not aiming for continuation, but to reach a liquidity target. This was a liquidity run, not a sustainable breakout.
Then comes May 24 — a pivotal moment. Price breaks above 3357, spikes volume +19% over average — but delivers a weak candle body. The next bar doesn’t confirm, doesn’t expand, doesn’t even push the high. Instead, we get a failed breakout followed by retreat. That’s textbook deviation — a classic trap where market makers dump inventory while retail rushes to chase the breakout.
This happens inside the derivation area — that thin, deceptive range between 3357 and 3370. It’s where distribution is masked as strength. But price behavior reveals the truth: after tapping that zone, it didn’t hold. Price fell back inside the range. No retest. No follow-through. And most importantly — price has now closed beneath the anchored VWAP from May 13, shifting the control of the tape.
Anchored VWAP matters — it's the average weighted cost of the dominant positioning from smart money. And once price falls below it and stays there, we know demand has dried up. Add to that: shrinking candle ranges, decreasing volume, soft closes — all signs of exhaustion. RSI has already pulled off from overbought levels, Stochastic is turning down, and ADX shows trend strength fading.
But those indicators are just the shadow of what price already told us. We’ve lost structure. A lower high is forming. Price was rejected from the same zone that was previously supposed to be the breakout. It’s not consolidation anymore — it’s redistribution.
The path forward is tactical and logical. Price is likely headed first toward 3275 — that’s the shallow liquidity pocket. From there, we might get a pullback to 3305–3315 — not a rally, but a retest of the old sell zone. That’s where another leg of short interest can build. Then comes 3250 — the bottom of the last structural block. If that fails to hold, gold opens the door to 3205–3215 — a historical volume shelf and the next real support.
There’s no guessing here. The breakout failed. VWAP is broken. Momentum is gone. This isn’t the start of something higher — this is the start of the unwind. And while retail waits for 3400, smart money is already loading their next leg short.

Nasdaq Bulls Back in the Fight – 21K Is the Battlefield📍 The 21K Line in the Sand – Nasdaq’s Second Chance Setup
The bounce off the purple EMA was no joke — big reaction, and now we’re reclaiming key structure: back above VWAP (red), white EMA, and even the weekly pivot (straight orange line).
That pivot zone at 21K is still the line in the sand. I do expect a potential breach — maybe even a quick liquidity sweep — but if buyers step in with momentum and reclaim, I’m interested in longs again.
⚔️ This is a momentum shift — structure's back in favor of bulls, and until we lose 21K with conviction, I’m treating dips into that area as buyable.
📍And if price overreacts? I’m watching 20,750 as a “second chance” zone. Strong bounce there before — I’m not ignoring that twice.
This is still a two-sided game, but for now, bulls are back in position. Let’s see if they hold the line.

2025-05-28 - priceactiontds - daily update - dax
Good Evening and I hope you are well.
comment: Higher highs and higher lows. Focus on the easy trades. Can only get bearish with consecutive 15m or 1h bars below 24000 and for now that is unlikely. Bulls bought 24000 the whole week so look for longs.
current market cycle: broad bull channel
key levels: 23000 - 24500
bull case: As long as the bull gap 23700 - 23900 stays open, I would only look for longs. 24500 is the next obvious target and it’s not impossible that markets do a complete meltup tomorrow. Structure is a clear bull channel until we print below 24000.
Invalidation is below 23900.
bear case: Bears need something below 24000 again, that means lower lows. Right now bulls remain in full control and I doubt we can go from daily new ath to a big reversal down. I got nothing for the bears here.
Invalidation is above 24550.
short term: Neutral but would only trade long until we see much better selling pressure and prices below 24000.
medium-long term from 2025-05-25: My rough guess from early May was down over the summer and up into year end. POTUS certainly helped with the 50% tariffs. I need to see market reaction next week and if there is no 180° reversal until Friday, they will become reality the week after and dax should do 20-30% down over the next months. Markets were not positioned for any risk what so ever. Now we got the atomic trade bomb.
trade of the day: Short since the bull trap on the open but I did not take it. I thought chances of a reversal were too high for me. I was wrong but that’s ok.

AUDJPY Short Setup – Fair Value Gap + 61.8% Precision Tap📊 AUDJPY | 1H Bearish Setup Breakdown (SMC Perspective)
This is a clean setup for sniper traders 🧠 — a perfect blend of FVG, Fib retracement, and a reaction from Smart Money zones. Let’s dig in:
🔻 1. Macro Context: Bearish Bias
Market structure is still bearish, with lower highs and lows
Price just completed a correction phase
We're seeing price react at a high probability distribution zone
🟪 2. Confluence Zones: FVG + Fib
📌 Fair Value Gap (FVG) – Price has just tapped into the FVG between 92.92 and 93.12
📌 61.8% Fib Level – Price perfectly aligns with golden pocket zone
📌 OB Above – Strong bearish order block lies around 93.60, with a Strong High marking retail’s target stop area
This stack of confluences makes this zone ripe for a short entry.
💣 3. Entry Logic
Entry was triggered after a clean tap into the FVG zone
Price shows signs of rejection with long upper wicks and slowing momentum
Ideal Smart Money scenario: Price mitigates FVG, avoids OB sweep (for now), and targets internal liquidity
🎯 4. Target Zone
TP = 91.651
Clean equal lows and imbalance just above
Channel midpoint & liquidity resting below
Matches 0% Fib level on the move
⚖️ 5. Trade Setup
📍 Entry: 92.926
🔐 Stop Loss: ~93.390 (above FVG + structural high)
🎯 Target: 91.651
🧮 Risk-to-Reward Ratio: ~1:4.5+
🧠 Smart Money Flow
Retail longs are eyeing a break above that “Strong High” — but Smart Money will likely:
Tap into FVG
Drive price down for a liquidity grab
Possibly retest or sweep OB after internal liquidity is cleared
💬 Drop “FVG ZONE SNIPED 🧨” if you took the entry
🧠 Save this post to study FVG + Fib reactions
👀 Tag your trading buddy who needs to level up their confluence game

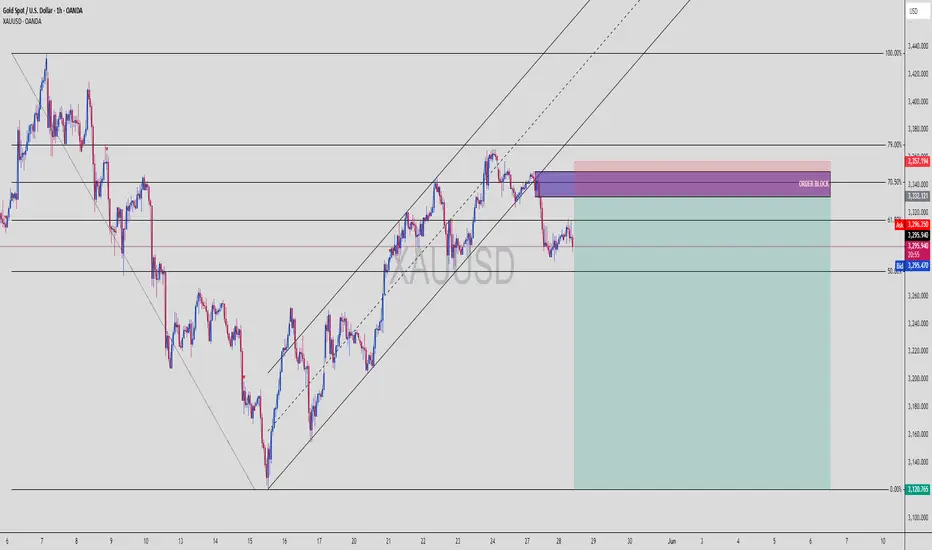
USDJPY | Smart Money Long Setup – Deep Fib + OB Reaction💴 USDJPY | Institutional Long Play with Perfect OB + Fib Confluence
Price gave us an aggressive push off the demand zone, showing clear Smart Money accumulation behavior. This setup is high probability based on Smart Money Concepts (SMC).
🔍 1. Technical Breakdown
Strong impulse move upward
Clean pullback into the Order Block
Confluence with 70.5%–79% Fibonacci retracement zone
Price respected the OB zone and printed higher highs
That reaction was institutional — no cap 🧢.
🧱 2. Bullish Confluences
🔥 Order Block (OB): Purple demand zone = unmitigated
📐 Fib Sweet Spot: 70.5%–79% = institutional re-entry levels
✅ Strong Wick Rejection: Shows absorption of sell-side liquidity
📈 Market Structure Shift: Break of structure to the upside
🎯 3. Trade Plan
Entry: 142.89 (within OB + 70.5%)
Stop Loss: 142.00
Take Profit: 145.49 zone
This setup targets the -27% fib extension — a classic institutional TP level.
⚖️ 4. RRR (Risk-Reward Ratio)
💰 Entry: 142.89
🔒 SL: 142.00
📍 TP: 145.49
✅ RRR ≈ 1:2.9
Solid intraday-to-swing play with clean structure.
🧠 5. Key Confirmation Points
Break and close above 144.36 = confirmed bullish intent
Price respecting 143.44 OB = bulls still in control
SL below OB = protected by demand block
💬 Comment “SMC Long Sniper 💹” if you caught this move!
🔄 Share this if you love OB + fib sniper entries
📌 Save this setup for your next demand zone playbook

XAUUSD | Institutional Sell Setup – OB + 79% Fib Confluence🪙 XAUUSD | Gold Sell Setup Based on Smart Money Concepts
This is a classic example of how institutions lure in retail traders — tap the golden zone, reject hard, and leave a trail of liquidated longs.
🔍 1. Technical Breakdown
Price aggressively climbed into a strong Order Block zone
Rejection from the 70.5%–79% Fibonacci retracement area
Broken ascending channel confirms shift in momentum
Bearish BOS already occurred = Smart Money in control
This zone (3332–3357) is a magnet for institutional sells.
🧱 2. Bearish Confluences
💀 OB Rejection: Previous up candle before the sharp drop
📐 Fib Overlap: 70.5–79% = premium zone for shorts
📉 Structure Shift: Channel break + bearish order flow
⚠️ No Candle Close Above OB: = market respecting supply
🎯 3. Trade Plan
Entry: 3332–3357 (executed)
Stop Loss: 3360 (above OB)
Take Profit: 3120 zone
This is a deep sell-side liquidity hunt.
⚖️ 4. RRR (Risk-Reward Ratio)
📥 Entry: ~3345
🔒 SL: 3360
💰 TP: 3120
✅ RRR ≈ 1:15
This is a "swing short with conviction" kind of setup, where patience = profit.
🔁 5. Key Confirmation Points
Watch for lower lows and lower highs to continue
Price closing below 3290 = full confirmation
If Gold reclaims 3360 = setup invalidated
💬 Comment “Sniped Gold 🥷💰” if you took this short!
📌 Save this chart for OB + Fib zone study
🎯 Post your entry/exit levels — let’s compare setups
ETHUSD - Consolidation Zone Analysis | Watch $2700 Breakout📊 Ethereum (ETHUSD) is currently trading within a consolidation zone between key support at $2458 and resistance near $2720 on the 1H timeframe.
🔹 Breakout above $2700 could indicate potential bullish momentum continuation.
🔻 Breakdown below $2450 may suggest bearish sentiment gaining control.
The price has been moving sideways, showing indecision and reduced volatility. Traders often monitor such range-bound phases for potential breakout opportunities in either direction.
⚠ This chart is for educational and analytical purposes only. It is not financial advice. Always do your own research and risk management.
---
🔖 Key Levels:
• Resistance: $2720
• Support: $2458
• Bearish zone under: $2500
#ETHUSD #Ethereum #CryptoAnalysis #TechnicalAnalysis #TradingView #PriceAction

EURUSD Mirror Market Concept – Retest Before Bullish Expansion 🔍 Analysis Summary:
This EUR/USD setup is constructed using the Mirror Market Concept (MMC), which identifies price behavior patterns that tend to "mirror" across central zones or key support/resistance levels. The chart highlights multiple "Ellipse + Central Zone" regions that represent strong consolidation and price decision areas, reflecting symmetry in market reactions.
📈 Key Technical Insights:
Central Zones & Ellipses: These are repeated zones where price action has shown symmetry in both accumulation and distribution phases. Watch how these ellipses mirror prior moves, indicating likely zones of reaction.
Previous Target & Reversal Area : The market completed a leg to the previous target (around 1.1410), followed by a rejection from a major resistance zone, initiating a reversal. This aligns with the Mirror Market structure, where the move downward reflects the previous bullish leg.
Support Level: A significant support zone has been marked near the 1.1275 level. Price action reversed from here, respecting this base and forming a reversal zone.
Retesting Phase: After bouncing from support, the price is entering a retesting phase around the 1.1330 level (identified ellipse). This retest is critical—if held, it could trigger bullish continuation.
Major BOS (Break of Structure): Once price breaks and sustains above the 1.1360–1.1380 region, it will confirm the BOS and pave the way toward the final Target Zone at 1.1450–1.1470.
🎯 Trade Plan Overview:
Bullish Scenario: Look for confirmation of support near 1.1320–1.1330 during the retest. If price holds and forms bullish structure (e.g., higher lows, bullish engulfing), consider long setups targeting 1.1450.
Bearish Invalidator: A breakdown and close below the support level at 1.1275 would invalidate the bullish bias and call for reevaluation of the setup.
🧠 Final Thoughts:
This analysis reflects the mirror behavior of price and the market psychology around equilibrium zones. MMC provides a structured way to anticipate future price action by understanding how historical reactions unfold. Watch key zones and wait for confirmation before engaging.

JPY/USD Deep Analysis Using MMC – Curve Zone + Volume Burst Zone📌 Overview:
Today’s chart setup on JPY/USD demonstrates a classic Mirror Market Concept scenario, where price mimics past structure and behavior to create high-probability trade setups. We are looking at a textbook reversal with a rounded bottom forming right above a key Support Zone—signaling a strong potential move upward.
This is not just a basic support bounce. It’s a multi-layered confluence where structure, volume, and price action come together to build a strong bullish narrative.
🌀 Phase 1: The Curve Zone Support (Accumulation)
The Curve Zone Support (marked clearly on the chart) sits right above 0.006890–0.006910.
Price touched this zone multiple times without breaking it, forming higher lows—a typical sign of accumulation.
This pattern resembles a “rounded bottom” or cup shape, indicating that sellers are getting exhausted and buyers are slowly stepping in.
💡 Market Psychology: This is where smart money begins to accumulate positions, absorbing panic sellers while price coils up.
🧱 Phase 2: SR Interchange + Central Zone Reaction
Notice the SR Interchange Zone around 0.006950. Previously it acted as a resistance, but price broke above and now respects it as support.
This is a textbook SR flip, confirming that this level holds weight.
The Central Zone, formed earlier, is where a battle between bulls and bears took place. Now price is creeping back toward it.
🧠 Mirror Market Concept Insight: Market tends to repeat structure. The earlier bullish rally from the same base level is a mirrored version of what’s forming now. That’s why this concept gives us confidence in projecting future price moves.
🔊 Phase 3: Volume Burst Area – The Target Zone
We’ve marked a Volume Burst Area around 0.007040. This is where heavy buying occurred before a sharp decline.
According to MMC, these areas often act like magnets—price gravitates back toward them once demand builds up below.
If price clears the midpoint (50% retracement) around 0.006960, it opens the door for a bullish breakout toward the volume cluster.
🎯 Trade Plan Based on This Setup:
Component Details
Entry Zone 0.006920 – 0.006930 (buy zone)
Stop Loss Below 0.006890
First Target 0.006980 (mid-level reaction)
Final Target 0.007000 – 0.007040 (Volume Zone)
🧬 MMC Confluences That Make This Setup Powerful:
✅ Curve Zone Support – Foundational base for entry.
✅ SR Flip (Interchange) – Old resistance turned support.
✅ Volume Burst Area – Target based on prior aggressive moves.
✅ Structure Break – Bullish structure shift as price forms higher lows.
✅ Psychology – Accumulation turning into expansion.
🏁 Final Thoughts:
This chart is a great example of how Mirror Market Concepts can unlock the hidden patterns of the market. It’s not just technicals, it’s also about understanding how traders think and how price reflects those emotions.
When you combine curve structures, SR interchanges, and volume dynamics, you’re not guessing—you’re anticipating. If price respects this structure, this could be a clean move toward 0.007000+, offering a great risk-to-reward ratio.

Silver (XAG/USD) Analysis Using Mirror Market Concepts + Target📌 Overview:
In this analysis, I’ve applied MMC (Mirror Market Concepts) to Silver’s recent price action. MMC helps traders like us identify symmetry, psychological zones, and repetitive structures in the market. This chart is a textbook example of how buyers and sellers leave patterns behind that we can mirror to predict what comes next.
Let’s dig deep into this elegant setup 👇
📈 1. The Curve Zone Support – Foundation for the Move
At the base of the chart, you’ll notice a curved support zone drawn in black. This isn’t just any random support—this is a rounded structure that shows how price gradually transitioned from bearish to bullish over time.
This Curve Zone Support indicates:
Sellers are getting exhausted.
Buyers are quietly stepping in, absorbing all sell-side pressure.
The market is preparing for an upside breakout.
This zone also aligns with mirror behavior—what price did before, it's setting up to do again.
🟣 2. Mirror Market Concepts in Action
MMC teaches us to reflect past structures into the future. Here’s how it plays out:
Previous dips into the curve zone were followed by strong bullish pushes.
Recent price action mimics earlier structures, forming mini-cups and curved bases.
This behavior suggests that Silver is mirroring its own bullish reversal structure again.
It’s like watching history repeat itself—with new energy.
🟡 3. Demand Zone + Break of Structure (BOS)
Around the $33.00 level, price dipped into a marked demand zone (highlighted in light purple). This is where buyers jumped back in and pushed price up again—proving strong interest at this level.
You’ll also notice a Minor Break of Structure (BOS) above this demand zone, showing:
A small, but significant shift in market sentiment.
Short-term trend change from bearish to bullish.
Fuel for the next leg up.
This BOS acts as confirmation that price is ready to move toward the target.
🎯 4. Targeting Major Resistance – $34.50 Zone
The ultimate goal is the Major Resistance Zone around $34.50. This zone has been tested before and caused strong rejections. But here’s the key difference now:
Price is approaching this level with momentum, structure, and buyer interest.
If MMC continues to play out, this zone could be taken out or at least retested for potential breakout continuation.
This area is marked as your Target Zone and is aligned with the mirrored projection.
🧠 5. What the Market Psychology Tells Us
Let’s not just read candles—let’s read the mind of the market:
Buyers are patiently absorbing every dip.
Sellers are losing control at each attempt to push price down.
The curve base structure is signaling accumulation.
Demand zones are holding perfectly.
Minor BOS adds more weight to bullish bias.
All these are classic MMC psychological footprints.
⚙️ Trade Plan (Educational Purpose Only):
🔹 Bullish Bias:
Entry: On confirmation above the minor BOS or demand retest.
Stop: Below the recent demand zone.
Target: $34.50 Major Resistance area.
🔹 Bearish Watch:
If price rejects from the curve or fails to hold above demand zone…
Price could revisit $32.50 or lower to re-test curve zone again.
📘 Final Thoughts:
This chart is a masterclass in how Mirror Market Concepts work. From the curve zone support to the demand hold, and now a clear target in sight, everything is lining up beautifully.
If you’re a price action trader, this is the kind of structure you wait weeks for.
If the bullish scenario plays out, we could see Silver make a strong run toward the $34.50 resistance zone in the coming days.
Keep your eyes on:
Curve zone support holding
Demand confirmation

XAUUSD (Gold/USD) – Smart Money Setup with Key Zones & Target 🧠 Market Summary:
This chart shows a classic Smart Money Concept (SMC) play. We're looking at how big players (banks, institutions) trap retail traders, push price through liquidity zones, and move toward their real targets.
📌 Detailed Breakdown:
1️⃣ Ellipse Zone (Left Side – Accumulation Phase)
This shaded ellipse shows where price was moving sideways in a tight range. This is a classic accumulation zone, meaning big players were quietly building their long positions.
✅ Price stayed in this range from May 20–21 before breaking out with strong bullish candles.
👉 What this means: Institutions are loading up. Once they’re filled, they push price upward fast.
2️⃣ Central Zone of Market (Green Diamond)
After the breakout, price made a small pause/retest, which we marked with a green diamond.
This is a re-accumulation area—a temporary consolidation before another push up. It’s also a mid-point, showing the “central engine” of this price move.
👉 What this means: Market still bullish here, collecting more orders.
3️⃣ Major Resistance Zone (Top of Chart)
Price reached this supply zone near 3,360–3,370 and immediately faced strong rejection.
You can see:
Long wicks at the top
Bearish pressure stepping in
Start of a curve formation
👉 What this means: Big players are offloading their long positions and preparing for a reversal.
4️⃣ Rounded Top Curve (Distribution Phase)
Notice the arc shape drawn over the candles.
This is a distribution pattern — a rounding top that shows price is topping out slowly. It’s often a sign that smart money is exiting while trapping late buyers.
🔻Price then dropped aggressively, breaking structure.
5️⃣ BOS (Break of Structure)
A major bearish signal occurred here.
Price broke a recent low and created a BOS (Break of Structure) — a strong confirmation that the market has shifted from bullish to bearish.
👉 What this means: Now we look for retracement entries to go short.
6️⃣ 50% Retracement + Reversal Area
After the BOS, price pulled back to the 50% Fibonacci level and hit a small resistance zone (highlighted in purple). This is a classic area for smart entries.
✅ This level rejected price again — showing bearish confirmation.
7️⃣ Target Zone – 3,330.055
A clean, well-defined target area where:
Liquidity rests
Previous orders may get triggered
Market could react strongly
👉 If price pushes into this zone again, expect a reaction (either continuation or a reversal).
8️⃣ Support Zone – 3,290.345
This is your final support zone if the market continues to drop.
If price breaks this support, it could open room for a larger bearish move.
🎯 Trading Plan (Example):
📈 If price retraces to 3,330.055 and shows rejection → consider short setup
📉 Watch 3,290.345 for bounce or breakdown
❌ Invalidation: Break above 3,370 (major resistance)
💡 Bonus Tip – Trading Psychology:
“Smart money doesn’t chase. It waits for the trap to be set, then strikes with precision.”
Stay patient. Don’t rush entries. Let price come to your zones.
🏁 Summary:
This chart is a full example of smart money manipulation, showing:
Accumulation → Expansion → Distribution → Breakdown
BOS + 50% retrace = high-probability short
Key zones: 3,330 (Target) & 3,290 (Support)
📢 Don’t Forget:
If this analysis helped, drop a like, share, or comment your view below!
#XAUUSD #GoldAnalysis #SmartMoney #PriceAction #TradingView #Minds #ForexStrategy #GoldSetup #SMC #LiquidityZones
