2025-04-22 - priceactiontds - daily update - daxGood Evening and I hope you are well.
comment: Bullish. I want to believe that the market can not go above 21700 but 5 consecutive daily bull bars say duck yo puts. Above 21700 no more resistance until 22000. If bulls fail, down we go to likely another higher low above 21250. Everything below 21200 is a big bear surprise.
current market cycle: trading range
key levels: 20000 - 22000
bull case: Bulls are heavily favored if they break above 21700. There is no more resistance then, since we would then be making higher highs and today we closed above the daily 20ema. 21480 must hold, otherwise this was a bull trap and we could continue to range between 21000 - 21700. Measured move up from today is exactly 20000.
Invalidation is below 21470.
bear case: Bears not doing enough and even bad news could not get follow-through selling going. Above 21700 last bears have to cover because we will likely go for 22000 again. If they somehow manage to get below 21470, this continues inside the current trading range 21000 - 21700. Bears can still argue that even the 5 consecutive daily bull bars happened but bulls are not advancing much and they can not close a daily bar above 21500. EU close was 21439. So very low probability that 21700 will hold and we go down again.
Invalidation is above 21700.
short term: Neutral. Want to lean bullish but I won’t buy into big previous resistance. Above 700 on good momentum I’m long for 22000. Shorts only below 21470.
medium-long term from 2024-03-16: Bear trend is ongoing but for now I still think 19500 and below is an amazing buy if you can hold for years. Things will have to turn really bad for this market to find acceptance below the bull trend line from the covid lows and right now this trade war is just front running. Markets were not priced for risk 3 weeks ago but this drop was too much too fast. My bearish targets for this year are met and with the current environment I will not call for lower prices than 19000. If the trade war turns real bad, yeah sure but for now it’s not.
current swing trade: None
trade of the day: Long the breakout above 21365. Clear breakout with immediate follow-through. 15m tf or higher was way better to trade than lower ones.
Priceaction

BTCUSDT – Absorption in progress...📊 BTCUSDT – Absorption in progress, swing high targeted before a potential dump?
Price is moving in a clean bullish structure with a confirmed Break of Structure (BOS),
but under the surface, we can clearly see signs of absorption, which could signal an upcoming reversal.
📈 Open Interest is rising sharply
🟢 CVD Futures & Spot are both rising → real buying pressure
🔴 Funding remains negative
📊 85% of open positions are longs
🐋 Top traders are massively short
🧱 ➤ Clear absorption: price goes up… but someone is selling into it hard
🎯 Current hypothesis:
🧠 Longs are being absorbed,
suggesting a short-term rejection is likely,
but before that, price might push higher toward the swing high (92.5–93.5k) to:
Hunt liquidity
Trigger stop losses
Finalize the short trap
📌 Trade plan:
✅ Spike above the swing high
✅ Final absorption / wick trap
✅ Dump back into the Reload Zone (FIB 61.8–78.6%)
❗ Rule: don’t front-run – wait for confirmation:
Sharp rejection after the spike
Spot CVD divergence
Loss of structure + drop in OI
⚖️ The market is tense.
We are likely between the top of absorption… and the beginning of the flush.
Stay patient. Watch closely. Only act on clear confirmation.
🔽Fr🔽
📊 BTCUSDT – Absorption en cours
Le prix évolue dans une structure haussière propre avec un Break of Structure (BOS) validé,
mais les dessous du marché révèlent une absorption nette, qui pourrait annoncer un retournement.
📈 Open Interest en forte hausse
🟢 CVD Futures & Spot haussiers → pression acheteuse réelle
🔴 Funding négatif persistant
📊 85 % de longues sur le marché (Kingfisher)
🐋 Top traders en short massif
🧱 ➤ Absorption claire : le prix monte… mais la contrepartie absorbe tout
🎯 Hypothèse actuelle :
🧠 Une absorption des longs est en cours,
ce qui laisse penser qu’un rejet est probable à court terme,
mais avant cela, le marché pourrait encore pousser vers le swing high (92.5–93.5k) pour :
Chercher la liquidité
Déclencher les stops vendeurs
Finir le short trap
📌 Plan envisagé :
✅ Spike au-dessus du swing high
✅ Absorption finale / mèche piégeuse
✅ Dump en direction de la Reload Zone (FIB 61.8–78.6 %)
❗ Règle : ne pas anticiper – attendre confirmation :
Rejet brutal après le spike
Divergence CVD Spot
Perte de structure + chute OI
⚖️ Le marché est tendu.
On est probablement entre le haut de l’absorption… et le début de la purge.
Rester patient. Observer. Agir sur signal propre.

USDCHF Daily, H4,H1 Forecasts, Technical Analysis & Trading IdeaMidterm forecast:
0.84000 is a major resistance, while this level is not broken, the Midterm wave will be downtrend.
OANDA:USDCHF
Technical analysis:
A trough is formed in daily chart at 0.80385 on 04/21/2025, so more gains to resistance(s) 0.83314 and maximum to Major Resistance (0.84000) is expected.
Take Profits:
0.83314
0.84000
0.85430
0.86286
0.87550
0.89147
0.90367
0.92218
0.94400
__________________________________________________________________
❤️ If you find this helpful and want more FREE forecasts in TradingView,
. . . . . . . . Hit the 'BOOST' button 👍
. . . . . . . . . . . Drop some feedback in the comments below! (e.g., What did you find most useful? How can we improve?)
🙏 Your support is appreciated!
Now, it's your turn!
Be sure to leave a comment; let us know how you see this opportunity and forecast.
Have a successful week,
ForecastCity Support Team


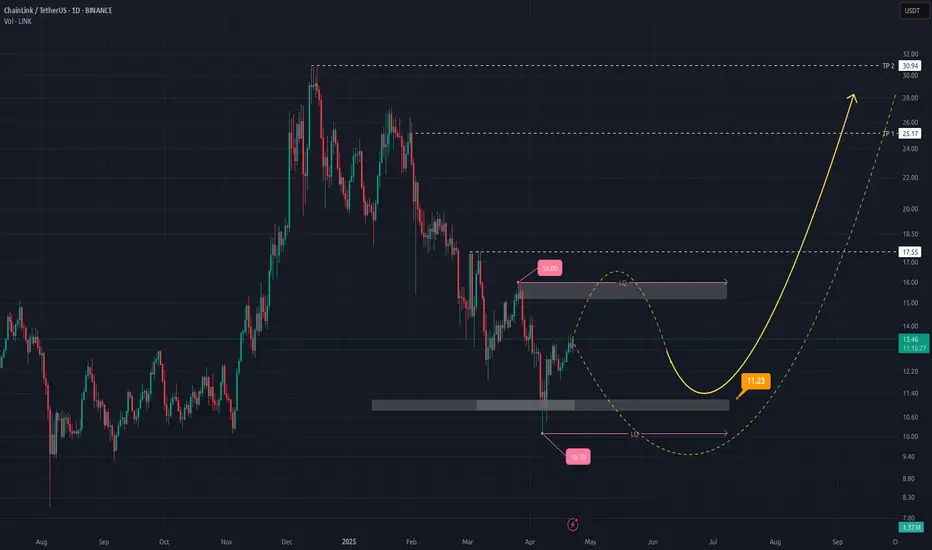
ChainLink (LINK/USD): A Bullish Breakout on the Horizon?Hey there, traders! Let’s take a closer look at ChainLink (LINK/USD) on the daily chart. There’s some interesting action that might point to a bullish move, but let’s break it down with a bit of caution to see if the stars are truly aligning.
Price Action
After a consistent downtrend, we’re seeing a potential shift at $11.23. There’s a bullish reversal candle showing up here, which could suggest buyers are stepping in at this key support level. It looks promising, but we’ll need more confirmation to be sure this is a real trend change.
Volume
The volume at this reversal point is picking up, which is a good sign—those bars are taller than the recent average. This might mean stronger buying interest, but it’s not a massive spike, so I’d keep an eye on whether this volume trend continues to support the move.
Pattern
Looking at the bigger picture, it seems like a cup-and-handle pattern could be forming. The price has rounded out (the “cup”) and is now consolidating (the “handle”). If LINK can break above the $16.00 resistance, we might see a bullish breakout—but this pattern isn’t fully confirmed yet, so let’s stay alert.
Potential Targets
If we do get that breakout, here’s what we might aim for:
TP1: $24.17 – A possible first target.
TP2: $30.04 – Could happen if momentum builds.
TP3: $32.00 – A stretch goal, but only if the bulls really take charge.
Key Support
The $11.23 support is our critical level to watch. If the price drops below this, the bullish setup could be in trouble, so let’s not get too ahead of ourselves.
Wrap-Up
We’ve got a reversal candle, some increased volume, and what might be a cup-and-handle pattern forming, so LINK could be setting up for a bullish move. But it’s not a done deal yet—breaking above $16.00 will be the real test. If you’re thinking of jumping in, set a stop-loss below $11.23 and manage your risk carefully. What do you think—could this be the start of something big? Let’s watch and see! Happy trading! 🚀
DXY Bearish Pennant Breakdown | More Downside Ahead?The U.S. Dollar Index (DXY) has broken down from a well-defined bearish pennant pattern on the 4H chart, signaling continuation of the prevailing downtrend.
🔹 Technical Setup:
Pattern: Bearish Pennant
Breakdown Level: Below 99.00
Target: ~94.50 based on pennant pole projection
Confirmation: Clear follow-through after breakdown, low volume consolidation
🔹 Fundamentals:
Weak U.S. economic data and dovish Fed expectations continue to weigh on the dollar.
Rising gold and commodity prices further support DXY downside.
📌 Outlook: As long as DXY trades below 99.00 resistance, bearish momentum is likely to extend toward the 94.50 target zone.
NOTE: This is not financial advice. Trade at your own risk. Always do your own research.

GOLD 30M ANALYSISIn this analysis we're focusing on 30m time frame for GOLD. To identify the best buying area and POI for our buy trade setup. In this chart price is creating trendline support and also price break it's previous high. So overall market trend was bullish. According to the market trend my Bias was also bullish. Let's see when price retest and come to our entry zone. Once price comes observe the behavior of price and if price give any bullish confirmation then we'll execute our trade. Let's delve deeper into these levels and potential outcomes.
Always use stoploss for your trade.
Always use proper money management and proper risk to reward ratio.
This is just my analysis.
#XAUUSD 30M Technical Analysis Expected Move.

22.04.25 Morning ForecastPairs on Watch -
FX:AUS200
FX:AUDUSD
FX:EURUSD
FX:GBPUSD
A short overview of the instruments I am looking at for today, multi-timeframe analysis down to what I will be looking at for an entry. Enjoy!

USD/JPY in Free Fall: What’s Behind the Break Below 140?🔍 Technical Analysis – USD/JPY
The weekly chart shows a sharp rejection in the macro zone between 155–158, where strong supply is present (highlighted in red). After brushing historical highs, USD/JPY experienced a vertical drop down to 140, decisively breaking through the key zone at 148–146.
Price has now broken the weekly structure and is approaching an area that previously triggered significant rallies (blue zone between 138–141). Monthly support is in danger, with the RSI deeply in oversold territory, but no clear reversal signals just yet.
📊 COT Report – USD Index
Asset Managers: Slight recovery on long positions, but still in neutral territory.
Leverage Money: Increasing net shorts, indicating speculative bets against the dollar.
The divergence between the falling USD Index and speculative positions confirms a growing lack of confidence in the greenback.
📊 COT Report – JPY Futures
Asset Managers: Strong increase in long positions on the yen since December 2024.
Leverage Money: Reinforcing long bias since February 2025.
This confirms that institutional players are accumulating yen, possibly anticipating BoJ interventions or a broader flight-to-safety.
💥 Trade Outlook
USD/JPY is in full bearish breakout mode. If the 140 level breaks decisively, the next technical targets are:
137.00 → historical mid-level support
134.00 → base of the 2023 structure
Keep an eye on the RSI: a bullish divergence with strong volume could trigger a technical rebound. But as long as the overall sentiment remains strongly risk-off, every rally is a selling opportunity.

EURUSD ANALYSISEUR/USD – 2H Bullish Continuation Play
Following a sharp breakout, EUR/USD is gracefully pulling back toward the 1.1095–1.1149 demand zone, now acting as support. This zone holds significance as a potential launchpad for the next bullish wave.
A higher low formation here could ignite continuation toward 1.1471, with extended upside into 1.1605, presenting a clean and favorable risk-to-reward opportunity.
The structure is clear, the momentum is aligned, and the setup reflects a well-composed bullish scenario ideal for patient and precise execution.
▫️ Impulsive breakout
▫️ Retracement to demand zone (1.1095–1.1149)
▫️ Looking for higher low → continuation
🎯 TP1: 1.1471
🎯 TP2: 1.1605
🛡️ Clean R:R, perfect for trend followers.
#EURUSD 2H Technical Analysis Expected Move.

GOLD TODAY OUTLOOKXAU/USD – 30-Minute Technical Setup
Gold has been gliding upward, respecting a clean ascending structure, printing higher highs with strength. But as price taps into the $3,242–$3,267 supply zone, momentum begins to fade.
A potential rejection here signals a structural shift. If the trendline breaks, we could see a clean move down toward the $3,176 demand zone, with $3,203 acting as soft interim support.
This setup reflects precision and patience , anticipating a transition from bullish strength to calculated bearish correction, with a balanced risk-to-reward approach.
Confirmation is very important.
Always use stoploss for your trade.
Always use proper money management and proper risk to reward ratio.
This is just my analysis.
#XAUUSD 30M Technical Analysis Expected Move.

2025-04-21 - priceactiontds - daily update - nasdaqGood Evening and I hope you are well.
comment: Very good trend by the bears but the close was bad for them. Giant tail below this daily bar and if they can not keep the market from retracing more than this 50%, we could reverse this to test 18200+ again. If we stay below 18000, I heavily favor the bears but for now I’m rather neutral and assess where we are before EU opens tomorrow.
current market cycle: bear trend continues for now
key levels: 16000 - 18500
bull case: Bulls need to break above the 50% retracement for today and can then continue higher to test the upper bear channel line around 18300. Any tariff news could get us there but todays news were bad at best. Bulls don’t have much until they reverse this day and claim 18170 again.
Invalidation is below 17700.
bear case: Bears got the breakout below and are on their way of retesting the lows but they have the problem, that we have not seen two consecutive decent trend days since 3 weeks ago when we sold from 20000. So what are the odds of another strong bear day tomorrow? Very low. Best for bears would be, if they kept the market below the 50% pb from today below 17940. This would leave a giant open gap and increase the odds of continuation down. Right now the bear channel down is very broad and I don’t think many bears will hold above 18000 and a decent bar above the 1h 20ema. If today was indeed the acceleration of this potential W5, we should see another strong trend day tomorrow and go for 17000.
Invalidation is above 18050ish.
short term: Bearish if we stay below 18000. Right now channel is broad and could go up to 18300. 1h 20ema should be latest resistance by the bears or we will likely test 18200 or 18300. If we continue down, next support is 17400, then my measured move target around 17250 and below is 17000.
medium-long term - Update from 2024-04-20: My most bearish target for 2025 was 17500ish, given in my year-end special. We had the clear W1 and W3 but now it’s messy.
trade of the day: Short from Globex open.

BTC - Bulls Charging... However!Hello TradingView Family / Fellow Traders. This is Richard, also known as theSignalyst.
As per our last analysis (attached on the chart), BTC rejected the blue trendline support and has been bullish in the medium term. 📈
However, the overall sentiment remains bearish, as BTC is still trading within the falling channel marked in red. 📉
For the bulls to take over long term and initiate the next impulsive wave, a break above the $91,000 major high in blue is needed. 🔵
Meanwhile, BTC may still retest the blue trendline — where we’ll be looking for new short-term longs. 🎯
📚 Always follow your trading plan regarding entry, risk management, and trade management.
Good luck!
All Strategies Are Good; If Managed Properly!
~Rich

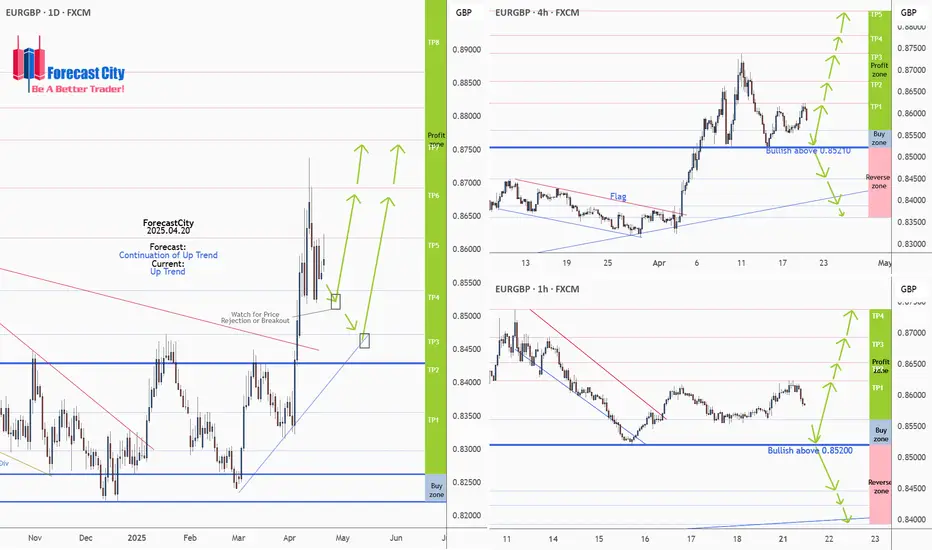
EURGBP Daily, H4,H1 Forecasts, Technical Analysis & Trading IdeaMidterm forecast:
0.84290 is a major support, while this level is not broken, the Midterm wave will be uptrend.
We will close our open trades, if the Midterm level 0.84290 is broken.
OANDA:EURGBP
Technical analysis:
A trough is formed in daily chart at 0.83220 on 04/03/2025, so more gains to resistance(s) 0.86175, 0.86923, 0.87647 and more heights is expected.
__________________________________________________________________
❤️ If you find this helpful and want more FREE forecasts in TradingView,
. . . . . . . . Hit the 'BOOST' button 👍
. . . . . . . . . . . Drop some feedback in the comments below! (e.g., What did you find most useful? How can we improve?)
🙏 Your support is appreciated!
Now, it's your turn!
Be sure to leave a comment; let us know how you see this opportunity and forecast.
Have a successful week,
ForecastCity Support Team
21.04.25 Morning ForecastPairs on Watch -
FX:EURNZD
FX:EURAUD
FX:EURUSD
FX:AUDUSD
A short overview of the instruments I am looking at for today, multi-timeframe analysis down to what I will be looking at for an entry. Enjoy!

GBP/USD in terminal phase? This zone could flip everything!📊 Technical Analysis
Price is currently trading in a strong weekly/monthly resistance zone around 1.3390–1.3400, marked by a dense multi-layer supply area. Historically, this level has caused sharp rejections.
From the lows, price completed a steep bullish leg, breaking through several structures. However:
Momentum seems overstretched.
RSI shows potential overbought signals.
There's a likely bearish target zone between 1.2950 and 1.2850, which is a key demand area.
📌 Trade Setup:
I’m watching for exhaustion signals or bearish confirmations on H1 to short from the current resistance, targeting the grey and turquoise zones below 1.30.
🧾 COT Report – GBP
Large Speculators (Asset Managers) still hold a net short position, although they've reduced exposure in recent months.
Leverage Funds remain slightly long, but without strong conviction.
💵 COT Report – USD
Leverage Funds have turned significantly net long on the dollar (strong green line upward since March).
This supports a bearish view on GBP/USD, as USD strength returns.
📉 Summary:
Price is at a key decision zone. A technical correction is possible. COT data supports this view:
GBP remains weak on the institutional side.
USD is regaining strength.

SBIN Breakout Alert | Strong Volume + RSI Confirmation🔍 Chart Analysis Summary
Pattern: Stock has broken out of a clear consolidation range (highlighted in blue), suggesting bullish momentum.
Volume Spike: Notable surge in volume (blue arrow), confirming the breakout strength.
RSI: RSI has broken above the 60–65 zone, indicating strong bullish momentum.
Price Action: The breakout occurred above ₹775–₹780 resistance, now acting as support.
🟢 Recommendation: BUY
Action Level (INR)
Buy Above ₹785–₹790 (on minor dips or current price)
Target 1 ₹835
Target 2 ₹875
Stoploss ₹755 (below the breakout support zone)
for educational purposes only

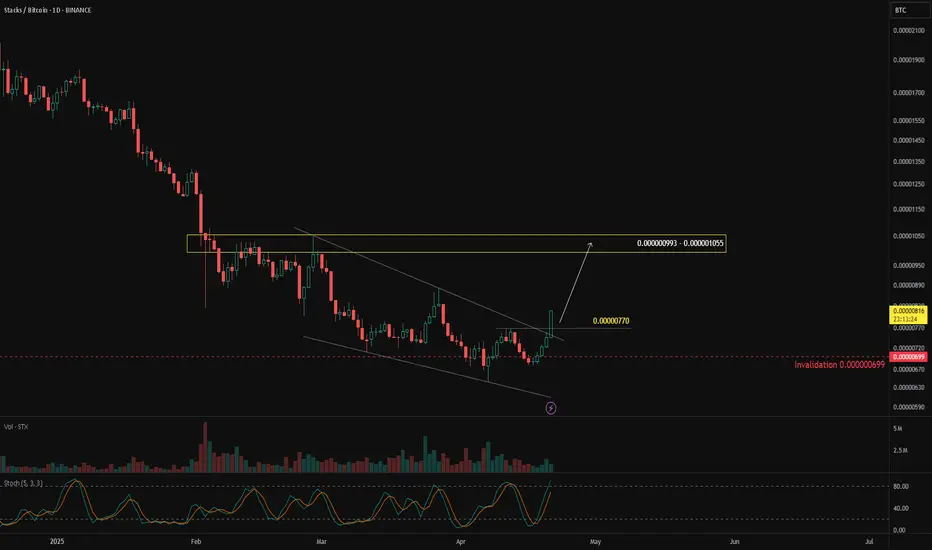
Will STX Outperform Bitcoin?In the crypto market, if you want to beat the market, your benchmark is $CRYPTO:BTCUSD. That means to outperform the crypto market, you need to outperform Bitcoin.
One way to measure this is by watching crypto/BTC pairs, such as $BINANCE:STXBTC. If $BINANCE:STXBTCgoes up, it means STX is stronger than BTC. If it goes down, BTC is stronger than STX.
On the daily chart, BINANCE:STXBTC has been moving downward, but over the past month, sellers seem to be losing momentum—indicated by a falling wedge reversal pattern.
A bullish breakout above 0.000000770 would confirm the pattern, with a potential upside target at 0.000000993 – 0.000001055. This scenario remains valid as long as price holds above 0.000000699.
#202516 - priceactiontds - weekly update - wti crude oilGood Evening and I hope you are well.
comment: Expanding triangles are my least favorite structure and we are in one. I have no bias here because both sides have reasonable arguments. Bulls just want this selling to become a bear trap and test up to the upper bear trend line around 69 and bears can see it as a bear flag that tested the 50% retracement of this bear leg.
current market cycle: trading range on the monthly chart - daily chart is a bear trend that could be transitioning into a trading range again
key levels: 55 - 69
bull case: Bulls see it as a failed acceleration down and want to retest the prior bear trend line around 68. Same target as last week but this week they closed the weekly bar above 64 which was my line in the sand. If they continue here, they will likely squeeze much higher again. 69 next target.
Invalidation is below 60.
bear case: I give the bears one more day to form a strong reversal but the odds are low. This breakout could go much higher and Friday looks like a give-up bar. Argument for the bears is that we are still at the 50% retracement and the breakout-retest of the March low 64. Any prices above 64.2 is invalidation for the bears. I will only view this as bearish again, if bears break the bull trend line from the 54.48 low and that’s currently around 61.
Invalidation is above 64.2.
short term: Neutral at 64. Above 64.2 bullish and only below 61 I think bears have taken control again.
medium-long term - Update from 2025-04-20: This does look like another bear trap below 60, which was to be expected. Depending on next week I will write some more here. For now It’s still a bear trend until bulls can reclaim 72.

#202516 - priceactiontds - weekly update - nasdaq
Good Evening and I hope you are well.
comment: Neutral and very similar to dax, as most of the time. I do think we will see one more leg down in this current bear trend before we could go sideways for longer, until earnings become the absolute fucking shitshow I expect them to become. We get daily news about big companies not exporting to China or to the US due to tariffs. No one believes this will go down smoothly. Bear trend line holding so far, 50% retracement for this bear trend was 19483 and the spike high last week was 19388 and bulls could not get above it this week. The daily 20ema is also right above us and every time market touched it, we sold and closed below. Triangle will likely break on Tuesday and I am having wet dreams about going below 17000 again.
current market cycle: bear trend but above 19388 it ends and we will be in a giant trading range
key levels: 15500 - 19500
bull case: Bulls want this trend to end and crush the hopes for a third leg down. That has not changed. Their only target is 19388 and if they get it, market is completely neutral and they will likely go for 20000 again. Bulls still have the triangle argument but below 18100 that is gone as well. At this point I think only very positive news could save the bulls. Market is likely waiting for big earnings next week and if Tesla surprises downwards, we will hopefully crash this m* again.
Invalidation is below 18000.
bear case: Last week my assumption was that the tariff exemptions were enough to pump this above the bull spike from the previous week but that failed and we went lower since. If even that can not lift the market to higher highs, what will? Only a big agreement with the EU and/or China. How likely is that? This US government doesn’t even know how to articulate their goals in negotiations, how do you think you could guess it? Market is in maximum limbo and since we are still somewhat high enough, we could see more risk-off trading. Until bears can get below 18000, we likely continue sideways. 3 big resistances held and the bear trend line is intact. Bears are heavily favored to continue down and I expect a third leg. Can the third leg get much below 16400? I don’t know but I doubt it. Only a deep recession would get us there and for that we would need earnings going real bad. Below 18000 I expect 17200 to be the next big support but a retest of 16400/16500 could happen.
Invalidation is above 19388.
short term: Neutral. Sideways most likely until a clear breakout above or below. Below 18000 we could do 17500 or 17000 fast. Above 19388 market is free to test much higher again.
medium-long term - Update from 2024-04-20: My most bearish target for 2025 was 17500ish, given in my year-end special. We had the clear W1 and W3 but now it’s messy.
Only a big tariff agreement news can move the markets and that can go either way. You have no edge in guessing what will happen, so having huge swing positions right now does not make much sense. If earnings go bad, we will go much lower. What is the next big support to be hit? The lows of 2022 at 12565. Can we really get there? With a deep recession and some bigger failings, sure but for now it’s unrealistic to expect it.

ZRO: Altcoin hero?If you find this information inspiring/helpful, please consider a boost and follow! Any questions or comments, please leave a comment!
ZRO is worth keeping on the radar. Out of most altcoins it arguably has the cleanest setup for a potential bullish reversal—at least structurally.
While it could be done here, I’m leaning on the idea that the Y wave still needs one more leg down. That’s typically the behavior we see: Y waves tend to be slower and more drawn out compared to the W wave. If that holds true again, the ideal target zone falls between $2.12 and $1.88. That would allow for a proper test of structure while staying within the bounds of the larger corrective patterns most likely target.
This is still a bullish interpretation—but only after one more low and a meaningful reaction from it.
That said, both the bull and bear counts are pointing down in the near-term. My personal invalidation sits above the (c) wave high. If ZRO clears that, this setup likely needs to be re-evaluated. Until then, any move beyond the orthodox end of wave A of the Y leg should be considered “enough” from a pattern swing perspective.
Patience here could pay off—especially if price enters the key zone and shows strength.
Trade safe, trade smart, trade clarity.

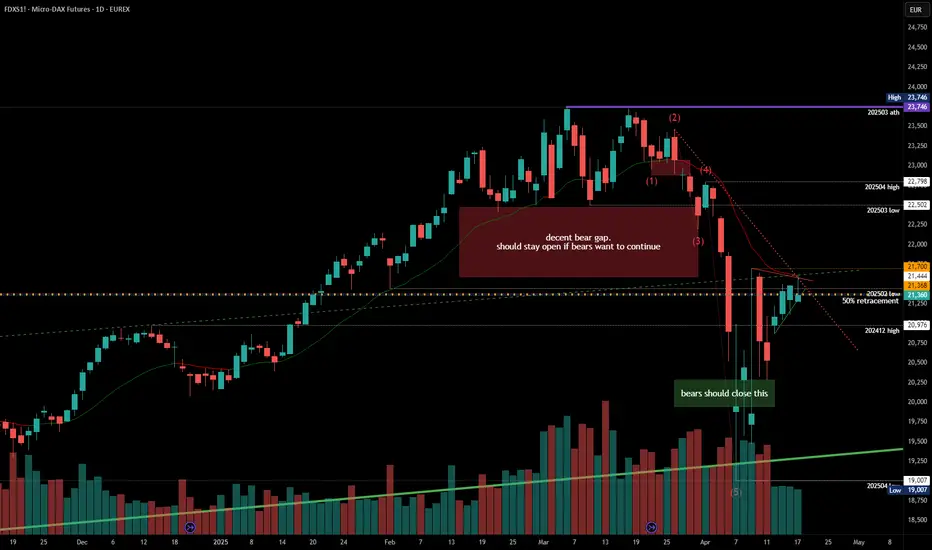
#202516 - priceactiontds - weekly update - daxGood Evening and I hope you are well.
comment: Neutral but below 21300 really bearish if the selling is decent. I do think we saw a double top bear flag past 2 weeks and are going down from here. Invalidation is clear, above 21700 I am wrong and this could go much higher because it likely means that bears are giving up. Below 21300 I expect 21000 to be hit and if a news bomb helps, much lower again. Market now failed 2 weeks at the prior upper bull trend line from 2023-05, 50% retracement for this bear trend and the daily 20ema. 3 big reasons why this will likely continue to be resistance.
current market cycle: bear trend but very likely that we have seen the lows and have transitioned to a trading range - will have a definitive answer next week.
key levels: 19000 - 21700
bull case: Decently bullish week but 21500 was and still is huge resistance. Bulls could not close anything above it and since they tried for 3 days staight, chances for them are not high that we will get the breakout above next week. Until bears can make lower lows below 21100, bulls are in control of this, since they have printed 3 consecutive bullish days and we are up 12% from the lows. Their only target now is to close a strong 1h bar above 21700 and then I think the last bears will cover and this goes straight to 22000.
Invalidation is below 21100.
bear case: Bears are keeping this a lower high but if market continues to poke at 21700, eventually it will break and more bears will cover. Bears have the 3 big arguments on their side: 50% retracement held, daily 20ema held and we have not made higher highs and so this could very well just be a giant bear flag ready to break down over the next days. Volume was atrocious last week, compared to the 2 prior weeks and next week we will likely seen a big move again. For now there are no positive news for the bulls and the trade war is in full swing. Even if we go above 21700, my base case is a revisit of 19000 or lower for the year.
Invalidation is above 21605.
short term: Neutral. Breakout is imminent and right now I very slightly favor the bears but market is currently more neutral than anything else. Bullish above 21700 and bearish below 21300.
medium-long term from 2024-03-16: Bear trend is ongoing but for now I still think 19500 and below is an amazing buy if you can hold for years. Things will have to turn really bad for this market to find acceptance below the bull trend line from the covid lows and right now this trade war is just front running. Markets were not priced for risk 3 weeks ago but this drop was too much too fast. My bearish targets for this year are met and with the current environment I will not call for lower prices than 19000. If the trade war turns real bad, yeah sure but for now it’s not.
EUR/NZD About to Explode? Traders Are Watching THIS Level!📊 General Analysis of EUR/NZD (Higher Timeframe)
1. 📌 Price Context
The price had a strong bounce from a demand zone (highlighted in light blue) around 1.85.
It then broke through multiple supply zones (gray and maroon) to the upside and is currently hovering near 1.91874.
🔍 Key Zones
🔵 Demand Zone (Support)
Range: 1.8430 – 1.8712
This zone has been tested multiple times, with long wicks to the downside → indicating strong buying interest.
A powerful bullish move originated from this area.
🔴 Supply Zone (Resistance)
Current resistance: 1.9187 – 1.9450
This is where the price is currently paused → potential rejection area.
Monthly upper zone (1M): 1.96 – 2.00
A strong long-term resistance. If reached, we might see profit-taking or even a reversal.
🕯️ Candles & Momentum
The large green candle represents a strong bullish breakout.
The weekly candle (labeled "1W") shows indecision → this could be a pause before continuation or the beginning of a pullback.
🔮 Possible Future Scenarios
✅ Bullish Scenario
If the price decisively breaks above 1.9187, the next target is 1.9600 – 2.0000.
⚠️ Bearish Scenario
If price gets rejected at current levels, it may fall back into the support zone 1.8712 – 1.8500, which has previously shown strength.
📈 Lower Indicator (Likely RSI or Wavetrend)
Currently bouncing from an oversold area.
No clear overbought signals → there’s room for more upside.
🧭 Conclusion
Current trend: Bullish (especially in the short to mid term).
Key levels to watch:
Resistance: 1.9187 and 1.96–2.00
Support: 1.8712 and 1.85
