2025-06-10 - priceactiontds - daily update - nasdaqGood Evening and I hope you are well.
comment: Range is 21500 - 22000 for a week now. Neutral but selling new highs and buying every pullback has been profitable for quite a while now. It will end some day but likely not today. Bulls finally want the 22000 print and after so many tries they still could not print it. It’s painful to watch. Fading the extremes was good for a month now and I have no bigger opinion on where we might close this week. Anything below 21700 would be a huge bear surprise and could mean the bull wedge break to the downside and next target would be 21500.
current market cycle: trading range
key levels: 21500 - 22000
bull case: Bulls expect 22000 and buy every pullback. Their problem is, that they have tried so so many times now and could still not print it. How many more times will they try? The wedge will break eventually and I highly doubt it will be to the upside. Bulls can not hold long at the highs since pullbacks are 130-500 points big. Look for longs on decent pullbacks once bears give up. Multiple times below 21800 today. When we print 22000, what are the odds of this going higher for 22500 or new ath above 22688? No idea but looking at the wedge and the structure since April, longing momentum makes sense but that’s it.
Invalidation is below 21390.
bear case: Just imagine cpi comes in hot… Bears can only dream. They are doing fine selling new highs and scalping for 100+ points. They are too weak to print lower lows, so don’t bet on them. Once we go below 21700 again, we can look for better targets and market is likely neutral again. Until then, try not to get trapped.
Invalidation is above 22100.
short term: Likely bearish around 21950-22000 for another pullback into 21750/21800. Still expecting 22k to get hit tomorrow. Rough guess: If we move strongly above 22080ish, we could see an acceleration upwards due to short covering from hell but don’t bet on it. Only go with the momentum if it happens.
medium-long term - Update from 2024-05-24: Will update this section more after the coming week but in general the thesis is as for dax. Down over the summer and sideways to up into year end. I don’t think the lows for this year are in.
trade of the day: Longing 21800 was good so many times since Friday.
Priceaction

BTCUSD – continuing to buy as breakout confirms bullish setupBTCUSD is forming a classic “cup and handle” pattern, now breaking above key resistance. Price is holding within an upward channel, and if momentum stays strong, the next target could reach 160,000 and beyond.
It might seem hard to believe, but the structure points to continued bullish momentum. I’m not missing this opportunity and continue to build long positions as this breakout develops.

EURUSD Analysis (MMC Strategy) : Structure Mapping + Target🧠 Overview
This analysis is based on the MMC (Market Mapping Concept), combining smart money principles, structure mapping, and price behavior analysis. EUR/USD has been showing strong bullish activity over the past few months, but we are now approaching a critical decision zone. Let’s break it all down.
🔹 1. Arc Structure – Accumulation Phase (Dec 2024 – Feb 2025)
The chart starts with a well-defined Arc formation, signaling accumulation by large players.
Price showed a series of higher lows within the arc, compressing volatility.
This is where smart money quietly loads positions before pushing price.
Key Insight: This arc often precedes an impulsive breakout, as seen next.
🔹 2. Central Zone Breakout (Feb – Mar 2025)
The price exploded out of the arc, breaking through the central compression area.
Marked as the Central Zone, this acted as both support and a launchpad.
This phase included imbalance filling, reaccumulation, and clean price action.
Observation: Notice the aggressive bullish candles—clear indication of institutional interest.
🔹 3. Structure Mapping & QFL Zone (April 2025)
A classic QFL (Quick Flip Level) was formed after the initial rally.
Price pulled back into a structure support zone, respected it cleanly, and bounced back.
This gave a textbook smart money entry.
Structure Mapping highlights how each leg of the trend is forming based on supply/demand reaction.
🔹 4. Major BOS – Break of Structure (May 2025)
Price broke the previous swing high, giving us a Major Break of Structure.
This BOS confirms a change in character (CHOCH) from ranging to trending.
After BOS, the market retested the breakout zone—providing a second ideal long entry for continuation traders.
🔹 5. Minor Resistance Zone (Current Price)
Currently, price is testing a Minor Resistance zone around 1.1400–1.1450.
This level acted as resistance earlier and may slow price down temporarily.
However, there’s still room for bullish continuation unless reversal patterns emerge.
Key Watch Point: If price shows weakness here (e.g., rejection wicks, bearish engulfing), short-term retracement may follow.
🔹 6. Next Reversal Zone (Projected Target: 1.1700–1.1800)
The green box above marks the Next Reversal Zone, based on historical supply, Fibonacci extension levels, and structure analysis.
Expect this area to act as strong resistance unless momentum is very strong.
This is a potential TP zone for long traders or an area to scout for short opportunities if reversal signals appear (divergence, order block rejection, liquidity grab).
📌 Key Levels
Zone Price Range Role
Central Zone 1.0800–1.1000 Support/Accumulation
Minor Resistance 1.1400–1.1450 Immediate Hurdle
Next Reversal Zone 1.1700–1.1800 Target / Short Setup
QFL Zone 1.1100–1.1200 Smart Money Entry Point
🧠 Strategy Outlook
✅ Bullish Bias: Structure is clearly bullish. Buyers are in control.
🕵️♂️ Watch for Reaction at Minor Resistance – a clean break = continuation, rejection = short-term pullback.

GU-Tue-10/06/25 TDA-Will supports hold or GU breaking down?Analysis done directly on the chart
Follow for more, possible live trades update!
Qualitative over quantitative trades, if I don't see good volume,
efficient moves with less and less drawdown I don't mind not taking
any trades even for days if it's necessary. When you control the urge
of having necessarily take trades everyday your psychology will level up a lot.
I take profits based on what the market conditions offer me and
not sticking to always have to set necessarily 1:2 RR or whatever.
It all depends on how market is doing. That's something we can't control.
Active in London session!
Not financial advice, DYOR.
Market Flow Strategy
Mister Y

USDJPY Analysis: MMC Resistance vs Major BOS (Technical View)🔍 Chart Summary:
The USDJPY pair is currently trading around 144.58, showing strong signs of structural buildup as it approaches a critical inflection point. This analysis leverages MMC (Market Mapping Concept) and price action structure to identify two possible directional outcomes — each grounded in key technical levels.
🧠 Key Technical Highlights:
📌 1. Expanding Wedge Pattern:
Price previously formed an expanding structure, signaling volatility and accumulation.
Expansion typically precedes major directional breakouts — either trend continuation or reversal.
📌 2. Downtrend Break Test:
A long-standing descending trendline has now been tested multiple times.
A confirmed breakout would be significant, indicating a major shift in market momentum.
📌 3. Resistance Zones:
Minor Resistance Zone around 158.00–160.00 marks a key supply area.
Watch for price action behavior if this level is tested — possible rejection or breakout continuation.
📌 4. Major Support Zone:
Support near 139.00–140.00, where price previously bounced, represents a solid floor and demand zone.
📌 5. BOS (Break of Structure):
Two BOS levels are marked:
Minor BOS (Around 146.00): Immediate reaction level to watch.
Major BOS (Around 149.00–150.00): If broken, could lead to sharp bullish continuation.
🔮 MMC Forecast Scenarios:
✅ Condition 1: Bullish Breakout Scenario
Price breaks above the descending trendline and clears the Minor BOS.
Target zone: 158.00–160.00 resistance.
Structure confirms bullish dominance if Major BOS is cleanly broken and retested.
⚠️ Condition 2: Bearish Rejection Scenario
Price rejects from current trendline or Minor BOS and reverses.
Potential drop toward Major Support around 140.00.
Watch for reversal confirmation with bearish engulfing candles or re-entry into expanding zone.
🧭 MMC Outlook Summary:
The chart is setting up for a key decision point. The market will either validate a bullish breakout structure or revert back into bearish continuation. These scenarios align with the MMC mapping method, providing clear conditions for traders to follow without bias.

10.06.25 Morning ForecastPairs on Watch -
FX:GBPJPY
FX:EURJPY
FX:USDCHF
A short overview of the instruments I am looking at for today, multi-timeframe analysis down to what I will be looking at for an entry. Enjoy!

GJ-Tue-10/06/25 TDA-Claimant count change negative, GJ down!Analysis done directly on the chart
Follow for more, possible live trades update!
To understand if you are really for the long term trading
your mindset should not be if I make losses
I can always fund another account again or buy new challenges
but it shifts to how can I protect my capital so I will lose less
and in the future avoiding to make same mistakes?
Active in London session!
Not financial advice, DYOR.
Market Flow Strategy
Mister Y

BTCUSD Technical Analysis (MMC) – Resistance or Target Zone🔍 Overview
Bitcoin has executed a strong bullish recovery over the past few sessions, breaking out of a well-structured bullish channel and testing a significant resistance zone. The move exhibits traits often identified in MMC strategies, including liquidity grabs, engineered price action, and trap-based breakouts.
This chart analysis combines curve support structures, channel dynamics, and resistance reactions—all crucial components of technical strategy layered with smart money behavioral cues from MMC.
🔹 Price Action Breakdown
📈 1. Blue Ray – Liquidity Shift Signal
The bullish impulse was initiated from what is labeled the "Blue Ray" zone—a deep liquidity pocket often used by smart money to trap sellers.
This area marks a liquidity sweep after a steep selloff, creating the perfect environment for institutional buy orders to fill before driving price upward.
📉 2. Channel Formation & Breakout
A clean ascending bullish channel formed during the rally, showing a methodical stair-step price climb.
This consolidation phase provided multiple reentry opportunities before a sharp breakout, which signals a transition from accumulation to expansion, often seen in MMC mapping.
🧭 3. Curve Support – Parabolic Price Action
Price hugged a curve support line, often interpreted as a parabolic base.
This curve reflects increasing momentum—buyers are stepping in earlier at each dip, creating higher lows in a tightening arc.
This structure is also commonly seen in smart money accumulation zones as price is pushed upward while retail sentiment lags.
🚧 4. Resistance Zone – High Interest Reversal Region
BTCUSD is now inside a key resistance zone (~$109,800–$111,500), which has acted as both supply and previous swing highs.
MMC traders often identify these zones as trap areas, where price gets aggressively pushed up to fill institutional short orders.
This zone contains high sell-side liquidity, meaning there's a strong chance for a reversal or false breakout.
🔄 5. Projected Reversal Zone
A potential correction could bring price down to the next reversal zone (around $106,500–$107,500).
This zone is supported by:
The curve structure, which is still active.
Previous minor resistance turned support.
Institutional demand likely waiting to reload long positions.
📉 Possible Scenarios
✅ Bullish Continuation
If BTC can break and sustain above $111,500, especially with strong volume, it will likely push into new local highs.
In this case, curve support may be used for re-entry on pullbacks.
❌ Bearish Reversal Setup
A rejection from this resistance zone—especially with a long-wick candle, engulfing pattern, or divergence—could confirm a short-term top.
MMC-style reversals often occur quickly and aggressively, trapping late buyers.
⚙️ Trade Management Insights
Trade Setup Entry Area Target Stop-Loss Notes
Aggressive Short ~$110,800 ~$107,500 ~$111,800 Only on strong rejection pattern
Conservative Long ~$107,000 Retest $110,000+ Below $105,500 Only if curve support holds clean
Breakout Buy Above $111,800 Open upside Below $110,000 Wait for breakout + retest
🧠 MMC Observations
Price Engineering: The market moved through clean zones quickly—classic MMC manipulation to clear liquidity.
Trap Zones: The resistance zone may act as a bull trap where late retail buyers are absorbed.
Smart Money Flow: Institutional traders may now shift to distribution mode unless curve support holds firmly.
💬 Final Thoughts
Bitcoin is at a key decision point. Traders should remain flexible but vigilant. The presence of curve support combined with aggressive upward momentum suggests bullish strength, but the resistance zone and prior liquidity behavior warn of potential trap activity.
Monitor the reaction closely in the next 1–2 candles. A failed breakout could trigger a swift 2–3K retracement.
📌 Tip: Combine this analysis with on-chain volume or open interest data for better conviction.

Gold (XAUUSD) Technical Analysis : MMC Setup Confirmed + Target📊 1. Market Structure Overview
After a strong rally earlier this month, XAUUSD entered a corrective phase and formed a descending trendline which acted as resistance for multiple days. This trendline has just been tested and broken, suggesting that the correction may be coming to an end.
At the same time, price is showing signs of strength by bouncing off the lower boundary of a long-standing parallel ascending channel—a structure that has acted as dynamic support over the past two weeks.
🧱 2. Key Technical Elements
🟦 Support/Resistance Interchange Zone (S/R Flip)
Price recently interacted with a horizontal S/R interchange zone around the $3,310–$3,330 area.
This zone served as resistance during the earlier part of the trend and is now acting as support after the breakout.
It also overlaps with the mid-section of the ascending channel, adding confluence to this support area.
📐 Descending Trendline Break
The break above the descending trendline signals a potential shift in momentum.
Traders often view this kind of breakout as an early indicator of bullish continuation, especially when combined with volume or retests.
🟩 Next Reversal/Target Zone
A green box is highlighted around the $3,345–$3,355 zone, which could act as the next resistance or reversal level.
This is based on prior market structure and Fibonacci extension zones.
This area may offer a take-profit level for longs or a short-term reversal zone for countertrend traders.
🔍 3. What to Watch
✅ Bullish Scenario
If the price sustains above $3,310 and holds above the broken trendline, we could see a push toward the $3,345–$3,355 area.
Ideal long entries may occur on a retest of the trendline or the S/R flip zone, confirming it as support.
❌ Bearish Scenario
Failure to hold above the $3,300–$3,310 support region would invalidate the breakout.
A clean break below this zone could result in a drop back to the lower parallel channel boundary near $3,270 or even lower.
⚙️ 4. Trading Plan & Bias
Short-term Bias: Bullish (Trendline break + support hold)
Mid-term Bias: Cautiously Bullish (until major resistance is tested)
Risk Management: Stop-loss for long entries should be placed below $3,300 with targets near $3,345 and $3,355.
💬 Conclusion
This setup presents a classic case of trendline breakout + S/R flip confluence, which often leads to favorable risk/reward opportunities. Gold traders should monitor the retest behavior around current levels closely, as it will likely determine the next directional move.
📌 Always wait for confirmation, manage risk, and don’t chase moves—especially near major zones.

2025-06-09 - priceactiontds - daily update - daxGood Evening and I hope you are well.
comment: Wedge bull flag, I expect 24000 and 24500 to get hit this week, everything above and below those prices would be a surprise to me. We are also forming a triangle with the bull trend line and I expect bulls to get the breakout above.
current market cycle: broad bull channel
key levels: 23700 - 24500
bull case: Bulls making sure the correction is sideways and shallow. They likely want to buy closer to the trend line around 24000 for more value. They want another retest of 24500 and another higher high. Since the trend line is valid and we are comfortably above the daily 20ema, they remain in full control.
Invalidation is below 23700.
bear case: Bears printed a lower low for the past 4 trading days but does the 1h chart look bearish to you? The move down to 24112 has mostly overlapping bars and bulls even printed 5 consecutive 1h bull bars. Those things do not happen in strong bear trends. I expect bears to give up tomorrow. 1h close below 23800 would certainly change everything. This would open the possibility to test down to 23746 and the bigger trend line.
Invalidation is above 24550.
short term: Neutral but expecting bulls to come around strongly closer to 24000 for a re-test of 24500. Only below 23800 I would become bearish and even if we get there, I doubt we would go further down.
medium-long term from 2025-05-25: My rough guess from early May was down over the summer and up into year end. POTUS certainly helped with the 50% tariffs. I need to see market reaction next week and if there is no 180° reversal until Friday, they will become reality the week after and dax should do 20-30% down over the next months. Markets were not positioned for any risk what so ever. Now we got the atomic trade bomb.
trade of the day: Selling 24200 was good for many scalps today but I think the most obvious trade was the long on the EU open sell spike from 24168 up to open price 24272.

BIG 441% Monday from $0.60 to $3.25 $OMH🔥 BIG 441% Monday from $0.60 to $3.25
Easiest money made today was on NASDAQ:OMH buy before halt, then once it came out of halt it was just gapped up into 💸💸💸

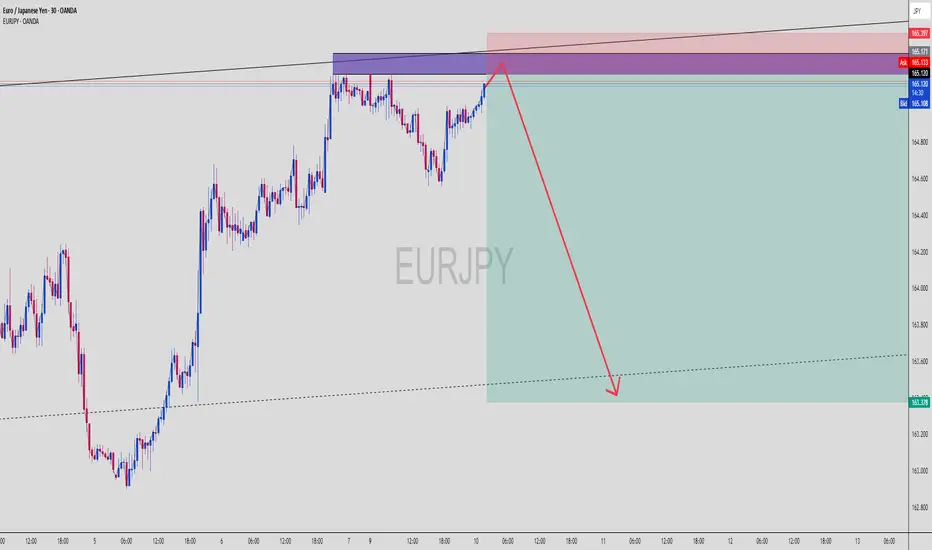
EURJPY Supply Tap! Bearish Reaction Coming?EURJPY (30-Min) | Supply Zone Hit + Bearish Reversal Setup
This EURJPY move is brewing into a classic SMC bearish play — engineered liquidity run, supply zone reaction, and a projected melt to imbalance below. Let’s dissect the ninja logic 🧠📉
🔍 Breakdown of the Setup:
🟥 Supply / Order Block Zone
Price enters a strong bearish OB zone between 165.100–165.397
Previous rejection wicks in this zone = smart money sell interest
Price now testing that area again — potential for liquidity sweep + reversal
🟪 Multi-Zone Confluence
Multiple overlapping zones stacked: OB, mitigation block, and liquidity sweep area
Perfect spot for Smart Money to unload positions before sending price lower
📏 Risk-Reward Optimization
Entry near 165.100–165.397 zone
Stop Loss placed slightly above the last rejection wick (above 165.397)
Take Profit projected around 163.378 based on measured impulse leg and imbalance fill
🧠 Liquidity Narrative
The rally into supply is likely a buy-side liquidity hunt
Smart Money often drives price into key zones before triggering reversals
Price may wick above 165.171 to fake bulls before a strong sell-off
🧠 Chart Ninja Entry Plan:
🔻 Entry Zone 165.100 – 165.397 (Supply OB)
🛡 SL Above 165.450 (above wick / last structure high)
🎯 TP Target 163.378 (imbalanced fill target)
⚖️ RRR Approx. 1:4+ depending on entry precision
🥷 Chart Ninja Note:
“The trap is always set where the crowd feels the safest —
and that’s exactly where the ninja strikes.” 🥷📉
This setup could be a clean ride down if price reacts as expected. Confirmation entry = bearish engulfing on M15 or M30.
🔁 Bonus Observation:
You can see lower timeframes building internal liquidity, meaning we might get a sharp, volatile drop once that top wick finishes sweeping.
📍Mark this zone and set an alert — entry can trigger fast!
🔥 What’s your confirmation style — engulfing candle or breaker structure?
NZDJPY - One More Bullish Leg!Hello TradingView Family / Fellow Traders. This is Richard, also known as theSignalyst.
📈NZDJPY has been overall bullish trading within the rising wedge marked in blue.
Moreover, the green zone is a strong support!
🏹 Thus, the highlighted blue circle is a strong area to look for buy setups as it is the intersection of support and lower blue trendline acting as a non-horizontal support.
📚 As per my trading style:
As #NZDJPY approaches the blue circle zone, I will be looking for bullish reversal setups (like a double bottom pattern, trendline break , and so on...)
📚 Always follow your trading plan regarding entry, risk management, and trade management.
Good luck!
All Strategies Are Good; If Managed Properly!
~Rich
Disclosure: I am part of Trade Nation's Influencer program and receive a monthly fee for using their TradingView charts in my analysis.

BTCUSD VIP Analysis – Clean Breakout Toward 109K + Target🧠 Full Technical Breakdown for TradingView & Minds
🗓 Date: June 9, 2025 | Asset: Bitcoin (BTC/USD) | Chart: 2H Timeframe
Bitcoin is currently staging a strong breakout rally after consolidating within a bullish structure. This move appears to be fueled by smart money accumulation and could lead us directly into a high-probability reversal zone just below 109K.
Let’s dive into the full structure and what traders should look out for next.
🔍 1. Previous Market Behavior (Left Side of Chart):
Before the breakout, BTC had been trading inside a bearish channel, experiencing sharp rejections and forming lower highs. This downtrend climaxed at the Previous Reversal Zone, where strong buyer interest kicked in — this is a textbook example of a liquidity grab followed by buyer absorption.
📈 2. The Reversal & Blue Ray:
From the Previous Reversal Zone, BTC formed a solid impulsive move upward — this is where the Blue Ray trendline was drawn. This level acted as the initial support for the new bullish structure.
The move from this point formed a new trend, indicating that buyers had successfully reclaimed short-term control of the market.
🟩 3. Central Zone – Bullish Reaccumulation Area:
As BTC progressed, it entered a green bullish channel, which we’ve labeled the Central Zone. This zone shows consolidation within a rising wedge, typically a continuation pattern if volume remains steady.
Notice how price respected both boundaries of the channel multiple times before exploding upwards. This is a sign of smart money reaccumulation, where institutions are quietly preparing for the next leg.
🚀 4. Breakout to the Upside:
BTC has now broken out cleanly from the Central Zone with an aggressive bullish candle, pushing price above 106,000. This breakout suggests a mid-move continuation, and current price action is heading straight for the Next Reversal Zone between 108,800–109,200.
Also note the clean cross above the 50% Fibonacci zone, which further supports the bullish thesis.
🔹 5. Next Reversal Zone (Target Area):
This is the most critical zone on the chart. Price may:
Reject sharply from this area (short opportunity),
Consolidate before continuation,
Or sweep liquidity above it and reverse hard.
This zone could act as a smart money sell zone, where large players unload positions, especially if retail traders jump in late.
🧮 6. Possible Scenarios Ahead:
Scenario A – Bullish Continuation:
Price breaks 109K cleanly with volume.
Next target: 111K–112K (extension level).
Scenario B – Rejection from Reversal Zone:
Price stalls near 109K.
Bearish engulfing candle forms.
Short opportunity back toward 106K–104K.
Scenario C – Fakeout Above 109K:
Price sweeps highs (liquidity trap).
Fast reversal back into Central Zone.
🎯 Trade Setups:
🚨 Breakout Buy (Already Triggered):
Entry: 105,500–106,000
Target 1: 107,500
Target 2: 108,800
SL: 104,800
🛑 Reversal Short (Pending):
Entry: 108,900–109,100 (with confirmation)
Target: 106,000
SL: 109,600
⚠️ Fundamental Awareness:
Multiple U.S. economic events this week (see calendar icons below the chart).
Increased volatility expected — use smaller positions or wider stops near data release times.
📌 Final Thoughts:
This is a classic example of smart money behavior — liquidity grab, controlled reaccumulation, then a breakout toward a magnet zone (reversal supply). If you're already in the move, manage your positions. If not, wait for price action confirmation near the key zone.

XAUUSD Analysis – From Bullish Momentum to Target🔍 Overview:
Gold has officially broken its ascending trendline, signaling a shift in market structure from bullish to bearish. This trendline acted as dynamic support for days, but its breakdown has opened the doors to potential downside movement. We're now in a phase where lower highs and lower lows are forming — a classic bearish signal.
📌 Key Levels & Price Zones:
🔻 Trendline Breakdown
A strong upward trendline was broken, confirming that bullish momentum has weakened. The trendline break was followed by aggressive bearish candles, signaling that sellers are gaining strength.
🔄 SR Interchange Zone (~3,322 – 3,330)
This area once acted as strong support and has now flipped to resistance. It’s a key level to watch for rejections or false breakouts. As long as the price stays below it, the bias remains bearish.
🔽 Mini Support Zone (~3,345 – 3,350)
A weak support area that could be retested. If price fails to hold above it, sellers will likely take over again.
⚠️ Minor CHoCH (~3,290)
This level marks the short-term structure shift. A breakdown here will confirm continuation to the downside. A short opportunity might present itself below this zone.
🌀 Next Reversal Zone (~3,275 – 3,280)
A potential demand area. Watch how the price reacts — this is where bulls might step in temporarily for a bounce or consolidation.
🚨 Major CHoCH (~3,265)
This is a critical support level. If it breaks, the entire bullish structure from early June is invalidated, opening the door to deeper retracement.
📈 Forecast Path:
Based on the price projection:
Expect lower highs to form.
If bearish momentum continues, we could see a breakdown below Minor CHoCH, targeting the Next Reversal Zone.
A clean break below 3,265 would signal a major trend change, confirming bearish control.
📊 Trade Ideas:
🔻 Short-Term Bearish Scenario:
Look for price to reject the SR Interchange or Mini Support zones.
Entry: After confirmation below 3,330
Targets: 3,290 → 3,275 → 3,265
SL: Above 3,350
🔼 Bullish Bounce Scenario:
If price reaches 3,275 and forms bullish confirmation (engulfing candle, divergence), we might see a short-term reversal.
Entry: On bullish candle close from support zone
Target: Back to 3,322 or higher
📅 Upcoming Events to Watch:
There are several U.S. economic data releases coming this week (marked on the chart). These can create sharp moves in XAUUSD, so manage your risk wisely.
✅ Final Thoughts:
Gold is at a key turning point. The breakdown from the trendline is significant, and structure now favors sellers — unless bulls reclaim critical levels. Wait for confirmation before entering, and always trade with proper risk management.
📌 Follow for more clean chart breakdowns, updates, and trade setups!

NZDJPY: Move Up Ahead! 🇳🇿🇯🇵
There is a high chance that NZDJPY will continue rising.
I see a strong intraday bullish confirmation after a confirmed
breakout of a key daily horizontal resistance.
Next key resistance is 0.875
❤️Please, support my work with like, thank you!❤️
I am part of Trade Nation's Influencer program and receive a monthly fee for using their TradingView charts in my analysis.

USDCAD Short Opportunity Description :
USDCAD is setting up for a potential short — I’m watching closely for an upthrust into the highlighted zone to initiate the position. Here’s my current read:
🔍 Technical Breakdown:
1. Trendline Break
Previous bullish trendline broken with conviction. Market structure now vulnerable to bearish continuation.
2. Volume Spike with Selling Pressure
Notable increase in volume on bearish candles — suggests smart money exiting or early sellers stepping in.
3. Anticipating an Upthrust
Watching for price to sweep the highs around 1.3695–1.3700, fail to sustain, and drop back inside range.
This would provide a low-risk entry with tight stops above the highs and 5r+ down to 1.3652, possibly even lower.
📌 Trade Plan:
Entry Zone: 1.3695–1.3700 (after upthrust confirmation)
Stop: Above 1.3710
TP1: 1.3652 (structure low)
TP2: 1.3600 (extended target if momentum builds)
---
🧠 Why This Setup?
This aligns with key principles I trade:
Trendline breaks often lead to retests followed by continuation.
Rising volume on the break is confirmation, not noise.
A failed breakout (upthrust) into previous supply zones is often the "last push" before price collapses.
Let me know if you're seeing something different. This is how I’m planning to attack the chart today.

GU-Mon-9/06/25 TDA-GU back in the range after NFPAnalysis done directly on the chart
Follow for more, possible live trades update!
When sometimes you don't take trades, you
can always take notes and learn more than
you already know about market movement,
price fluctuations, developing better pattern
recognition.
Active in London session!
Not financial advice, DYOR.
Market Flow Strategy
Mister Y

GJ-Mon-9/06/25 TDA-Daily resistance tapped 196.096Analysis done directly on the chart
Follow for more, possible live trades update!
Price tapped daily resistance 196.096 and
currently rejecting ahead of this week multiple
red news folders (UK claimant count change,
USD CPI, PPI).
Active in London session!
Not financial advice, DYOR.
Market Flow Strategy
Mister Y

09.06.25 Morning ForecastPairs on Watch -
FX:USDJPY
FX:AUDNZD
FX:AUDJPY
FX:CHFJPY
A short overview of the instruments I am looking at for today, multi-timeframe analysis down to what I will be looking at for an entry. Enjoy!

BTCUSD : SELL IN 4HR CHARTBTCUSD SELL @ 106000 or below
Target : 100000
Stoploss : 107500
BTCUSD formed a perfect sell trend in 4hr chart. I am short on BTCUSD

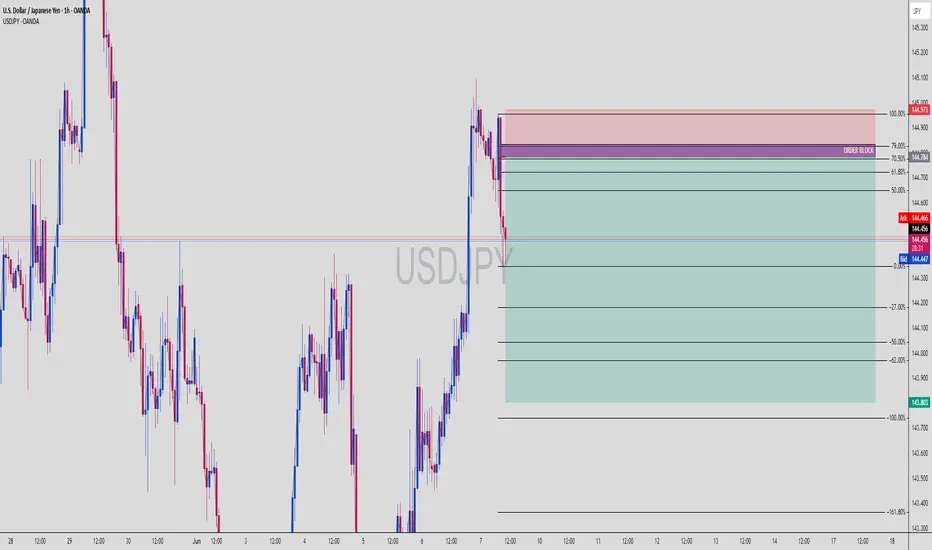
USDJPY Short Setup: OB Rejection + Fib Premium Sell-Off IncomingUSDJPY (1H Chart) | Institutional Short Setup with OB + Fib Confluence
The market is showing clear Smart Money Distribution behavior — with a rejection from a high-confluence zone combining Order Block, Premium Fib Levels, and bearish momentum shift.
🔍 Smart Money Setup Breakdown:
🔻 Bearish Order Block Zone (OB)
Price wicked into OB zone and got instantly rejected
OB located precisely at the 70.5% – 79% premium range
Mark of institutional sell-side interest
📐 Fibonacci Retracement + Premium Zone
Retracement from swing high (144.973) to swing low (144.436)
Premium zone between 61.8% to 79% aligns with OB (144.700–144.973)
Entry taken from this zone for high-probability sell setup
📉 Bearish Confirmation
Aggressive bearish reaction post-OB tap
Market structure flipping bearish
Momentum candle breaks previous bullish leg
🔻 Target Zones (Measured Fib Extensions)
-27%: 144.200
-62%: 144.000
-100%: 143.803
-161.8%: 143.300 (extended liquidity draw)
🧠 Chart Ninja Entry Plan:
🔹 Entry Zone 144.784 – 144.973 (OB + Premium Fib + FVG rejection)
🔻 SL Above 145.000 (above OB wick)
📉 TP 1 144.200 (first fib extension)
📉 TP 2 143.803 (full -100% extension)
⚖️ RRR Approx. 1:4+ — stealthy sniper precision
💬 Pro Tip from the Ninja Dojo:
The market doesn’t move because of indicators — it moves because of liquidity.
Find the OB. Wait for the imbalance. Strike where Smart Money hides. 🥷📊
This isn’t retail — this is calculated execution.
🎯 Save this chart before price melts to 143.8
💬 Drop your entry zone & SL idea in comments
USDCAD weekly overviewHello Traders,
War in Persian Gulf could change the direction of this analysis. Any conflict in the Middle ease could make out two white zones be red and suitable for shot trades. in normal situation, only 1.37732 is prepared for long trades.
***********************************************************
The indicated levels are determined based on the most reaction points and the assumption of approximately equal distance between the zones.
Some of these points can also be confirmed by the mathematical intervals of Murray.
You can enter with/without confirmation. IF you want to take confirmation you can use LTF analysis, Spike move confirmation, Trend Strength confirmation and ETC.
SL could be placed below the zone or regarding the LTF swings.
TP is the next zone or the nearest moving S&R, which are median and borders of the drawn channels.
*******************************************************************
Role of different zones:
GREEN: Just long trades allowed on them.
RED: Just Short trades allowed on them.
BLUE: both long and short trades allowed on them.
WHITE: No trades allowed on them! just use them as TP points
