BTC - New Impulse Soon!Hello TradingView Family / Fellow Traders. This is Richard, also known as theSignalyst.
📈 BTC has been bullish, trading within the rising channel marked in orange. 🟧
In a typical trend, corrections are usually bearish. 🔻
However, in BTC’s case, the correction phases marked in red are flat — a strong signal that the bulls are in control 💪 and not allowing the bears to trigger a classic pullback.
As long as BTC holds within the rising orange channel, we expect the next impulse phase to kick off soon 🚀 — aiming for the $115,000 round number. 🎯
This move will be confirmed once BTC breaks above the current flat correction zone marked in red. ✅
📚 Always follow your trading plan regarding entry, risk management, and trade management.
Good luck!
All Strategies Are Good; If Managed Properly!
~Rich
Priceaction

WLD - AI Cycle Is Back!Hello TradingView Family / Fellow Traders. This is Richard, also known as theSignalyst.
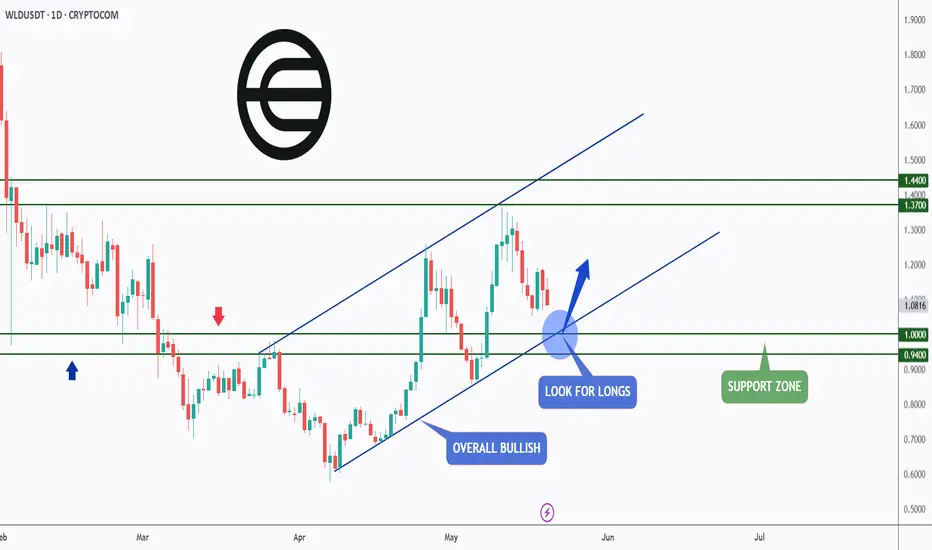
📈WLD has been in a correction phase. However it is still overall bullish long-term trading within the rising channel marked in blue.
Moreover, the green zone is a strong support and round number $1.
🏹 Thus, the highlighted blue circle is a strong area to look for buy setups as it is the intersection of support and lower blue trendline acting non-horizontal support.
📚 As per my trading style:
As #WLD retests the blue circle zone, I will be looking for bullish reversal setups (like a double bottom pattern, trendline break , and so on...)
📚 Always follow your trading plan regarding entry, risk management, and trade management.
Good luck!
All Strategies Are Good; If Managed Properly!
~Rich
Rising Wedge Breakdown – Bearish Setup on Silver (XAGUSD)Silver (XAG/USD) is currently trading within a bearish rising wedge formation on the 8-hour timeframe, and the market structure is hinting at a potential reversal to the downside. The confluence of resistance zones, pattern anatomy, and historical price action all point to a high-probability short setup, especially if key support levels are breached.
📈 Pattern Analysis: Rising Wedge
A rising wedge is typically a bearish chart pattern that forms when price consolidates between two upward sloping trendlines. However, the upper trendline rises at a slower pace than the lower one—indicating decelerating bullish strength. It often precedes a bearish breakout, especially if volume decreases near the apex.
In this case, the wedge is forming just below a major resistance zone around the $34.00 area, adding weight to the bearish scenario.
🔹 Key Technical Levels :
🟥 Resistance Zone ($33.80–$34.80): Price has tested and rejected this area multiple times in recent weeks. It marks a clear liquidity zone where sellers are in control.
🟩 Support Zone ($29.50–$30.30): This zone has provided strong support in previous retracements. If broken, it may flip into resistance upon retest.
🟦 Retest Zone (~$31.00–$31.50): If the wedge breaks downward, price may retest this area—creating an opportunity for traders to enter short with better risk-reward.
🎯 Final Bearish Target : $26.85: This level is derived from the height of the wedge and prior demand zones, making it a strong target area in a fully played-out bearish move.
🧠 Market Structure & Sentiment:
Volume Analysis – Volume has been tapering off as the price squeezes within the wedge, which is a typical trait of rising wedges. A volume spike on breakdown would serve as confirmation.
Trend Analysis – While the overall trend in the medium term has been bullish, the weakening upward momentum suggests that buyers are losing strength, and sellers may regain control soon.
Rejection Candle s – Several recent candle wicks above the $33.50 zone show clear rejection and failure to close above, reinforcing the resistance level.
📊 Trade Plan (Educational Purposes Only):
Criteria Details
Bias Bearish (Rising Wedge Breakdown)
Entry Option 1 On breakdown of wedge + retest
Entry Option 2 Aggressive entry on breakdown candle close below $31.50
Stop Loss Above $33.80 (last resistance)
Take Profit 1 $30.00 (support zone)
Take Profit 2 $28.00 (partial exit)
Take Profit 3 $26.85 (final target)
📌 Trading Psychology Note:
Traders should remain patient and avoid entering prematurely. Let the pattern confirm itself with a clean break and retest. Risk management is critical—wedge patterns can also fake out before reversing hard.
🧾 Summary:
Silver is nearing the end of a rising wedge pattern, right under a heavy resistance zone. Historical behavior, weakening momentum, and classic wedge structure suggest a potential bearish reversal. A break below the wedge support and a retest around $31.00 could present a high-probability short trade setup targeting the $26.85 area.
Keep this chart on watch. A decisive move is likely coming soon.

Will Gold Finally Reverse?After a strong and extended uptrend, gold is now ranging. On the 4H timeframe, a clear CHoCH broke structure, hinting at early weakness.
The inducement above price acts like a magnet. If swept, it could trigger a reaction from the 4H supply zone. That area marks a potential turning point for a deeper shift.
If this rejection holds, we may be witnessing the first signs of a high-timeframe reversal.

BTC/USD: Structural Breakout of Curved Resistance – Eyes on $116Technical Overview:
Bitcoin (BTC) has successfully completed a significant technical breakout after months of accumulation and resistance interaction. The chart highlights a precise market structure where price has moved from a phase of consolidation into a confirmed bullish breakout, with a clearly defined target and invalidation level.
1. SR Interchange Zone (Support-turned-Resistance):
From May to October 2024, BTC price action was trapped in a sideways range, marked by an extended accumulation phase between approximately $60,000 to $73,000. This zone acted as a historical resistance level during the downtrend, but was later flipped into support, forming a classic SR Interchange — a foundational concept in market structure analysis.
This area provided a strong base from which BTC launched its late 2024 rally.
2. Consolidation Below Curved Resistance (Dec 2024 – Apr 2025):
Following a steep bullish impulse, BTC entered a multi-month consolidation phase, forming a rounded top pattern — shown on the chart as the Black Mind Curve Resistance. This curved resistance represented a psychological and structural ceiling, suppressing bullish momentum and trapping liquidity.
Price action was tightly compressed under this dynamic resistance curve, with multiple failed breakout attempts. This period was marked by range-bound volatility and low directional commitment — classic behavior during a re-accumulation phase.
3. Breakout of Black Mind Curve Resistance (May 2025):
A major technical event occurred as BTC broke decisively above the Black Mind Curve Resistance, accompanied by a surge in bullish momentum. This move not only invalidated the prior rounding top structure but also confirmed a trend continuation breakout.
The breakout was clean, with strong follow-through volume and a higher high structure above the Major Horizontal Resistance Zone (~$105,000–$109,000) — now confirmed as flipped support.
4. Bullish Continuation & Price Target:
Following the breakout, BTC has established a higher low and continued its upward trajectory toward the marked target zone at $116,065. This zone coincides with:
Previous untested supply levels
Technical Fibonacci extension (1.272–1.618 zone)
Measured move from the curve structure base
With current momentum and structure intact, BTC remains bullishly biased until it either reaches the target zone or breaks below the invalidation level.
5. Invalidation & Risk Management:
A close below $102,005 — the defined SI (Support-Invalidation) level — would be considered structurally bearish. This level represents:
The most recent higher low
Base of the breakout structure
Re-entry into previous consolidation range
A breakdown below this level would invalidate the bullish thesis and may open the door for a deeper pullback toward $95,000 or even $88,000.
✅ Conclusion:
The breakout of the Black Mind Curve Resistance marks a significant technical shift in Bitcoin’s trend. With momentum in favor of the bulls and market structure supporting higher prices, BTC appears poised to test the $116,000 target zone in the short to mid-term — barring a breakdown below key support.
📌 Key Levels Recap:
Level Type Price
Target Zone $116,065
Current Price $110,902
Support / Invalidation (SI) $102,005
📈 Strategy Outlook:
Bias: Bullish
Entry Area: Retest of $107,000–$109,000 (if offered)
Target: $116,065
Stop-Loss: Below $102,005 (structural invalidation)
💬 Stay focused on structure, not emotions. The best trades are born from patience, not prediction.
Let me know if you'd like a summary version for use on social media or a custom signature block for your TradingView profile.

XAUUSD – Rising Wedge Breakdown in Play? | Bearish Setup Alert🧠 Market Analysis
Gold (XAUUSD) has shown incredible bullish strength in recent months, driven by geopolitical tensions, inflation uncertainty, and increased demand for safe-haven assets. However, every trend experiences a pause or correction — and that’s where we may currently be.
📊 Pattern Overview: Rising Wedge Formation
One of the most prominent technical patterns right now is the Rising Wedge. This is a bearish reversal pattern that occurs when price action consolidates upwards in a narrowing range, indicating waning bullish momentum and an imminent breakdown.
In this chart:
We see a clear series of higher highs and higher lows, forming two converging trendlines.
The upper trendline acts as dynamic resistance, while the lower one has been supporting price until now.
The wedge has now broken to the downside, signaling the potential start of a new short-term downtrend.
🔍 Key Technical Elements Explained:
🔵 1. Major Resistance Zone
Marked in the blue rectangular box, this zone has acted as a historical pivot area — both as support and resistance in the past.
The market respected this zone multiple times.
Price action tends to hesitate or reverse in such regions due to large institutional order flows.
🧠 2. Black Mind Curve Resistance
Unlike flat trendlines, the "Black Mind Curve" represents a curved, psychological dynamic resistance — often based on market sentiment, Fibonacci arcs, or logarithmic regression.
It reflects the market’s natural rhythm and is respected due to the hidden behavior of algorithmic trading systems.
Price just rejected this resistance after touching it during the wedge formation — a strong bearish clue.
🔄 3. Retest in Progress
After breaking out of the rising wedge to the downside, price is now retesting the broken wedge support.
This is a common price behavior known as the “kiss of death” — a final tap before continuation.
If the price fails to reclaim this broken support zone, it confirms a bearish continuation is on the table.
🎯 Trade Plan: Entry, Target & Stop
Trade Element Details
Bias Bearish
Entry Idea On confirmation of retest rejection (e.g., bearish engulfing candle)
Stop Loss (SL) Above the recent high or resistance – near $3,413.58
Take Profit (TP) First major support near $3,153.70 (SR Interchange)
Risk-Reward Ratio Estimated between 1:2 to 1:3, depending on entry
🔥 Bonus Target: If momentum increases, an extended drop toward $3,100–$3,080 is possible — where deeper demand lies.
🧘♂️ Trading Psychology & Risk Management:
Let’s face it: Even the best setup can fail — which is why discipline is your edge.
Confirmation is Key: Never short just because of a pattern. Wait for structure + candlestick confirmation (e.g., bearish engulfing, shooting star, etc.).
Emotions Kill Accounts : Don’t let greed convince you to skip stop-losses or over-leverage.
Let Price Come to You: If you missed the perfect entry, don’t chase. The market always gives second chances.
🧠 Educational Insight : What Makes This Setup Powerful?
This setup is a confluence trade, meaning:
You’re not relying on one signal, but multiple confirmations:
Rising wedge (pattern-based)
Resistance zone (horizontal S&D)
Curved dynamic resistance (psychological + advanced trendline)
Retest + rejection behavior (price action)
These stacked layers of confirmation increase the probability of a successful trade.
📌 Final Thoughts:
Gold is showing all the technical signs of a short-term bearish correction, despite the broader bullish narrative. For smart traders, this is an opportunity to catch a swing short with a clear entry, stop, and target.
The key to winning here? Patience and confirmation.
You don’t have to predict the market — just react to it with logic and discipline. Let the setup unfold naturally, and let the trade come to you.
💬 What’s Your Take?
Are you shorting Gold here or waiting for more confirmation?
Have you used curved resistance lines before in your analysis?
Drop your thoughts below — and if this helped you, smash the like button, share with others, and follow me for more high-probability setups!

22.05.25 Morning ForecastPairs on Watch -
FX:EURUSD
FX:EURGBP
FX:GBPJPY
A short overview of the instruments I am looking at for today, multi-timeframe analysis down to what I will be looking at for an entry. Enjoy!

GU-Thu-22/05/25 TDA-Strong resistance DR 1.34325!Analysis done directly on the chart
Follow for more, possible live update!
The daily resistance 1.34325 has been tested as
a strong resistance, price could possibly start to
fail and create a possibility for reversal setups.
On the other hand, with more bullish structure and
bullish closures we'll likely to continue higher towards
1.35000 and more.
Not financial advice, DYOR.
Market Flow Strategy
Mister Y

GJ-Thu-22/05/25 TDA-Multiple 4hS tapped, PMI news incoming!Analysis done directly on the chart
Follow for more, possible live updates!
Multiple 4hS tapped, PMI news incoming,
the PMI releases will determine how price
will move today.
Not financial advice, DYOR.
Market Flow Strategy
Mister Y

USDJPY Long Setup: Triple Confluence Zone Locked InSmart money traders love one thing more than anything — confluence. This BTCUSD setup hits all the marks:
📈 Structure Breakdown:
Market breaks structure to the upside ✅
Impulsive bullish leg breaks prior high ✅
Pullback into 61.8% golden zone + OB ✅
Rejection wick = perfect entry confirmation ✅
This is a high-probability continuation setup after BTC made a clear bullish BOS (Break of Structure) on the M30 timeframe.
🟦 Order Block Zone:
OB Range:
Top: ~106,989
Bottom: ~106,759
This OB was the last down candle before the big bullish impulse that broke structure. Price returned to mitigate here, then instantly rejected = Smart Money entry confirmed 🔒
🧮 Fibonacci Levels:
61.8%: Sliced right into it
70.5% – 79%: Deeper liquidity zone just below
The entry wick taps right into the sweet OB/Fib confluence zone and launches 🚀. It’s giving sniper precision with a low drawdown entry.
🎯 Trade Parameters:
Entry: ~106,759
SL: Below the OB zone
TP: 108,022 (previous high)
That’s an RRR of around 3.5–4.0x — a clean asymmetric play, just the way smart money wants it.
🔍 Confirmation Factors:
Bullish BOS on M30
Price returns to OB zone + golden ratio
Clean rejection candle with demand absorption
No internal structure break = bullish narrative still valid
🧠 Key Lesson:
“When OB meets Fibonacci, don’t ask why. Load up — the market just told you why.”
Let setups like this come to you. No chasing, no emotions. Let the algo-driven footprints guide you to the money.
📈 Missed this one? Save it for your playbook — this is how high-probability trades are built.
Drop a 💰 if you caught the same move!

Caught the pivots up, now what?If you find this information inspiring/helpful, please consider a boost and follow! Any questions or comments, please leave a comment!
After catching the directional turn and key pivot level ahead of the recent move, Ethereum delivered the reaction we were anticipating. But what comes next?
The current W2 corrective structure isn’t textbook, so what do we do?
At this stage, we’re anchoring our analysis off the Wave 3 price action, which likely completed before the latest correction. That sets us up to track a potential Wave 4 development.
Here’s what’s still on the table:
We have a sideways style W2
For a wave 4, based off of alternation, we should be looking for a:
A sharp zigzag
Or a contracting triangle coiling up for the next breakout
Key Level to Watch:
👉 A clean break below 2159 would invalidate the more bullish interpretations and open the door to deeper corrective action. ⚠️
Until then, staying patient and letting the structure develop will be key.
Trade safe, trade smart, trade clarity.

2025-05-21 - priceactiontds - daily update - daxGood Evening and I hope you are well.
comment: Quick stuff. Daily new ath means bulls are doing more than bears so don’t look for shorts. Today’s selling was a start but we need a clean lower high before one can look for decent short setups. I think anything above 24300 would make me physically sick.
current market cycle: broad bull channel
key levels: 23000 - 24300
bull case: Sideways above 24000 is peak bullishness and as long as we stay above 23750, bulls are fine. Below we test down to the bull trend line which is not far below that and only below 23400 things are getting more spicy for bulls.
Invalidation is below 23300.
bear case: I will spend more time in this section once we have a daily close below 23400. Before that, it’s most likely a pullback that bulls will buy. Odds are heavily against bears so don’t make your life tough. Long term shorts if you can hold through 24500 or higher are fine. Next 10-20% will be made to the downside, zero doubt about it. Only matter is timing.
Invalidation is above 24300.
short term: Neutral. Pullbacks will likely be good long opportunities until we see bigger selling pressure. Bulls in full control but I will not buy the highs. Nothing changed.
medium-long term from 2025-05-11: So here is my very rough guess about the next months. This short squeeze is clearly overdone and global macro stuff has most likely already deteriorated a great deal. Down to 20000 over the next weeks and form a big trading range. Up through October-Year end. Zero thought about a new bull trend above 24000 or that we have seen the lows for either 2025 or 2026. Good question is always, “How would you allocate 100k right now?”. 50% short dax, 25% of it levered/options and with the rest I would scalp.
trade of the day: Buying the bear trap below yesterday’s low was amazing and so was short 24200. Both buying and selling pressure were so great that market did not run stops above or below the extremes.

Gold - This is still clearly not over!Gold - TVC:GOLD - just needs a moment to breathe:
(click chart above to see the in depth analysis👆🏻)
It is just incredible how Gold has been rallying lately. Just over the past 1.5 years, Gold is up another +80% and is creating new all time highs every month. Since these strong rallies continue a lot longer than most people think, Gold still has significant upside potential.
Levels to watch: $3.500, $4.000
Keep your long term vision!
Philip (BasicTrading)

At ATH, blast continuation or tap and turn?If you find this information inspiring/helpful, please consider a boost and follow! Any questions or comments, please leave a comment!
🚀 Tap & Turn… or Blast?
Bitcoin is reacting well to mapped levels, maintaining structure and respecting key zones. Price action continues to print HLs and HH keeping the bulls confident, atm.
💥 Levels Still Respecting
Recent price action has shown solid reactions at prior resistance and support zones. Nothing overly aggressive, but clean enough to keep structure traders engaged.
🐂 Bulls Still in Control (for Now)
Higher lows remain intact, keeping the bullish structure alive. I did take a lower-degree short, but without a clean break of those HLs, there's no reason to call a shift yet. A break of that pattern would be the first real sign of momentum fading.
🚧 Key Watch Zone: 106K–104K
This is where things get more critical. A clean break below that zone could tilt the balance.
Trade safe, trade smart, trade clarity.

BTCUSD: 61.8% Fib + OB = Precision Long PlaySmart money traders love one thing more than anything — confluence. This BTCUSD setup hits all the marks:
📈 Structure Breakdown:
Market breaks structure to the upside ✅
Impulsive bullish leg breaks prior high ✅
Pullback into 61.8% golden zone + OB ✅
Rejection wick = perfect entry confirmation ✅
This is a high-probability continuation setup after BTC made a clear bullish BOS (Break of Structure) on the M30 timeframe.
🟦 Order Block Zone:
OB Range:
Top: ~106,989
Bottom: ~106,759
This OB was the last down candle before the big bullish impulse that broke structure. Price returned to mitigate here, then instantly rejected = Smart Money entry confirmed 🔒
🧮 Fibonacci Levels:
61.8%: Sliced right into it
70.5% – 79%: Deeper liquidity zone just below
The entry wick taps right into the sweet OB/Fib confluence zone and launches 🚀. It’s giving sniper precision with a low drawdown entry.
🎯 Trade Parameters:
Entry: ~106,759
SL: Below the OB zone
TP: 108,022 (previous high)
That’s an RRR of around 3.5–4.0x — a clean asymmetric play, just the way smart money wants it.
🔍 Confirmation Factors:
Bullish BOS on M30
Price returns to OB zone + golden ratio
Clean rejection candle with demand absorption
No internal structure break = bullish narrative still valid
🧠 Key Lesson:
“When OB meets Fibonacci, don’t ask why. Load up — the market just told you why.”
Let setups like this come to you. No chasing, no emotions. Let the algo-driven footprints guide you to the money.
📈 Missed this one? Save it for your playbook — this is how high-probability trades are built.
Drop a 💰 if you caught the same move!

JPYUSD | Head & Shoulders Breakdown Setup | Bearish move Build🔍 Technical Overview
A clear Head & Shoulders pattern has formed on the JPY/USD 8H chart — a well-known bearish reversal setup often signaling a shift from bullish momentum to bearish control. The pattern is confirmed with a left shoulder, higher head, and lower right shoulder, all aligned along a defined neckline acting as key horizontal support.
Currently, the price is retesting both the neckline and a descending trendline, which adds confluence to the bearish bias. If price fails to break back above this resistance zone, we can anticipate a further drop toward the projected target zone.
📌 Key Technical Levels
Head: ~0.007180
Neckline Support: ~0.006660
Retest Area (Confluence Zone): ~0.006940–0.006960
Bearish Target: ~0.006470 (measured from the head to the neckline and projected downward)
Trendline Resistance: Acting as dynamic resistance since the recent high
⚙️ Price Action Insights
Pattern Clarity: The structure of the H&S is clean and symmetrical — a classic sign of distribution and topping out after a bullish rally.
Retest in Play: Price is currently retesting the trendline resistance. Rejection from this area strengthens bearish continuation potential.
Momentum Shift: Bullish pressure is weakening. Lower highs on the right shoulder show buyer exhaustion.
🧠 Mindset & Strategy
This setup demonstrates how patience, pattern recognition, and confluence can align to offer a high-probability trading idea.
✅ Wait for Confirmation: A strong bearish candle off the retest zone or neckline breakdown gives a cleaner short entry.
✅ Risk Management First: Place stops just above the right shoulder or trendline (~0.007000 zone).
✅ Target Logically: The target is not random — it’s derived using the classic measured move technique, matching the head-to-neckline distance.
📋 Trade Idea (Not Financial Advice)
📍 Entry: On rejection at retest zone or confirmed neckline breakdown
🎯 Target: 0.006470
🛑 Stop Loss: Above 0.007000 (trendline/right shoulder area)
⚖️ Risk/Reward Ratio: Minimum 2:1 if entered post-retest confirmation
🧠 Trader’s Note (Minds Insight)
This is where discipline comes into play. Don’t chase the move. Let the pattern complete and confirm. Head and Shoulders formations are among the most reliable reversal patterns — but only after neckline breaks or strong rejections.
This setup teaches traders to trust the process, combine horizontal and diagonal resistance, and let the price action do the talking.

Silver Rectangle Pattern Breakout | XAGUSD Analysis + Target🔍 Technical Overview
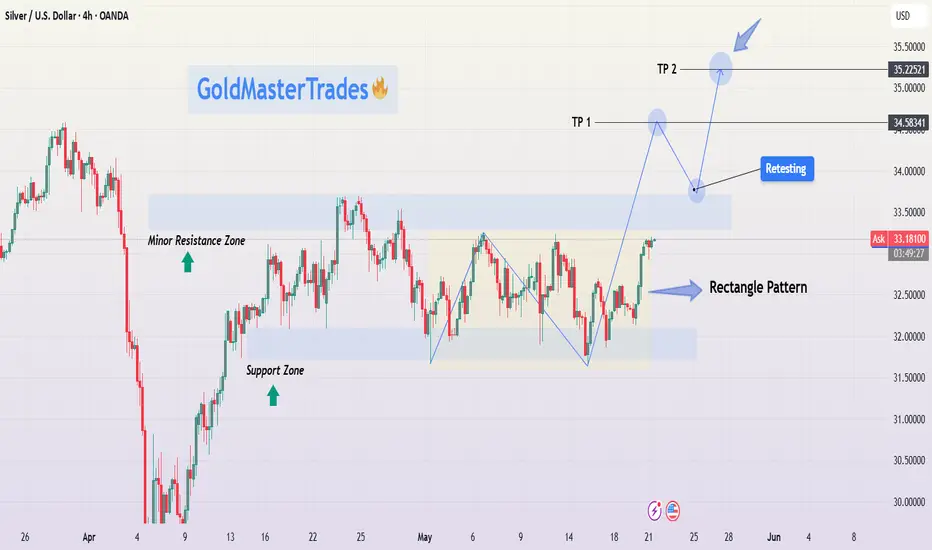
Silver has been forming a textbook rectangle consolidation pattern over the past few weeks, bouncing between a clearly defined Support Zone (~$32.10) and Resistance Zone (~$33.40). This range-bound movement indicates accumulation, a phase where smart money typically builds positions before initiating a directional breakout.
Currently, price action shows a breakout attempt toward the upper resistance. If momentum continues, we could see a bullish breakout, followed by a potential retest of the broken resistance (now support). A successful retest would confirm a high-probability setup for a move to higher targets.
📌 Key Technical Zones
Support Zone: ~$32.10
This level has been tested multiple times, with price consistently bouncing higher, signaling strong buyer interest.
Minor Resistance Zone: ~$33.00
Acted as an intermediate ceiling within the rectangle. Once broken, this level became a signpost for bullish continuation.
Main Resistance Zone: ~$33.40
The top boundary of the rectangle; this is the key breakout level.
Target 1 (TP1): $34.58
A logical resistance level based on previous price structure and breakout projection.
Target 2 (TP2): $35.22
A more extended target derived from the height of the rectangle pattern projected from the breakout point (measured move).
⚙️ Price Action Insights
Rectangle Pattern Behavior: Price ranged within horizontal support/resistance, forming consistent highs and lows — a strong signal of accumulation.
Momentum Shift: Recent bullish candles and higher lows suggest buying pressure is increasing.
Breakout in Progress: Price is currently pushing above the upper rectangle boundary. A confirmed breakout candle close followed by a retest would provide a higher-probability entry opportunity.
Retest Strategy: Retests are critical for confirmation. A pullback to ~$33.40 with rejection signals (e.g., bullish engulfing, pin bar) would strengthen the case for further upside.
🧠 Mindset & Strategy Explanation
This setup represents patience, structure, and discipline in trading:
✅ Wait for the Pattern : Rectangle patterns often trap impatient traders. Waiting for a confirmed breakout and retest gives higher-quality entries.
✅ Risk Management is Key : Use the structure of the rectangle to define risk. Stops should be set just below the last swing low or inside the range.
✅ Targeting with Precision: TP1 and TP2 are not random — they’re derived from prior resistance levels and pattern projections. This keeps your trading logical, not emotional.
✅ Mind Over Market: Don’t chase breakouts. Wait for confirmation. The retest is often your friend in swing trading setups like this.
📋 Trade Idea (Not Financial Advice)
📍 Entry: On confirmed breakout above $33.40 or retest of this level with bullish confirmation.
🎯 Target 1: $34.58 (partial take profit suggested)
🎯 Target 2: $35.22 (measured move projection)
🛑 Stop Loss: Below $32.70 (under recent support structure)
🔁 Optional: Trail stop loss after TP1 to lock in profits as TP2 approaches.
🧠 Final Thoughts for Traders
This chart provides a clean example of how price consolidates before expansion. The rectangle pattern allows for easy identification of entry/exit zones and offers a solid risk-to-reward setup. Whether you're a new trader learning to spot consolidation patterns or a seasoned pro looking for low-risk, high-reward setups — this XAGUSD formation is one to watch.
Keep an eye on volume and candle structure around the breakout zone. Confirmation is key. Discipline is everything.
EURGBP directional bias: BuyFollowing today's Pound CPI news, we have broken out of a big range that began last week. Expecting a small pullback followed by a strong buy.

Bearish Reversal Confirmed – BTC Rising Wedge TrapBitcoin (BTCUSD) on the 1H timeframe is displaying a bearish reversal structure after failing to sustain a breakout above key resistance. The recent price action has formed a Rising Wedge Pattern, which typically precedes a downside correction, especially when formed near a key supply zone. Let’s break down the setup:
🔍 Technical Analysis Overview:
🔹 1. Rising Wedge Pattern (Bearish)
A rising wedge is visible near the top of the recent bullish impulse. This wedge is characterized by converging trendlines with higher highs and higher lows, but with diminishing momentum. It typically signals a weakening uptrend and a potential trend reversal or correction once price breaks below the lower wedge boundary.
The breakout to the downside has already begun, confirming bearish intent.
🔹 2. SR Interchange Zone
The blue zone marked in the chart represents a Support-Resistance Interchange (SR Flip). This was previously an area of consolidation and breakout, acting as a key decision zone. Price is expected to retest this zone after the wedge breakdown before continuing further down.
This creates a perfect "Break → Retest → Drop" scenario, often favored by institutional and swing traders.
🔹 3. Consolidation Structure
Before the wedge formation, Bitcoin was stuck in a prolonged consolidation phase. This type of ranging price action often accumulates orders before a breakout. Once broken, these zones serve as magnets for pullbacks or liquidity grabs, and are frequently retested.
🔹 4. Target Zone
The measured move from the rising wedge pattern points to a target near $101,617, which aligns with a previous structural low and a potential demand zone. This area could serve as the next major support level.
🎯 Trade Strategy & Setup:
Entry: After confirmation of breakdown and a clean retest of the SR zone.
Stop Loss (SL): Just above the wedge high and structural resistance (~$108,020).
Target (TP): $101,617 (downside projection based on wedge height and price structure).
📌 Risk-Reward Setup: 1:3+ possible if retest confirms.
🧠 Trader’s Insight:
This setup reflects a common smart-money behavior where price forms a bullish-looking structure (rising wedge), entices buyers, and then traps them with a swift breakdown. The SR retest provides a low-risk shorting opportunity. Patience is key — let price come to your level before entering.
🚨 Risk Note:
If BTC reclaims and holds above the $108,020 level, the bearish thesis may be invalidated. Always wait for confirmation before execution.

XAUUSD Breakout from Bullish Flag – Eyes on $3,387Gold (XAUUSD) on the 1H timeframe is exhibiting a strong bullish continuation setup, supported by multiple confluences that suggest the uptrend is far from over. The chart clearly shows the market breaking out from a Bullish Flag Pattern, respecting curve support, and targeting the major resistance zone near $3,387.
🔍 Technical Breakdown:
1. Bullish Flag Pattern Formation
After a sharp bullish impulse, price consolidated in a tight downward-sloping channel — the classic bullish flag. This pattern typically appears mid-trend and signals a healthy pause before the next leg higher. The breakout from the flag confirms bullish continuation, often offering a high-probability trade entry.
2. Break of Structure (BOS)
The breakout above minor resistance marked a Break of Structure (BOS), which is a key bullish signal. It indicates a shift in market sentiment and validates the end of the corrective phase (flag) and beginning of the next impulse wave.
3. Curve Support (Parabolic Trajectory)
A parabolic curve support is now guiding price upward, showing increasing bullish pressure and higher lows forming consistently. This type of dynamic support often appears in strong trending markets where buyers step in aggressively at every pullback.
4. Liquidity Sweep & Smart Money Behavior
Before the breakout, price dipped below recent lows within the flag, likely sweeping liquidity and triggering stop-losses. This move provided institutional players with the liquidity needed to push price higher — a classic smart money trap-and-break scenario.
5. Volume & Momentum Confirmation
The breakout occurred with strong bullish momentum and rising volume (if checked on the volume profile), reinforcing the credibility of this move. A momentum-based continuation is likely as long as price remains above previous resistance (now support).
🎯 Target & Resistance Levels:
Short-Term Target: $3,387 — aligned with the previous major resistance area
Support Zone: $3,260–$3,275 (previous flag breakout + structure support)
Major Resistance Zone: Around $3,360–$3,387 (historical supply zone)
🧠 Trade Idea / Strategy:
As long as price holds above the curve support and retests the previous breakout zone (flag top or minor resistance), bullish entries on pullbacks are favored.
✅ Buy on dips into curve support or minor resistance retests.
❌ Avoid shorting into a strong parabolic structure unless signs of exhaustion appear.
🎯 Potential RR setups: 1:2 and beyond if entry is timed well.
💬 Conclusion:
The market structure, pattern confirmation, and strong bullish momentum all point toward a continuation move toward the $3,387 level. This setup provides a solid technical case for bullish trades with multiple entry options and well-defined risk levels. Keep an eye on curve support and potential higher timeframe resistance reactions for dynamic trade management.

GU-Wed-21/05/25 TDA-GBP CPI higher than expected, Bullish!Analysis done directly on the chart
Follow for more, possible live trades update!
Risk management. You can take bad trades but
you can recover with good risk management.
The profitable strategy alone isn't enough to
succeed in this game.
Not financial advice, DYOR.
Market Flow Strategy
Mister Y

GBPUSD Retests Bullish Order Block – Smart Money Loading Up!📈 GBPUSD SMC Bullish Setup – Institutional Re-Entry Into Power Zone
Traders, this is a prime example of how Smart Money manipulates liquidity, taps deep into premium OBs, and prepares for explosive continuation moves. Let’s break it down step-by-step…
🔍 Market Structure Insight:
We’ve seen a clear bullish BOS (Break of Structure) after a strong impulsive move that broke past previous highs.
Now price is retracing into the bullish Order Block, giving a golden opportunity for re-entry — but only if you know what to look for.
🔲 Key Confluences:
💎 Order Block:
Marked between 1.3332 – 1.3290, this purple zone aligns with:
Breaker candle after a liquidity sweep
Prior imbalance zone
Institutional volume spike
📐 Fib Retracement:
From the swing low to high:
61.8% → 70.5% golden zone nested inside the OB
79% just below — great stop loss placement
📉 Weak High Above:
Current price action shows the market stalling near a weak high at 1.3400 — ripe for targeting in the next expansion.
📌 Strong Low at 1.3245:
Protected unless structure breaks. This helps confirm bullish bias remains intact.
🧠 Smart Money Logic:
This isn't retail "support."
Smart Money took out early sellers, pushed price impulsively, then returned to mitigate orders inside the OB before continuing the expansion.
This retracement = institutional reloading zone.
That red candle into purple? That’s the bait. 🧨
🎯 Entry Plan:
✅ Wait for bullish confirmation inside OB (engulfing, MS shift, or liquidity wick)
✅ Ideal entry at 1.3332–1.3300
✅ Stop below 79% Fib (~1.3289)
✅ Target:
TP1: 0% Fib (~1.3400)
TP2: -27% Fib extension (~1.3445)
TP3: Moon mission? 😏
RRR ~ 1:3.5+ — solid trade for swing traders and intraday scalpers alike!
🧘♂️ Psychology & Patience Reminder:
Let price come to you.
This setup rewards discipline and confirmation — don’t FOMO early.
Watch for trap wicks and engineered fakeouts at the OB zone.
You’re not chasing price.
You’re sitting where Smart Money leaves footprints. 👣
⚠️ Risk Tip:
✅ Stick to your model
✅ 1–2% risk max
✅ Scale partials at key levels
✅ Don’t revenge trade if price reacts first without you — next setup is always coming
🔁 Summary:
This GBPUSD chart is a masterclass in Smart Money structure:
Bullish BOS
Return to Order Block
Fib confluence
Weak high liquidity target
Perfect RRR setup
🧠 Let’s play it like a pro. If OB holds — the market flies. If not, we step out, risk-managed, and wait.
📣 Comment “GBPUSD SNIPER” if you’re ready for the OB bounce.
📈 Tag your trading fam to keep them on the money wave!

21.05.25 Morning ForecastPairs on Watch -
FX:GBPAUD
FX:EURNZD
FX:GBPJPY
A short overview of the instruments I am looking at for today, multi-timeframe analysis down to what I will be looking at for an entry. Enjoy!
