2025-05-20 - priceactiontds - daily update - nasdaq
Good Evening and I hope you are well.
comment: Bears get nothing going. Everything is bought. Do not look for shorts unless you can scalp really well. We have room for 1 more day of chop but ultimately I think we will print 22000, like sp500 wants the 6000+. Bull channel is valid until broken, so look for longs.
current market cycle: trading range
key levels: 21000 - 22000
bull case: Bulls want a new ath and we are high enough, that they could easily get it. As long as we stay above 21200, the bull channel is alive and well and we are making higher highs and higher lows. Don’t need to write more for bulls because they have all the arguments on their side.
Invalidation is below 20100.
bear case: Bears can only join the chat again, once we have a daily close below 21000. This channel upwards is tight. Do not look for shorts.
Invalidation is above 21200ish but real confirmation is only below 21000.
short term: Neutral for another day but when the breakout happens, obviously bullish for 22000 and maybe some more. We have room for one more chop day.
medium-long term - Update from 2024-04-20: My most bearish target for 2025 was 17500ish, given in my year-end special. We are +18% from the lows and I do think, once this turns again, it will easily be the short trade of the year.
trade of the day: Buy low, sell high and scalp. 21400 - 21460 was the main range and both sides made money today. Only real bad trade was shorting below 21400 or buying the Globex high.
Priceaction

Bitcoin - All time highs will come next!Bitcoin - CRYPTO:BTCUSD - prepares a significant move:
(click chart above to see the in depth analysis👆🏻)
Over the past couple of months, we basically only saw sideways price action on Bitcoin. However, this does not mean, that Bitcoin is now slowing down; actually the opposite is true and Bitcoin is setting up for a major move higher. New all time highs will come very soon.
Levels to watch: $100.000
Keep your long term vision!
Philip (BasicTrading)

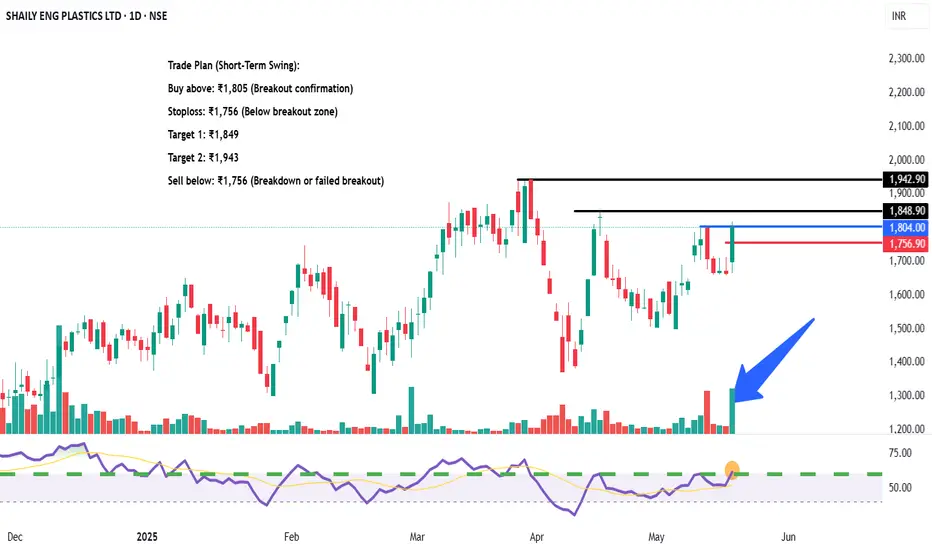
SHAILY ENG PLASTICS LTD – Breakout Watch | High Volume Spike📌 Trade Plan (Short-Term Swing):
Buy above: ₹1,805 (Breakout confirmation)
Stoploss: ₹1,756 (Below breakout zone)
Target 1: ₹1,849
Target 2: ₹1,943
Sell below: ₹1,756 (Breakdown or failed breakout)
🔍 Technical View:
Volume spike with bullish close – institutional interest likely
Breakout zone near ₹1,804 now acting as immediate support
RSI breakout supports momentum entry
Resistance: ₹1,849 and ₹1,943
Equity Research Report – NEWGEN SOFTWARE TECHNOLOGIESShort-Term View: A strong breakout above key resistance at ₹1,100 with volume surge indicates bullish momentum. Price reclaimed the 50 EMA after consolidation. RSI at 60.87 supports strength; next resistance lies near ₹1,193.90.
Long-Term View: Structurally strong after correction. Sustaining above ₹1,020 (50 EMA) may attract fresh buying. Long-term targets can stretch to ₹1,300+ if earnings and demand trends remain favorable.
Conclusion: Bullish momentum likely to continue both short and long term. Watch for volume confirmation and hold above ₹1,100.
For Education Purpose only

USDJPY - New Impulse Soon!Hello TradingView Family / Fellow Traders. This is Richard, also known as theSignalyst.
📈USDJPY has been overall bullish trading within the rising broadening wedge pattern marked in blue and it is currently hovering around the lower bound of it.
Moreover, the orange zone is a strong structure and support.
🏹 Thus, the highlighted blue circle is a strong area to look for buy setups as it is the intersection of structure and lower blue trendline acting as a non-horizontal support.
📚 As per my trading style:
As #USDJPY is around the blue circle zone, I will be looking for bullish reversal setups (like a double bottom pattern, trendline break , and so on...)
📈The bullish impulse will begin after a break above the last minor high and upper red trendline.
📚 Always follow your trading plan regarding entry, risk management, and trade management.
Good luck!
All Strategies Are Good; If Managed Properly!
~Rich
Disclosure: I am part of Trade Nation's Influencer program and receive a monthly fee for using their TradingView charts in my analysis.

NZDJPY - Off We Go... Again!Hello TradingView Family / Fellow Traders. This is Richard, also known as theSignalyst.
📈NZDJPY has been overall bullish trading within the rising channel marked in red.
Moreover, the green zone is a strong demand!
🏹 Thus, the highlighted blue circle is a strong area to look for buy setups as it is the intersection of demand and lower red trendline acting as a non-horizontal support.
📚 As per my trading style:
As #NZDJPY approaches the blue circle zone, I will be looking for bullish reversal setups (like a double bottom pattern, trendline break , and so on...)
📚 Always follow your trading plan regarding entry, risk management, and trade management.
Good luck!
All Strategies Are Good; If Managed Properly!
~Rich
Disclosure: I am part of Trade Nation's Influencer program and receive a monthly fee for using their TradingView charts in my analysis.

GOLD - WAITING FOR BREAK OUTOverall Price is still bearish, however, we may get short term buy opportunity as well.
Trade idea 1: SELL below 3207
Trade idea 2: BUY above 3225
Please note these trade ideas are for 100-200 pips target only.
Once trade is activated, I will update SL too.
Share your opinion below, Thank you.

EUR/JPY 1H: Bullish Falling Wedge Breakout + Target 🧠 Overview of the Setup
The EUR/JPY currency pair has recently completed a Falling Wedge pattern, a classic and powerful bullish reversal formation. This chart structure typically signals the end of a downtrend and the potential beginning of a strong upward impulse.
In this setup, multiple confluences point toward a bullish move, including pattern breakout, structure shift, retest of a dynamic support level, and alignment with major supply/resistance zones.
🔍 Pattern Analysis: Falling Wedge
Definition: A falling wedge is a technical pattern formed by two downward-sloping trendlines — one representing resistance and the other support — that converge. It signals a slowdown in bearish momentum, often preceding a bullish reversal.
Chart Observation: The wedge is well-defined, spanning several trading sessions. As price action tightened toward the apex, bearish momentum began to weaken.
Breakout Trigger: Price broke convincingly above the upper wedge boundary, suggesting the start of a bullish reversal.
✅ Implication: The breakout confirms that buyers have taken control, especially as this move is supported by a structural Change of Character (CHOCH).
📈 Price Action Structure & Key Zones
1. Minor Resistance (Broken)
After the breakout, price encountered a minor resistance zone just above the wedge. This area is now likely to flip into support (a classic breakout retest).
2. Major CHOCH (Change of Character)
A CHOCH indicates a break in market structure — from lower highs and lower lows to higher highs and higher lows.
The break above this level confirms a shift from bearish to bullish sentiment.
3. Curved Support (Black Min Curve)
A rising curved trendline has formed below current price, acting as a parabolic support structure.
This suggests not just a trend reversal, but increasing bullish momentum, as buyers step in at higher levels with each correction.
4. Major Resistance Zone (Target Area)
Price Target: ~164.50 – 165.50
This zone has historically acted as strong supply and is marked for potential take-profit or observation for reversal signals.
The target is derived from both horizontal resistance and the projected height of the wedge pattern.
🎯 Trading Strategy
Component Details
Entry Zone 162.50 – 162.60 (retest of minor resistance + curve support)
Stop Loss Below 162.00 (beneath wedge and curve)
Take Profit 164.50 – 165.50 (major resistance)
Risk/Reward Approx. 1:2.5 to 1:3
🔸 Conservative Entry: Wait for bullish confirmation (bullish engulfing candle or pin bar) on the support retest.
🔸 Aggressive Entry: Market buy after confirmation of curve bounce or on lower timeframe bullish signals.
📊 Volume & Momentum Consideration
Although volume isn’t shown on this chart, volume confirmation on the breakout would significantly strengthen the bullish bias. Look for:
Increasing buy volume on breakout
Lower sell volume on pullbacks
Bullish divergence (if using RSI or MACD)
⚠️ Risk Management & Event Awareness
Be cautious of unexpected JPY-related economic releases (e.g., BOJ announcements, inflation data) that may cause volatility.
If the curved support is broken decisively, this could invalidate the setup, suggesting further consolidation or downside risk.
🧠 Psychological Perspective
The Falling Wedge reflects a market where sellers are gradually losing control — pushing price lower, but with less conviction. As the wedge tightens, bulls prepare to step in. The breakout confirms that sentiment has shifted, and many traders use such setups as entry points for swing or momentum trades.
The curved support line suggests a transition from accumulation to markup phase, which typically leads to faster price expansion as confidence in the uptrend grows.
✅ Summary
✅ Pattern: Falling Wedge (Bullish)
✅ Breakout: Confirmed with CHOCH
✅ Support: Curve trendline acting as dynamic support
✅ Target: 164.50 – 165.50 major resistance
✅ Bias: Bullish (until curve support is broken)
📣 Final Thoughts
This is a high-probability bullish continuation setup backed by price structure, pattern breakout, and support alignment. The risk is well-defined, and reward potential is strong — making this a favorable setup for swing traders or short-term position traders.
💬 Let me know what you think in the comments — are you going long EUR/JPY?
👍 Like and Follow for more setups and breakdowns.

EUR/GBP – Bearish Breakout Expected & Triangle Pattern + TargetThe EUR/GBP pair is currently consolidating within a well-defined symmetrical triangle pattern on the 1-hour timeframe, often considered a neutral pattern that precedes a breakout in either direction. However, when placed in context with the prevailing downtrend, surrounding key support/resistance zones, and price action behavior, this pattern strongly hints at a bearish continuation.
This is a textbook setup where market compression within a triangle leads to a volatility expansion, offering traders a clear breakout structure with manageable risk and high reward potential.
🔺 Chart Pattern: Symmetrical Triangle
A symmetrical triangle forms when the price creates lower highs and higher lows, converging toward an apex. This indicates market indecision or consolidation. The price is being squeezed between buyers and sellers, leading to reduced volatility.
In the current EUR/GBP chart:
The triangle is forming after a strong bearish impulse, which suggests the probability favors a breakout to the downside (trend continuation).
The triangle’s boundaries are respected with multiple touches, increasing the reliability of the pattern.
🧭 Key Technical Levels:
🔴 Resistance Zone:
The 0.84290 level has acted as strong resistance, capping bullish attempts multiple times. This zone aligns with the upper boundary of the triangle and the prior rejection point.
🟢 Support Zone:
The 0.83915 - 0.83710 zone is a previous support structure that saw multiple reactions. This is the projected take-profit region if the breakdown follows through.
🔵 Breakout Retest Area:
If price breaks the lower triangle trendline (~0.84100), a retest of the broken line may offer a high-probability short entry. This is a common occurrence in technical setups — former support becomes new resistance.
🧠 Market Psychology Insight:
Triangle patterns often reflect a period of balance — bulls and bears are temporarily equal in strength. However, when the price is compressing inside a triangle after a strong directional move (in this case, downward), the market is typically building pressure to continue in the same direction.
The inability of bulls to push past the resistance and the repeated rejection at lower highs is a psychological signal that buyers are weakening, and a bearish breakout is imminent.
📋 Bearish Trade Plan:
Entry:
After price breaks below the lower triangle boundary (~0.84100) and retests it.
Enter on confirmation of bearish candle rejection or strong volume.
Stop Loss (SL):
Above resistance and triangle top: ~0.84290
This invalidates the setup if breached.
Take Profits:
TP1: 0.83915 — minor support zone and realistic first target.
Final TP: 0.83710 — major support and historical price reaction level.
Risk-Reward Ratio:
With SL around 20 pips and TP1 around 30 pips, and TP2 near 50 pips, this setup offers an excellent risk-reward profile (>1.5 to 2.5 R:R).
📅 Upcoming Events & Volatility Watch:
There are multiple economic events shown on the chart (Euro and UK flags). These could impact price action significantly:
Eurozone announcements
UK economic data releases
Ensure you monitor the economic calendar and avoid entering just before high-impact events unless you're managing your trade closely.
📝 Final Thoughts:
This is a high-probability breakout setup for swing or intraday traders who favor trading patterns with clear structure and back-tested success. The market is compressing, and the squeeze is tightening. Volume is likely to surge on breakout, especially during London or early US sessions.
Keep in mind:
Confirmation is crucial — wait for a decisive breakout and retest before committing capital.
Risk management is non-negotiable — place SL logically beyond structure and respect it.
📌 If the breakout happens to the upside, reevaluate the bias and wait for fresh confirmation. The structure itself remains valid either way — it’s how price reacts at those boundary levels that will dictate the move.

EUR/USD Short Opportunity – Rising Wedge + Retest + TargetThis technical setup on EUR/USD (1H timeframe) highlights a potential high-probability short opportunity based on a combination of price action, chart patterns, and key structural levels. The pair is showing signs of weakening bullish momentum and preparing for a bearish continuation.
🔎 1. Pattern Analysis: Rising Wedge Formation
The primary pattern visible is a Rising Wedge, which is traditionally a bearish reversal formation. It’s defined by:
Higher highs and higher lows, but both trendlines are converging, suggesting weakening bullish control.
Volume (not shown here) typically decreases within a rising wedge, further confirming a potential breakout.
This wedge formed after a previous sharp bullish recovery, acting as a continuation structure that often reverses.
In this case, the price formed multiple touches on both wedge boundaries, enhancing the reliability of the pattern.
🧱 2. Key Structural Zones:
Minor Resistance Zone (~1.1270–1.1285):
Clearly marked on the chart with a blue shaded zone.
Price has reacted from this level multiple times, validating it as a supply area.
The most recent attempt to break above this level failed, further confirming seller dominance.
Consolidation Zone (highlighted in yellow):
Prior to the wedge’s formation, price entered a consolidation phase.
Consolidation often precedes a breakout or a trend reversal. In this case, it provided a base for the rally that formed the wedge.
🔁 3. Breakout and Retest:
Price has broken below the lower support line of the rising wedge.
This breakout is a bearish signal and suggests the pair may now be ready for a stronger downside move.
The price appears to be retesting the broken wedge support, which is a classic confirmation move before continuation.
Retests of broken structures often offer low-risk, high-reward entry opportunities.
🎯 4. Trade Plan and Setup:
Entry Zone: Watch for bearish rejection or candle confirmation on the retest of the wedge support turned resistance.
Stop Loss (SL): Positioned just above the resistance zone, at 1.12887, protecting the trade against false breakouts or reversals.
Take Profit Levels:
TP1 – 1.10649: This level is a strong support zone based on previous price action and structural significance.
TP2 – 1.09670: The full measured move from the height of the wedge. This also aligns with historical support and psychological round number proximity (1.10).
🧠 5. Confluence Factors:
Technical Pattern: Rising wedge = bearish.
Support/Resistance: Multiple reactions to both the resistance zone and wedge trendlines confirm market memory.
Price Action: Break + retest = ideal entry confirmation.
Risk-Reward Ratio: Favorable, especially with conservative TP1 and aggressive TP2 levels.
Macro Context (optional): If posted during news week – potential USD strength based on rate expectations, NFP, or inflation.
⚠️ 6. Risk Management Tips:
Use a position size that aligns with your account risk tolerance (1–2% rule).
Wait for confirmation (bearish engulfing candle or rejection wick) before entering.
Always be prepared for invalidation. If price closes above the resistance zone, this idea is voided.

JPY/USD Rising Wedge Pattern Formed | Retest & Move To Target🧠 Overview:
The JPY/USD pair has recently exhibited a Rising Wedge Pattern, a classic technical formation known for its bearish implications. This pattern has developed over several days of bullish price action, showing diminishing bullish momentum as price action narrows.
The wedge is forming right beneath a minor resistance zone, increasing the likelihood of a potential rejection and breakdown. This setup is particularly noteworthy due to the multiple layers of confluence supporting the bearish bias.
🔍 Technical Breakdown:
📌 1. Rising Wedge Formation
A rising wedge is often considered a bearish reversal pattern, especially after a strong uptrend.
As seen on the chart, price is respecting both the upper and lower bounds of the wedge, but with a loss of bullish momentum, indicated by shallower highs.
This tightening price action hints at indecision and likely exhaustion from buyers.
📌 2. Minor Resistance Zone
Price has approached a previous structure high where strong selling interest was seen before.
This zone has already rejected price once, acting as a supply area.
The repeated failure to break above reinforces the strength of this resistance.
📌 3. SR Interchange (Support Turned Resistance)
Below the current price action, there's a well-defined Support-Resistance Flip Zone (SR Interchange).
Previously a strong demand area, this zone may now act as a new resistance if price breaks below and retests it.
This is a key area where sellers are likely to step in again.
📌 4. Break & Retest Structure
As price begins to break the lower wedge boundary, the next move we anticipate is a retest of the broken wedge trendline.
This retest, if confirmed by rejection candles (such as bearish engulfing or pin bars), would present an ideal entry opportunity for short positions.
🎯 Trade Plan & Price Levels:
💼 Bearish Scenario
Entry Point: Wait for a successful retest of the broken wedge line (confirmation via price action: bearish engulfing or pin bar).
Stop Loss: Above the recent swing high or above the wedge resistance (~0.006920).
Take Profit 1 (TP1): 0.006845 – First key support zone.
Take Profit 2 (TP2): 0.006807 – Next major support / liquidity zone.
🧩 Why This Setup Makes Sense:
✅ Multiple Confluences:
Bearish wedge structure = reversal pattern.
Resistance zone = psychological and technical rejection.
SR Interchange = confirms institutional selling interest.
Retest confirmation = high-probability entry.
Target zones = based on recent support levels and market structure.
🛑 Risk Management:
Risk-to-reward ratio favors short positions if executed after retest.
Avoid jumping in early — wait for confirmation.
Proper stop loss is key to avoiding false breakouts or premature entries.
📊 Summary:
This is a textbook bearish setup with strong technical backing. The rising wedge pattern, when combined with resistance and retest zones, offers a great shorting opportunity — assuming price respects the pattern. Patience will be crucial here; wait for the break, the retest, and the confirmation before entering.
🔔 What to Watch:
Price behavior near the lower wedge boundary.
Reaction on retest — do bulls defend or do bears take over?
Confirmation from volume or price action (engulfing candles, rejection wicks).
Any fundamental catalysts or USD-related news.
✍️ Final Thoughts:
This is a well-structured short setup on the JPY/USD 1H chart. Wedges often deceive with temporary breakouts before reversing hard — so discipline, timing, and confirmation will be key. If the market respects this technical structure, we could see a clean drop toward our projected targets.

XAGUSD Triangle Pattern Forming – Breakdown on the Horizon?🧠 Technical Analysis – XAG/USD
Silver (XAG/USD) has entered a compression phase, forming a classic Symmetrical Triangle Pattern within a broader Black Mind Curve structure, which adds additional psychological and visual significance. These patterns, when paired together, often signal a build-up of volatility ahead of a powerful breakout.
🔍 Pattern Explanation: Triangle + Black Mind Curve
Symmetrical Triangle Pattern: This pattern is marked by converging trendlines of higher lows and lower highs. It reflects indecision between bulls and bears — a tug-of-war where volatility decreases as price coils into the apex.
Black Mind Curve Structure: The curved support and resistance arcs highlight a rounded structure often seen before large breakout moves. These curves create an intuitive framework for understanding how the market is behaving on a broader scale — the "mind of the market" if you will.
🔺 Curve Resistance: Acting as a ceiling suppressing bullish attempts.
🔻 Curve Support: The dynamic floor that has held price within bounds until now.
📉 Breakout & Retest Phase in Play
The triangle has now been breached to the downside, and price is currently in the retest phase — a textbook behavior before continuation. The market is now revisiting the lower boundary of the triangle (~$32.30–$32.40), which is potentially flipping into resistance.
This retest is critical: if price fails to reclaim the triangle and gets rejected, it strengthens the case for further downside.
We’ve also seen a slight uptick in bearish momentum and volume on the initial breakdown.
🎯 Projected Price Targets
We apply the measured move technique, which calculates the triangle’s height and projects it downward from the breakout point:
TP1: $31.68 – A short-term support level and the first technical target.
TP2: $31.12 – Measured move target and key demand zone from the past week.
These levels are not arbitrary — they align with both psychological round numbers and historical structure zones, which often act as magnets for price.
📌 Why This Setup Matters
This isn’t just a triangle breakout. The confluence of the triangle pattern and the Black Mind Curve framework suggests a psychologically significant shift is underway.
Price has respected the curved structure for nearly two weeks.
The triangle represents compression — the final phase before directional expansion.
The false breakout risk is real, but the context (bearish trend leading in, lower highs, failed rallies) favors a downward continuation.
💡 Trade Setup Idea (Example Only)
Parameter Value
🧩 Pattern Symmetrical Triangle
⏳ Phase Retesting after breakdown
🎯 Entry On bearish confirmation at ~$32.30
❌ Stop Loss Above triangle upper bound (~$32.65)
✅ TP1 $31.68
✅ TP2 $31.12
⚖️ Risk/Reward 1:2 or better
Note: Wait for clear rejection candlesticks (e.g., bearish engulfing, shooting star) to confirm bearish intent.
⚠️ Risk Management & Considerations
Avoid premature entries — wait for candle confirmation on the retest zone.
Adjust lot size and leverage according to personal risk tolerance.
Remember: triangle patterns can break either way — monitor invalidation levels carefully (e.g., a breakout back into triangle with strong volume).
💬 Mindset & Market Psychology
This triangle and curve setup mirrors a battle between consolidation and trend continuation. The curves represent the market’s subconscious behavior — as price rounds out and tests boundaries, the final breakout reveals collective trader sentiment.
“Patterns are footprints of psychology. Trade the behavior, not the prediction.”
Be the trader who waits for the story to unfold. Let structure speak before you act.
✅ In Summary
📌 Pattern: Triangle inside Black Mind Curve
🔍 Key Levels: $32.30 (retest), $31.68 (TP1), $31.12 (TP2)
📉 Bias: Bearish, with potential continuation after retest rejection
⏱️ Timeframe: 1H – Suitable for intraday to short-term swing trades
💬 What do you think – is Silver ready to break down, or will bulls reclaim control? Drop your analysis below! Like & follow for more smart technical setups every week.

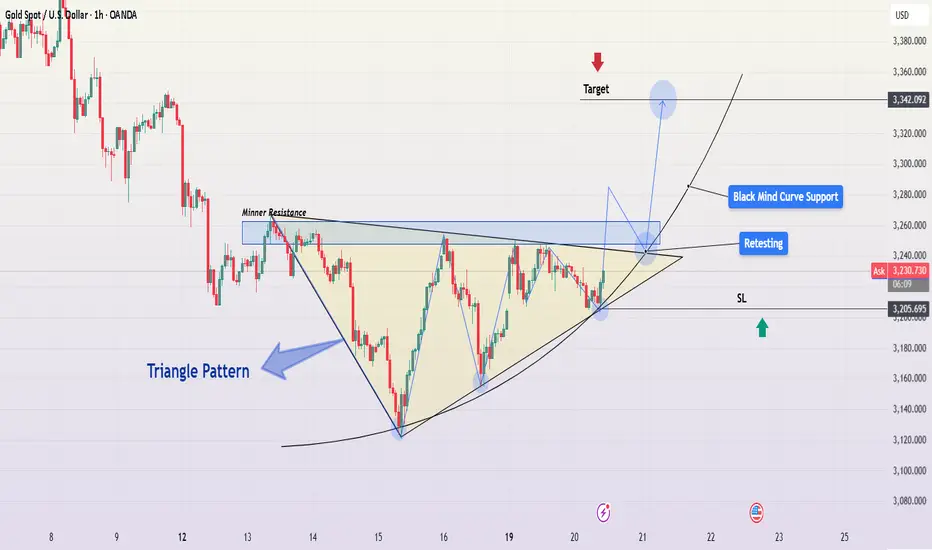
Symmetrical Triangle Breakout Setup on Gold (XAUUSD)Gold traders, pay attention! We’re watching a textbook triangle pattern unfolding on the 1-hour timeframe for XAUUSD (Gold vs USD) — and the breakout could be just around the corner. Let’s break down what’s happening technically and why this setup could offer a high-probability opportunity.
🔺 Pattern Overview: Triangle Formation
We’ve got a clear symmetrical triangle pattern developing — marked by converging trendlines of lower highs and higher lows. This type of structure often signals a buildup of pressure, a “coiling spring” waiting to explode in one direction. These patterns don’t last forever, and based on recent price action, we’re approaching the apex — which means a breakout is likely imminent.
📌 Key Technical Elements
🔷 1. Minor Resistance Zone
A minor resistance zone lies just above the upper triangle boundary. This area has previously acted as a ceiling where sellers stepped in. A decisive candle close above this level would confirm a breakout — turning this resistance into a potential new support.
🔷 2. Retesting Zone
After a breakout, it's common to see a retest of the breakout level. The chart anticipates this scenario with a projected pullback to the triangle edge. If price respects this zone and forms bullish candlestick patterns (like a bullish engulfing or pin bar), it could provide an ideal entry point with lower risk.
🔷 3. Black Mind Curve Support
There’s a curved support line acting as dynamic support beneath the triangle. This "Black Mind Curve" reflects broader market psychology — it's the path where bulls might step in again if price dips. It adds a second layer of confluence support for this trade setup.
📍 SL & Risk Management
The chart also defines a clear Stop Loss (SL) level around $3,205 — placed slightly below both the triangle’s lower boundary and the curved support. This is a sensible location to minimize downside while allowing room for minor volatility.
🛡️ Pro tip: Always risk only a small percentage of your account per trade — ideally 1-2%.
🎯 Projected Target: $3,342
If the breakout plays out as expected, the projected move targets the $3,342 level. This aligns with:
The height of the triangle projected from the breakout point (measured move)
Previous horizontal resistance and Fibonacci extension zones
This offers a strong risk-to-reward ratio, especially if entry is timed during the retest phase.
🧠 Market Psychology Insight
What’s happening under the surface?
Bulls are gradually stepping up, making higher lows.
Bears are losing steam as each push down is weaker than the last.
Volume is likely compressing, indicating a buildup of energy.
Once one side gains control (likely bulls based on this setup), a sharp impulsive move is expected.
💡 How to Trade This Setup
Wait for confirmation: Look for a strong bullish breakout candle above the triangle & minor resistance.
Entry Options:
Breakout entry on confirmation candle
Retest entry near triangle top (lower risk, better R:R)
Set SL below the triangle & curve (~$3,205)
Target: First take-profit at $3,280; second at $3,342+
📣 Final Thoughts:
This setup is a powerful blend of technical structure, support dynamics, and clear breakout potential. While nothing is guaranteed in trading, this is a high-quality formation that deserves a spot on your watchlist.
Let the market show its hand — don’t rush the entry. Wait for confirmation, manage your risk, and let the probabilities do the heavy lifting.
🔖 Tags:
#XAUUSD #GoldAnalysis #TrianglePattern #PriceAction #ForexTrading #BreakoutTrade #SwingTrade #TradingViewIdeas #TechnicalAnalysis #GoldBreakout #RiskManagement
20.05.25 Morning ForecastPairs on Watch -
FOREXCOM:COFFEE
FX:EURUSD
FX:AUDJPY
A short overview of the instruments I am looking at for today, multi-timeframe analysis down to what I will be looking at for an entry. Enjoy!

GU-Tue-20/05/25 TDA-Strong resistances ahead of GBP CPI!Analysis done directly on the chart
Follow for more, possible live trades update!
Price action, react to how candle form and move.
Not financial advice, DYOR.
Market Flow Strategy
Mister Y

GJ-Tue-20/05/25 TDA-Uncertainty ahead of GBP CPI!Analysis done directly on the chart
Follow for more, possible live trades update!
Knowledge per se won't make you money, it is
applying the knowledge and in this case in trading
doing live trades will help you to possibly make money.
Not financial advice, DYOR.
Market Flow Strategy
Mister Y

AstraMicro ,1Dpattern looks Nic e and Ready to Breakout , Nifty is also Bullish
wait for upper Trendline to Breakout
risk according to your capacity and aim 1:2 in Every Trade so that you would be in Profitable
aim for 30% min
Follow for More Swing ideas like this

2025-05-19 - priceactiontds - daily update - daxGood Evening and I hope you are well.
comment: Bulls finally got their retest and a higher high. Now is decision time. Can we do another leg up or is this a bull trap and we finally reverse for a deeper pullback over the next days? I heavily favor the latter but for now bears are nowhere to be seen and until then, looking for shorts is suicide. 24300 could be the potential next target if we continue in the bull channel on the 1h chart.
current market cycle: broad bull channel
key levels: 23000 - 24300
bull case: Bulls got 24000 and we are in a perfect channel upwards. Trade it until broken. I will only scalp this and if we break above this channel or go beyond 24300, it will be without me.
Invalidation is below 23300.
bear case: I see the odds of this becoming a late bull trap greater than another leg up but so far, bears are doing nothing, so do not look for shorts. Only below 23700 is the current channel broken and we test 23600 next. Below that, 23400 would be next but we closed at the highs and thinking about anything below 23700 is senseless for now.
Invalidation is above 24130.
short term: Neutral. Pullbacks will likely be good long opportunities until we see bigger selling pressure. Bulls in full control but I will not buy the highs.
medium-long term from 2025-05-11: So here is my very rough guess about the next months. This short squeeze is clearly overdone and global macro stuff has most likely already deteriorated a great deal. Down to 20000 over the next weeks and form a big trading range. Up through October-Year end. Zero thought about a new bull trend above 24000 or that we have seen the lows for either 2025 or 2026. Good question is always, “How would you allocate 100k right now?”. 50% short dax, 25% of it levered/options and with the rest I would scalp.
trade of the day: Buying Friday’s low at 23788 and hold at least for gap close. The move up was strong enough to continue to hold and market has printed 6 consecutive 1h bull bars.

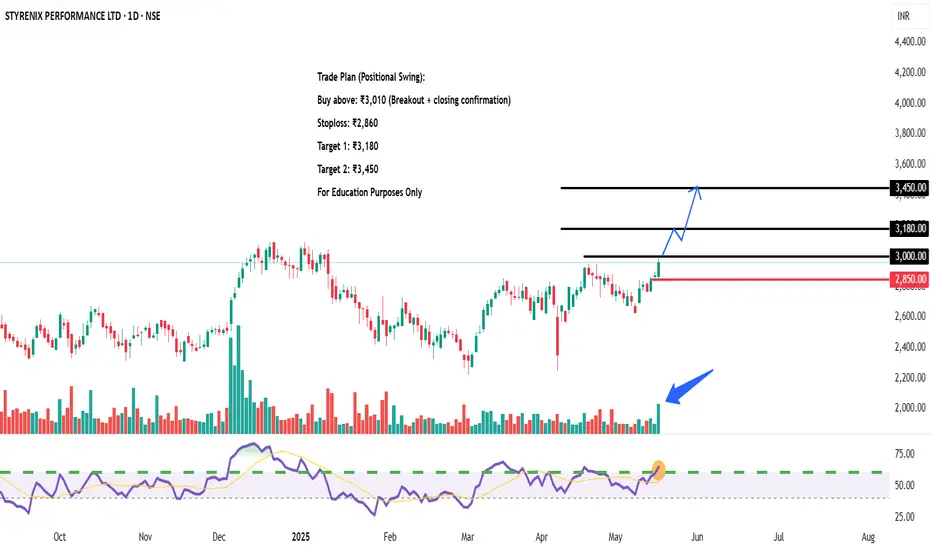
STYRENIX PERFORMANCE LTD – Near Resistance 🔍 Technical View:
Multiple BOS/CHoCH indicate structure shift
Strong low formed at ₹2,100 zone
Demand zones tested & respected between ₹2,400–₹2,600
RSI near breakout level (~70), indicating building momentum
📌 Trade Plan (Positional Swing):
Buy above: ₹3,010 (Breakout + closing confirmation)
Stoploss: ₹2,860
Target 1: ₹3,180
Target 2: ₹3,450
Sell below: ₹2,850 (If resistance holds or breakdown happens)
WTI Update | Oil CrashSince the last update we were able to perform about two to three swing trades. One from $70 - $79, and from $79 to $68. The next move I'm looking for is another short position from current market price ~($62) to swing to the next major low $33.
We saw a rejection last week and we're currently pulling back to retest the little selloff we had.
Could say this next local move will look to selloff mid week making its way back to $57 which would be a nice short term swing.
The $33 target would be the long term swing of course and moving on I would like to see a break below $57 and a retest.

GOLD → Correction & The decline will continueGold is trading below major resistance zones: Bearish Bias Below Key Levels
Price recently rejected this zone multiple times, forming lower highs and showing bearish momentum.
📉 Idea: Sell
📍 Sell Zone: $3,245–$3,250
📍 Sell Zone: $3,265–$3,270
Bias remains bearish unless price breaks and holds above $3,270.
Comment below your thoughts. Thank you.

GU-Mon-19/05/25 TDA-Closure above for buy and below for sell!Analysis done directly on the chart
Follow for more, possible live updates!
Before trade analysis
During trade analysis
After trade analysis
All important steps to fully understand
technically and fundamentally why price
moved this, that way.
Not financial advice, DYOR.
Market Flow Strategy
Mister Y

NZDJPY: Another Bullish Confirmation 🇳🇿🇯🇵
If you remember, I already posted a bullish outlook for NZDJPY on Friday.
This morning, I spotted one more intraday bullish confirmation.
I see a breakout of a resistance line of a bullish flag pattern on an hourly time frame.
I expect a bullish movement at least to 85.9 level soon.
❤️Please, support my work with like, thank you!❤️
I am part of Trade Nation's Influencer program and receive a monthly fee for using their TradingView charts in my analysis.
