A fall is on the horizon — watch out!OANDA:NZDUSD
Channel breakout confirmed, with sellers showing interest.
The price is now ideal for shorts — I’m jumping in.
Priceaction

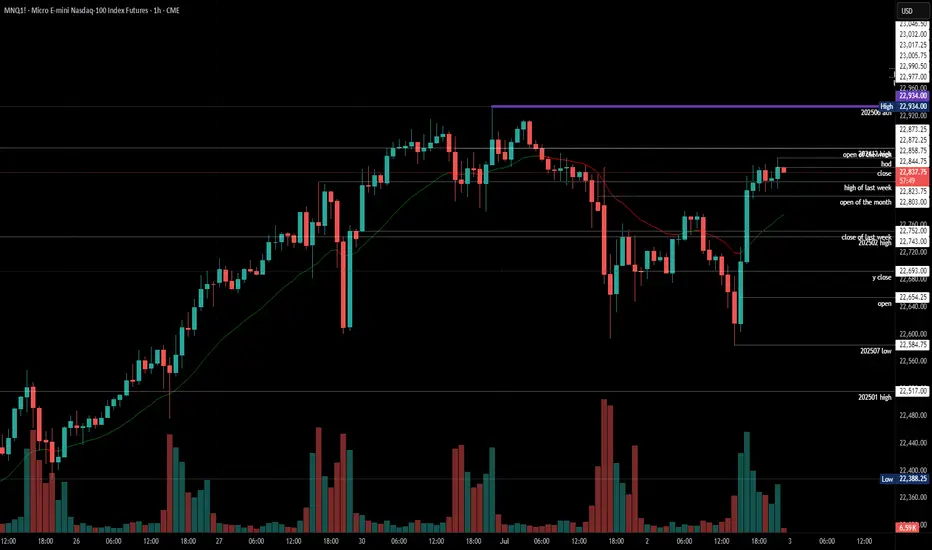
2025-07-02 - priceactiontds - daily update - nasdaqGood Evening and I hope you are well.
comment: Big down, big up. Clear trading range. Play it until broken.
current market cycle: bull trend on higher tf but trading range on the 1h tf
key levels: 22500 - 23000
bull case: Bulls want 23000. Nothing changed. Bulls buy every dip below 22670 and until that stops, we stay at the highs and chances of higher prices are greater than a deeper pullback. I have no targets above 23000 though.
Invalidation is below 22500.
bear case: Bears not doing enough and have to scalp out or their profits disappear. They need a strong 1h close below 22500 for more downside but for now markets are continuing to ignore every bad news and the structure is as bullish as it gets on the daily tf. Bears are barely making money, so try to look for easy longs.
Invalidation is above 23200.
short term: Neutral but I still expect 23000 to get hit and maybe some more squeeze above. Zero interest in shorts and longs only for scalps and small. It’s still overbought and a deeper pullback is expected over the next days.
medium-long term - Update from 2024-06-29: No change in plans. I expect 20000 to get hit over the next 3 months and maybe 19000 again.
trade of the day: Longs below 22670 have been amazing since Friday.
GU-Wed-02/07/25 TDA-Market positioning not the best atmAnalysis done directly on the chart
Follow for more, possible live trades update!
I often share my live trades in Tradingview public chat in London session, stay tuned!
Another factor that plays huge your trade setups, ideas is
market positioning. Your ideas might be good, but with
bad market positioning there's high chance price might
stop you out before going to your direction.
Active in London session!
Not financial advice, DYOR.
Market Flow Strategy
Mister Y

Swing Trade Plan: MAN Industries (NSE: MANINDS)
A classic Cup & Handle Pattern bullish continuation pattern showing accumulation and a breakout from resistance. Indicates renewed buying interest.
Breakout supported by rising volume, confirming buyer strength.
Price holding above 20 and 50 EMA, indicating bullish trend continuation.
Company has consistent order inflows and is part of infra/pipe supply chain, aligning with current government spending themes.
This is my personal swing trade plan based on price action and fundamental analysis. Please do your own research before taking any investment decision.

Gold (XAUUSD) – Bias for July 2Yesterday, price broke above the key H4 Lower High zone (3348–3350) with strong bullish momentum.
This breakout suggests a possible shift in the higher timeframe structure — indicating that the market may now be building toward a larger uptrend.
But we don’t chase breakouts — we prepare for the pullback phase .
🔍 What to Watch:
At present, M15 remains in a clean uptrend , fully in sync with the new H4 structure.
This multi-timeframe alignment gives us a clear bullish bias — but not an entry by itself.
We now need to see how price develops the pullback.
The best trades come when structure retraces with clarity — and confirms before continuation.
📍 Key M15 Level to Track:
• 3302 – Current M15 Higher Low
→ If this level holds, we may see a continuation of the uptrend from here.
→ If it breaks, the next potential reversal zone is around 3290 , where demand may reappear.
🎯 Execution Plan:
The trend is now clearly bullish across HTF and LTF.
We will only look for long setups , and only where structure confirms — either at the current HL or at deeper demand zones.
No confirmation = No trade.
No alignment = No edge.
Let price come to you. Our job is not to anticipate, but to align.
📖 From the Mirror Philosophy:
“In trend-following, the edge lies in waiting — not in chasing.
The market will reflect your patience back at you.”
📘 Shared by @ChartIsMirror
Author of The Chart Is The Mirror — a structure-first, mindset-grounded book for traders

2025-07-01 - priceactiontds - daily update - daxGood Evening and I hope you are well.
comment: If I had longs for 24400+ I would really doubt my position right now. Problem for the bears is, that it’s not low enough to be definitive. Only below 23600 we are making lower lows again and those can not happen in bull trends. Strong enough selling but I have my doubts that bears get follow-through tomorrow. Especially when other markets are rallying instead of selling. Above 24000 we likely see more upside but if bears are strong, they keep the market below and continue lower.
current market cycle: unclear. bull trend could continue but trading range is most likely
key levels: 23100 - 24500
bull case: Bulls need to stay above 23700 bad and continue higher for 24000. If they manage to break above 24k and the bear trend line, there is no reason why we can’t have another strong leg up. Until the bear channel is broken, they are not favored for anything. This could have been a retest of the daily 20ema, but only if we move strongly higher tomorrow.
Invalidation is below 23600.
bear case: Bears need follow-through below 23600 and close the gap to 23540. Then they have a good argument to trade down to 23100 or lower. Right now I would not short the lows because the risk of trading back up to 24000 is too big. The bear channel is clear and valid until broken.
Invalidation is above 24050ish.
short term: Slightly bullish that we bottom out above 23750 and trade back up to 24000 but I would only do small scalps here. Anything below 23700 would surprise me more than 24000.
medium-long term from 2025-06-29: Bull surprise last week but my targets for the second half of 2025 remain the same. I still expect at least 21000 to get hit again this year. As of now, bulls are favored until we drop below 23000
trade of the day: Short from EU open.

HUGE +979% day $4 to $46 on 100M shares traded $BMNR🚀 HUGE +979% day $4 to $46 BMNR on 100M shares traded 🤯
Shortsellers were trying all kinds of manipulations during the day but at the end got squeezed after hours
#stockmarket #stocktrading #trader #daytrading #chart #10X

GoldFxMinds XAUUSD Daily Sniper Plan – July 1🌅 Good morning, gold hunters!
The start of a new month is here, and price action is as wild as ever! Yesterday’s liquidity raids swept both sides, leaving most traders guessing – but structure never lies. Let’s break down exactly where the real money sits for July 1, so you never get caught on the wrong side of gold.
🌎 Macro, News & Geopolitics
Macro: US data is in focus (ISM PMI, JOLTS, Powell speech), keeping volatility high and liquidity pools exposed.
Geopolitics: Tensions persist globally but no fresh headlines – market is pure price-driven.
Sentiment: Bulls got trapped high, sellers are hungry for a deeper sweep. Don’t trust easy breakouts!
🏛️ HTF Bias Recap
Weekly: Bullish structure, but overextended. Pullback zones active, buyers get best deals only at true discount.
Daily: Strong wick rejections at supply, sellers showing teeth. Watch for lower highs and failed breakouts.
H4: Range between 3332 and 3258, liquidity building at both edges. Smart money will hunt stops before any trend is real!
🔑 H4 Key Structural Levels
Premium Supply: 3320–3332 (main unmitigated supply block)
Mid Range Decision: 3296–3306 (watch for PA shift, don’t force entries here)
Discount Demand: 3272–3258 (clean OB/imbalance confluence)
Deep Discount Demand: 3232–3218 (ultimate liquidity pocket)
🎯 Sniper Zones (M30/M15 Refined)
SELL Zones:
3320–3332:
The untouched supply – only sell if PA prints a reversal after a NY liquidity grab. Don’t jump in early!
3345–3360:
Extreme extension zone. If price overreaches, look for signs of exhaustion. This is the bear’s last stand!
BUY Zones:
3272–3258:
True discount! Wait for a stop run below 3275, then catch the bounce ONLY if you see confirmation (engulfing, CHoCH, RSI support).
3232–3218:
No hope trades here. Only for flash crash or panic sell-offs with obvious absorption! Wait for a real PA reversal.
Decision Zone:
3296–3306
If price is stuck here, sit on your hands! Let the market show its hand first.
🚦 Quick Recap
Avoid already-mitigated zones – only hunt where liquidity is fresh!
NY session wicks and fake breakouts are the biggest traps. Be patient, let the stop hunt finish before you engage.
Confirmation over prediction. Discipline is your edge, not drawing boxes.
🎁 Bonus Tip
"Missing a sniper entry? The best traders never chase. Let gold come to you. There’s always a second chance for those with patience!"
📣 Like what you see?
Smash that like🚀🚀🚀 , drop your thoughts in the comments , and don’t forget to follow GoldFxMinds for more high-precision gold plans!
Analysis powered by Trade Nation chart feed – built for the sharpest minds in gold.

EURGBP Watching the FVG for a Possible Push HigherEURGBP has been showing a clean bullish structure on the 1 hour chart. We got a solid break of structure that left behind an imbalance and price is now pulling back.
There’s a fair value gap just above the previous day’s low and also some local liquidity resting below the last minor low. If price dips into that FVG, fills the imbalance and takes out a bit more liquidity, it could set up the next move up.
I’ll be watching how price reacts in that zone. A strong rejection could signal buyers stepping back in to target the highs and sweep the liquidity sitting above.
No need to rush. Let the market come into the level and prove itself first.

01.07.25 Morning ForecastPairs on Watch -
FX:EURNZD
FX:GBPCAD
FX:EURUSD
FX:GBPJPY
A short overview of the instruments I am looking at for today, multi-timeframe analysis down to what I will be looking at for an entry. Enjoy!

GU-Tue-01/07/25 TDA-Strong resistance area approaching 1.37500Analysis done directly on the chart
Follow for more, possible live trades update!
I often share my live trades in Tradingview public chat in London session, stay tuned!
Timing!
You might ask yourself why sometimes your
trade idea was good but still ended up hitting your sl before it moves to your direction.
The reason is simple: Timing.
price is just not ready to push at that time
and needed extra liquidity and structure before it finally has the force to push.
Understanding when the market is ready is one of the most difficult thing for a trader to do but with experience you start to understand better and improve.
If you like the way I present and analyze, make sure to boost,
share and follow me for more future posts, ideas and useful informations.
Active in London session!
Not financial advice, DYOR.
Market Flow Strategy
Mister Y

GJ-Tue-01/07/25 TDA-Lots of speeches in NY, including BoJ Analysis done directly on the chart
Follow for more, possible live trades update!
I often share my live trades in Tradingview public chat in London session, stay tuned!
Being consistently profitable is not equal to be simply profitable.
Many but many claims that they are consistently profitable but
they need years of track record to be able to say that and not
months of track record.
Active in London session!
Not financial advice, DYOR.
Market Flow Strategy
Mister Y

Gold (XAUUSD) – July 1 Analysis📍 H4 Key LH Zone: 3348.500 – 3350.500
This is a major decision zone.
Current market structure:
🔸 M15 is in an uptrend with confirmed ChoCh + BoS
What to watch:
We’re approaching the H4 LH supply zone — now we observe how price behaves here.
🔹 If price breaks above this H4 LH zone:
→ HTF and LTF trends align to the upside
→ Potential continuation of the bullish move
🔹 If price respects and stays below this LH zone:
→ Then this recent up-move could be a pullback
→ We may see a new low forming — so be cautious
📍 M15 Zones for Long Setup (if confirmed):
• 3309.500 – 3312.500 (Order Block Zone)
• 3302.500 – 3304.600 (Demand Zone)
We will watch these levels closely.
If price respects these zones and gives M1 confirmation (ChoCh + BoS) — we’ll plan for long entries accordingly.
📖 Let structure guide your decisions. Let price speak first.
📘 Shared by @ChartIsMirror
Author of The Chart Is The Mirror — a structure-first, mindset-grounded book for traders

USD/JPY at a key support level tested multiple times🔻 USDJPY Sitting at Critical Support – Decision Point Ahead
USDJPY is currently hovering around the 143.60–143.65 zone — a major support level that has held multiple times in the past.
🔍 Price just completed a clean Head & Shoulders breakdown, and this zone marks the neckline retest area. We're now at a make-or-break point:
Break Below 143.60: Confirms bearish continuation, opens downside toward 143.00 → 142.20
Hold Above 143.60: Could lead to a short squeeze back to 144.20–144.50 zone
📊 Volume is rising as we test this key level — suggesting that big players are stepping in.
Trend remains bearish overall with price trading below the EMAs and rejecting trendline resistance.
⚠️ This is not the place to guess — wait for confirmation. A strong candle close below or a fakeout rejection will show the path.
Trade smart. Wait for the market to speak. No bias, just price action. 🧠

TRX Approaching Cup Breakout – Market Decision Imminent
TRX/USDT – Daily Chart Analysis
TRX is shaping a textbook Cup Pattern on the daily timeframe — a strong bullish continuation signal if confirmed. Price has gradually curved upward, and we are now testing the key resistance area at 0.29–0.30.
📌 Key Scenarios:
🔹 Bullish Breakout Scenario:
A confirmed breakout and daily close above 0.30 would validate the cup formation and set the stage for a rally toward the next target zones at 0.35 and 0.45 — measured based on the cup’s depth.
🔹 Bearish Rejection Scenario:
If the resistance holds, expect a pullback toward the midline (~0.24) for potential accumulation and base-building before the next move.
💡 Volume confirmation and breakout momentum are critical to watch here. The market is approaching a decision point.
🟢 Our directional bias remains bullish — we anticipate the breakout to occur, leading to an upward continuation. However, we’ll wait for confirmation of the breakout and completion of the pattern before entering a long position.

2025-06-30 - priceactiontds - daily update - nasdaqGood Evening and I hope you are well.
comment: Closing this high at the end of the month is as bullish as it gets. We are close to 23000 that I expect it to get hit. You never know where the top will be, so don’t try to pick it. Market is bullish and bullish only. Even if we print -2% tomorrow, there was no setup and no pattern for you to trade it on. It would be a huge bear surprise and you should never worry about them. Look for the path of least resistance and that is still long. At least for scalps. Bull channel is also still valid until clearly broken, which means a strong print below 22700 would do.
current market cycle: bull trend
key levels: 22600 - 23000
bull case: Bulls want 23000. Market is overbought but that does not matter if we can’t get more selling pressure. Long the pullbacks until it stops working. I can see this going to 23500 but it’s a rough guess and you should not trade based on those.
Invalidation is below 22200.
bear case: Bears got nothing. Don’t look for shorts. Daily close below 22600, then we can start thinking about lower prices again. I still expect this breakout to fail but as of now, we are only going up.
Invalidation is above 23500.
short term: Neutral but I will only scalp long until we see much much bigger selling pressure. 23000 is the obvious target and bears need something below 23700.
medium-long term - Update from 2024-06-29: No change in plans. I expect 20000 to get hit over the next 3 months and maybe 19000 again.
trade of the day: Any long around the high of last week (22823) has been profitable. It was a tight trading range but with a heavy bullish bias going in to today, long scalps were the obvious choice.

Battle Plan – 30 JuneHey, Snipers! It’s Sunday night, the real ones are back on the charts and the tourists are out of the game.
Last week, gold tried every trick in the book: fake bounces, liquidity sweeps, endless bearish grind. Every move up got sold. If you traded like a sniper, you’re still standing. If you chased dips blindly, you’re probably licking your wounds.
🌍Macro snapshot:
Dollar’s holding firm — no rescue from US news, just choppy reactions.
War headlines are everywhere, but structure is king: EMAs are stacked, every rally is just bait for liquidity.
Market’s running on fear and patience. Fast money gets chopped, disciplined money survives.
Sniper Mindset:
⛔No bias, no forced trades. The real win is in the waiting.
Structure will show you who’s in control — your job is to react, not predict.
🥷 GoldFxMinds Battle Plan – 30 June (Trade Nation Feed)
Demand (Buy) Zones:
3265–3245: The “half-mitigated” trap. Most buyers are already underwater — we wait for a real PA shift. First green candle? Ignore it. Let them get trapped.
3215–3200: This is the sniper zone for real discount hunters. If price freefalls, we watch for exhaustion, divergence, and a proper story. One clean engulfing here and the bounce can be massive.
3180–3160: Only for flash crash days — this is where pain turns into opportunity. But you wait for panic, not “hope trades.”
Supply (Sell) Zones:
3287–3300: First sell window — if price spikes, watch for that classic NY liquidity grab and an instant rejection.
3320–3335: The “don’t even try to buy here” zone. OB, FVG, and every EMA lines up — if the market gets here, expect a brutal fade.
3345–3360: Premium fantasy land for sellers. If bulls get cocky, this is where the big shorts reload for the next leg down.
🧠Sniper Mindset:
EMAs stacked above? No dreams, only discipline.
No confirmation in your zone? Stand down — the market isn’t your friend.
Most traders buy “cheap” — we buy right.
If the story’s not clear, patience pays. The first bounce is a trap, the second is the setup.
📝June’s about to end. Let’s close it out with surgical entries and sniper exits.
Stay sharp, stay humble, and let the crowd chase while we collect.
🧠Remember: green candles aren’t invitations, they’re traps for the impatient.
Wait for confluence, act on logic, and journal every single lesson.
Gold rewards discipline — not luck.
If you’re serious about gold, learn this:
Zone + confluence + confirmation = sniper entry.
Anything else is just gambling with a nice chart.
Review your trades, journal your mistakes, and stop blaming the market for your impatience.
Hit like🚀, follow, and drop your trading question if you want the next level.
See you on the Trade Nation feed.

Watching Gold Tap Liquidity Before the Next DropGold is still clearly in a bearish structure on the 1 hour chart. We’ve seen a solid break of structure to the downside and price is now retracing.
What stands out is how price is pushing back up into multiple areas of interest. There’s liquidity resting just above this minor high along with a fair value gap and the underside of a bearish trendline. This cluster makes it a likely spot for sellers to step back in.
If price fills the imbalance around that FVG, it could set up the next leg lower. I’ll be watching closely for signs of rejection in this zone to see if the market is ready to continue the move down.
No reason to rush in early. Let price come to the levels that matter and confirm with a reaction. Staying patient pays.

30.06.25 Morning ForecastPairs on Watch -
PEPPERSTONE:HK50
FX:EURJPY
FX:GBPJPY
FX:GBPUSD
A short overview of the instruments I am looking at for today, multi-timeframe analysis down to what I will be looking at for an entry. Enjoy!

GJ-Mon-30/06/25 TDA-Near end of month candle closureAnalysis done directly on the chart
Follow for more, possible live trades update!
I often share my live trades in Tradingview public chat in London session, stay tuned!
Random daily reminder:
Keep pushing forward, learn, make mistake, improve.
Have patience, you are getting there day by day.
-How would you see yourself in 3 years?
-Are you willing to take sacrifices in order to
create for yourself opportunity to live the life you want to?
Journal down consistently, so you keep track of your progress
and see how far you have come.
Don't underestimate the power of little compounds over time.
Active in London session!
Not financial advice, DYOR.
Market Flow Strategy
Mister Y

GU-Mon-30/06/25 TDA-Good support 1.37000&Good resistance 1.37500Analysis done directly on the chart
Follow for more, possible live trades update!
I often share my live trades in Tradingview public chat in London session, stay tuned!
The reality of life is that if you don't work for yourself,
you'll never achieve what you want.
Don't expect things to come, work for it, act on it.
Notice the difference between DOers and Dreamers.
Comment down below what do you think!
Active in London session!
Not financial advice, DYOR.
Market Flow Strategy
Mister Y

USDJPY Daily TF - June 29th, 2025USDJPY Daily Neutral Idea
Monthly - Bullish
Weekly - Bearish
Daily - Bearish
I’m looking at the Daily time frame here as this is the only clear picture for price action in terms of trends. The 4hour looks like price action can’t make a decision so we will wait for price action to get closer to some major zones.
Bearish Continuation - Ideally, we want to see price action touch 147.500 again followed by convincing bearish rejection. Look to target lower toward major support levels if this happens.
Aside from this potential setup we don’t have much to look at here on UJ.

GBPJPY ForecastLooking long up to 200.00 levels then seeking bearish PA to test the June lows. This is only validated on bearish PA on H4 or Daily.
